Abstract
Highly fluorescent gold clusters have been synthesized in basic aqueous solution by using lysozyme as reducing and stabilizing agents. The lysozyme-stabilized gold fluorescent clusters (LsGFC) have an average size of 1 nm and emission ~ 657 nm. The fluorescence could be specifically quenched by Hg2+, so the LsGFC can be used as a sensor for sensitive and selective Hg2+ detection with a detection limit of 10 nM.
Introduction
Fluorescent nanomaterials have shown great promise for applications such as sensing, imaging, photovoltaics and light emitting devices.1–5 Among the fluorescent nanomaterials reported to date, noble metal clusters, such as gold and silver clusters, have received much attention recently owning to their ultra-small size, non-toxicity, and highly fluorescent properties.6–8
To synthesize these highly fluorescent noble metal clusters, several methods have been developed. For example, silver fluorescent clusters have been prepared by using polymer, dendrimer, peptide and DNA as both template and stabilizer.9–12 The gold fluorescent clusters (GFC) could be synthesized by either a chemical reduction approach in the presence of thiol ligands or an etching process using polymers.13,14 Recently, an exciting new method of GFC synthesis has been developed by using protein bovine serum albumin (BSA) as sole reduction agent at high pH by Ying and coworkers.15 Inspired by this discovery, we wonder whether the synthesis method can be applied to using proteins other than BSA. Furthermore, previous studies showed that there were specific and strong interactions between Hg2+ and Au+.16–19 Therefore, it would be interesting to investigate the effects of Hg2+ on fluorescence properties of the protein-based GFC and explore the use of this interaction as sensors for metal ions such as Hg2+.
Mercury is a pollutant found in water, food sources, soil, and could cause damages to central nervous system, endocrine system, brain, and even kidney by interacting with thiol groups in protein and aminophospholipids.20,21 To monitor and detect Hg2+, a number of sensors have been developed by using organic molecules, oligonucleotides, DNAzymes, nano-materials, conjugated polymers, proteins, liposomes as sensing elements.8,20,22–28 Here we report the preparation of lysozyme-stabilized gold fluorescent clusters (LsGFC) by mixing lysozyme and HAuCl4 under basic conditions, and its application as a Hg2+ sensor, with high sensitivity and selectivity. During the preparation of our manuscript, Ying and coworkers reported a Hg2+ sensor by using BSA stabilized GFC (BsGFC) independently.16 Therefore the two protein-based GFC systems are compared to find generality and differences. A preliminary survey of several proteins suggest that only selected proteins can be used to synthesize GFC under similar conditions used for LsGFC synthesis.
Experimental section
Chemicals and materials
Chloroauric acid and lysozyme lyophilized powder (from chicken egg white) were purchased from Sigma-Aldrich Chemical Co. Sodium hydroxide and all other chemicals were obtained from Fisher Scientific Inc. Water used throughout all experiments was purified by a Milli-Q system (Millipore, Bedford, MA, USA).
Instrumentation
UV-visible spectra were obtained on a Cary 5000 spectrophotometer (Varian, USA). X-ray photoelectron spectroscopy (XPS) data were collected on a Kratos AXIS X-ray photoelectron spectrometer. Fluorescent spectra were recorded on a FluoroMax-P fluorimeter (HORIBA Jobin Yvon Inc., Edison, NJ) with a constant temperature control at 25 °C for steady state data and at 37 °C for the kinetics. Transmission electron microscopy (TEM) images were acquired on JEOL 2010 LaB6 transmission electron microscopy at the acceleration voltage of 200 kV.
Synthesis of lysozyme-stabilized gold fluorescent cluster (LsGFC)
The LsGFC samples were prepared according to the following procedure: First, 100 uL of 10 mg mL−1 lysozyme aqueous solution and 100 uL of 4 mM HAuCl4 aqueous solution were added into 100 uL of water and mixed together. After about 5 min of mixing, 10 uL of 1 M NaOH was added, the reaction solution was further mixed and then incubated at 37 °C overnight. The LsGFC samples thus prepared were used directly for characterization or as probes for Hg2+ detection.
Hg2+ detection using the LsGFC
A typical Hg2+ detection process includes addition of 15 μL of different concentrations of Hg2+ stocking solution to 135 μL of the as-prepared LsGFC (~ 34 μM). After one minute of mixing, 130 μL of the Hg2+-LsGFC solution was used to record the fluorescent spectra at 25 °C.
To examine the selectivity of Hg2+ detection using the LsGFC probes, 15 uL of other metal ions (i.e. Ca2+, Cd2+, Co2+, Cu2+, Mg2+, Mn2+, Ni2+, Pb2+, and Zn2+) were used instead of Hg2+.
Results and discussion
Preparation and characterization of the LsGFC
The highly fluorescent LsGFC was prepared by mixing lysozyme and HAuCl4 at basic conditions and a further incubation at 37 °C. Au3+ in HAuCl4 could be reduced to Au0 by tyrosine residues in lysozyme at high pH and thus the LsGFC were formed.15 The formation of the LsGFC was confirmed by TEM data. Fig. 1 depicts typical TEM images of the LsGFC (Fig. 1(A) and (B)). The LsGFC is spherical in shape and has a diameter of about 1 nm, which is slightly bigger than BsGFC (~0.8 nm).15
Fig. 1.
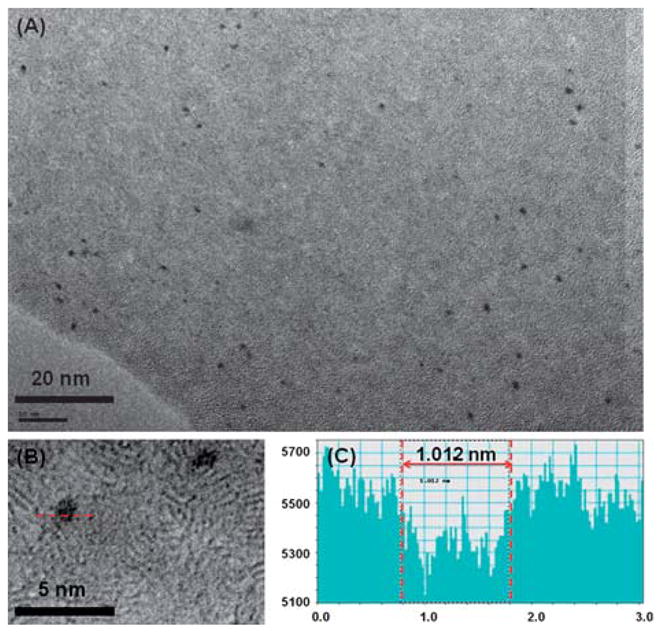
A typical TEM image of the as-prepared LsGFC (A), (B) the higher magnification image of panel (A), (C) the corresponding size of the particle line-crossed in panel (B).
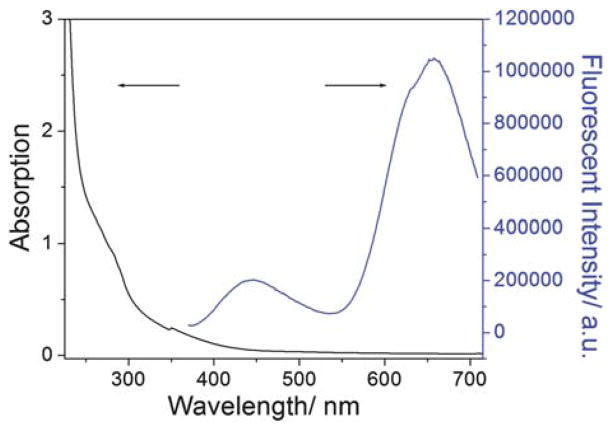
Fig. 2 shows the absorption and fluorescent spectra of the as-prepared LsGFC. No peak for gold surface plasmon resonance absorption was observed. The absorption from 300 nm to 450 nm was assigned to the as-prepared LsGFC. The fluorescent emission spectrum of LsGFC displays two peaks centered at 445 nm and 657 nm, with the later one being much stronger in intensity.
Fig. 2.
Absorption (left) and fluorescent (right) spectra of the as-prepared LsGFC. The excitation wavelength was 360 nm.
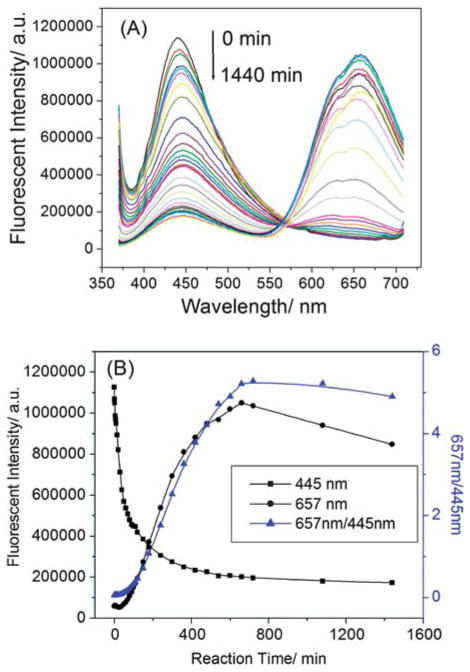
To assign the emission peaks, we performed a kinetics study. Fig. 3 shows time-dependent fluorescent spectra of LsGFC and the corresponding fluorescent intensity-reaction time curves. Upon the initiation of the reaction, a peak centered at 445 nm could be observed under 360 nm excitation. However, no emission peak centered at 657 nm, typical of gold nanocluster fluorescence, was observable in the first thirty minutes. This result indicated that the peak centered at 445 nm could be a lysozyme-HAuCl4 reaction intermediate prior to the formation of final LsGFC product. As the reaction went on, the peak at 445 nm decreased while the peak at 657 nm increased gradually, with a clear isosbestic point at 567 nm, suggesting conversion of the intermediate to LsGFC; the process completed in ~11 h (see eqn (1)).
Fig. 3.
Time-dependent fluorescent spectra of LsGFC (A) and the corresponding fluorescent intensity-reaction time curves (B). The excitation wavelength was 360 nm.
| (1) |
| (2) |
Our further studies showed that the peak centered at 445 nm was excitation wavelength dependent while the peak centered at 657 nm was not.15,16 Therefore, the former one could be assigned to the Raman signal of the reaction intermediate while the latter one should be fluorescence emission from the LsGFC. The photoluminescence quantum yield of 657 nm emission was ~5.6%, which was comparable with ~6% of the BsGFC.15 In addition, our LsGFC showed a red-shift emission peak at 657 nm in comparison with that of BsGFC at 640 nm. We believe this difference in emission peaks might be originated from the size difference of the GFCs synthesized with different proteins (1 nm of LsGFC vs. 0.8 nm of BsGFC).
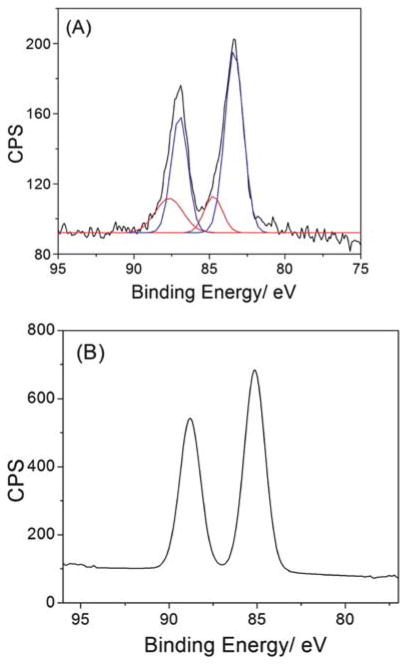
To further characterize the intermediate and the LsGFC product, XPS spectra were collected for the reaction mixture at 0 h and 12 h in order to determine the valence of gold (Fig. 4). The Au 4f XPS spectrum of the intermediate displays an Au 4f7/2 and Au 4f5/2 binding energy of 85.116 and 88.799 eV, respectively, suggesting that the intermediate is a lysozyme-Au+ complex (see eqn (2)) (Note: neither Au0 or Au3+ could be detected in the intermediate). On the other hand, the Au 4f XPS spectrum of the final LsGFC product could be deconvoluted into two distinct components: 83.371 eV (Au 4f7/2) and 86.982 (Au 4f5/2) eV, typical of Au0, and 84.744 eV (Au 4f7/2) and 87.567 (Au 4f5/2) eV, characteristic for Au+, with the Au0 as dominant species, accounting for 75.6% of the intensity. Based on these XPS data, the valence of gold was +1 in the intermediate, while the gold was a mixture of Au0 and Au+ in the LsGFC. The Au0 in LsGFC could be assigned to the core of the gold cluster, while the Au+ could be assigned to the gold atoms on the surface of the gold cluster and the un-reduced [lysozyme-HAuCl4].15,16 The lysozyme-Au+ complex was formed due to the facts: 1) HAuCl4 was a fairly strong acid and could denature lysozyme partially, which made the amino acid residues in lysozyme accessible, and 2) HAuCl4 was a strong oxidizing agent which could be reduced to Au+ by the reducing amino acids in lysozyme.29 However, the gold cluster of 0 valence could only be produced at high pH where the tyrosine residue could further reduce the Au+ to Au0. So the final product of LsGFC could emit the 657 nm fluorescence.
Fig. 4.
XPS spectra of Au 4f of the as-prepared LsGFC (A) and lysozyme-HAuCl4 complex alone (B) deposited on the silica wafer. In panel (A), the original spectrum is in black, the Au+ 4f spectrum after analysis is in red, and the Au0 4f spectrum after analysis is in blue.
Hg2+ detection using the As-prepared LsGFC as fluorescent probes
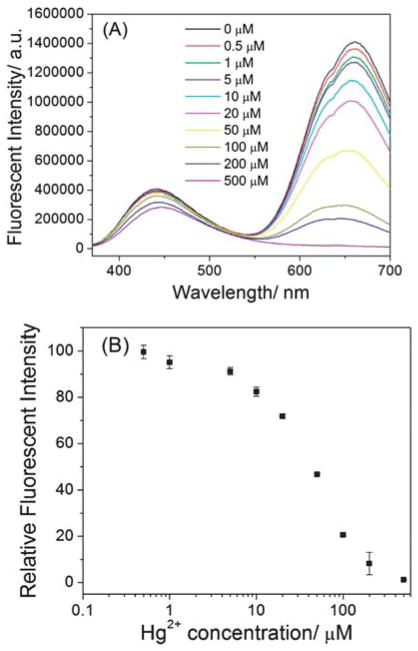
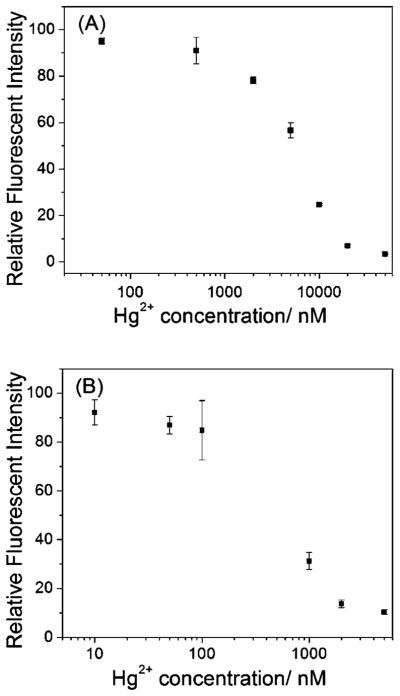
As shown in Fig. 5A, the emission intensity of the 660 nm peak decreased as the Hg2+ concentration increased. However, the emission intensity of the 445 nm peak was not significantly changed with the Hg2+ concentrations. This result indicated that the fluorescent quenching by Hg2+ was originated from gold cluster but not the lysozyme-Au+ complex. Using the as-prepared LsGFC as probes, Hg2+ concentrations from 500 nM to 500 μM could be readily detected with a detection limit of 500 nM. By lowering the concentration of the LsGFC, we could achieve more sensitive detection of Hg2+. As depicted in Fig. 6A, from 50 nM to 50 μM Hg2+ could be detected using the 10% LsGFC (~ 3.4 μM), which was one order of magnitude lower than the one using as-prepared LsGFC. Furthermore, if using 1% LsGFC as probes (~ 0.34 μM), the detection range for Hg2+ detection could be tuned from 10 nM to 5000 nM range (Fig. 6B); this dynamic range could meet the Hg2+ detection requirement for drinking water of the U.S. Environmental Protection Agency, which sets the maximum contamination level at 10 nM.
Fig. 5.
(A) The fluorescent spectra of as-prepared LsGFC probes (~ 34 μM) in the absence and presence of different concentrations of Hg2+, (B) the relative fluorescent intensity at 660 nm vs. Hg2+ concentration. The excitation wavelength was 360 nm. The error bars represent the standard deviation of three measurements.
Fig. 6.
The relative fluorescent intensity at 655 nm vs. Hg2+ concentration by using 10% diluted LsGFC probes (~ 3.4 μM) (A) and 1% diluted LsGFC probes (~ 0.34 μM) (B). The excitation wavelength was 360 nm. The error bars represent the standard deviation of three measurements.
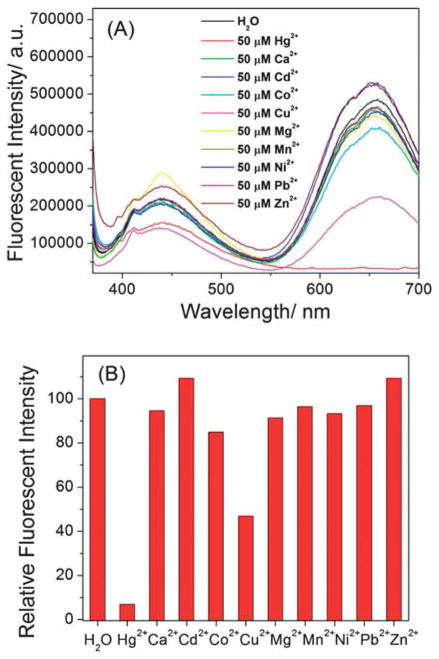
To investigate selectivity of the system, other divalent metal ions (Ca2+, Cd2+, Co2+, Cu2+, Mg2+, Mn2+, Ni2+, Pb2+, and Zn2+) as control were tested under the same condition. As shown in Fig. 7, all the other metal ions tested except Cu2+ at the same concentration (50 μM) could not quench the LsGFC’s fluorescence. 50 μM of Cu2+ could partially quench the LsGFC’s fluorescence. Therefore both the sensor developed here and the sensor based on BsGFC showed high sensitivity and selectivity towards Hg2+ detection.15,16
Fig. 7.
(A) The fluorescent spectra of 10% diluted probes LsGFC (~ 3.4 μM) in the absence and presence of 50 μM different metal ions, (B) the relative fluorescent intensity at 657 nm vs. metal ions. The excitation wavelength was 360 nm.
Comparison between the LsGFC and BSA Stabilized GFC
Since two protein systems, BSA and lysozyme, have been independently synthesized and used for Hg2+ sensing, we compare their properties in Table 1. Both GFCs were highly fluorescent, with similar quantum yields. The LsGFC is slightly larger than the BsGFC, and had a red-shift fluorescent emission. To find out if any proteins can be used to form GFC, we conducted a preliminary survey of four other proteins (cellular retinoic acid-binding protein II (CRABP), catalase from bovine liver, myoglobin from equine skeletal muscle and peroxidase from horseradish), and found only CRABP could form GFC under the conditions used for LsGFC (see Figures S6–S9†). These results suggest that many proteins, although not all proteins, can be used to synthesize GFC, which can serve as Hg2+ sensors, and the fluorescent prosperities of the clusters could be fine-tuned by different proteins. Further careful studies are needed to elucidate detailed structural features responsible for formation of GFC and metal ion sensing.
Table 1.
Properties of LsGFC and BsGFC
Conclusions
In summary, we have demonstrated a way to prepare highly fluorescent gold clusters by using lysozyme as reducing and stabilizing agents. Together with a previous report by Ying and coworkers, the results demonstrated that proteins can be used to synthesize highly fluorescent gold clusters, and can be used as a highly sensitive and selective label free sensor for Hg2+ though Hg2+ specific quenching of GFC.
Supplementary Material
Acknowledgments
This work is supported by the U.S. Department of Energy (DE-FG02-08ER64568), National Institute of Health (ES16865), and the National Science Foundation (Grant No. CTS-0120978, CMMI-0749028 and DMR-0117792). TEM experiments were carried out in part in the Frederick Seitz Materials Research Laboratory Central Facilities, University of Illinois, which are partially supported by the U.S. Department of Energy under grants DE-FG02-07ER46453 and DE-FG02-07ER46471.
Footnotes
Electronic supplementary information (ESI) available: Optimization of the reaction conditions for preparing the LsGFC. See DOI: 10.1039/c0an00046a
References
- 1.Robel I, Subramanian V, Kuno M, Kamat PV. J Am Chem Soc. 2006;128:2385–2393. doi: 10.1021/ja056494n. [DOI] [PubMed] [Google Scholar]
- 2.Steckel JS, Snee P, Coe-Sullivan S, Zimmer JR, Halpert JE, Anikeeva P, Kim LA, Bulovic V, Bawendi MG. Angew Chem, Int Ed. 2006;45:5796–5799. doi: 10.1002/anie.200600317. [DOI] [PubMed] [Google Scholar]
- 3.Green M. Angew Chem, Int Ed. 2004;43:4129–4131. doi: 10.1002/anie.200301758. [DOI] [PubMed] [Google Scholar]
- 4.Chan WCW, Nie SM. Science. 1998;281:2016–2018. doi: 10.1126/science.281.5385.2016. [DOI] [PubMed] [Google Scholar]
- 5.(a) Alivisatos AP, Gu WW, Larabell C. Annu Rev Biomed Eng. 2005;7:55–76. doi: 10.1146/annurev.bioeng.7.060804.100432. [DOI] [PubMed] [Google Scholar]; (b) Wang Z, Lu Y. J Mater Chem. 2009;19:1788–1798. doi: 10.1039/B813939C. [DOI] [PMC free article] [PubMed] [Google Scholar]
- 6.Zheng J, Nicovich PR, Dickson RM. Annu Rev Phys Chem. 2007;58:409–431. doi: 10.1146/annurev.physchem.58.032806.104546. [DOI] [PMC free article] [PubMed] [Google Scholar]
- 7.Guo WW, Yuan JP, Wang EK. Chem Commun. 2009:3395–3397. doi: 10.1039/b821518a. [DOI] [PubMed] [Google Scholar]
- 8.Huang CC, Yang Z, Lee KH, Chang HT. Angew Chem, Int Ed. 2007;46:6824–6828. doi: 10.1002/anie.200700803. [DOI] [PubMed] [Google Scholar]
- 9.Shang L, Dong SJ. Chem Commun. 2008:1088–1090. doi: 10.1039/b717728c. [DOI] [PubMed] [Google Scholar]
- 10.Zheng J, Dickson RM. J Am Chem Soc. 2002;124:13982–13983. doi: 10.1021/ja028282l. [DOI] [PubMed] [Google Scholar]
- 11.Yu J, Patel SA, Dickson RM. Angew Chem, Int Ed. 2007;46:2028–2030. doi: 10.1002/anie.200123456. [DOI] [PMC free article] [PubMed] [Google Scholar]
- 12.Petty JT, Zheng J, Hud NV, Dickson RM. J Am Chem Soc. 2004;126:5207–5212. doi: 10.1021/ja031931o. [DOI] [PubMed] [Google Scholar]
- 13.Zheng J, Petty JT, Dickson RM. J Am Chem Soc. 2003;125:7780–7781. doi: 10.1021/ja035473v. [DOI] [PubMed] [Google Scholar]
- 14.Duan HW, Nie SM. J Am Chem Soc. 2007;129:2412–2413. doi: 10.1021/ja067727t. [DOI] [PubMed] [Google Scholar]
- 15.Xie JP, Zheng YG, Ying JY. J Am Chem Soc. 2009;131:888–889. doi: 10.1021/ja806804u. [DOI] [PubMed] [Google Scholar]
- 16.Xie JP, Zheng YG, Ying JY. Chem Commun. 2010;46:961–963. doi: 10.1039/b920748a. [DOI] [PubMed] [Google Scholar]
- 17.Burini A, Fackler JP, Galassi R, Grant TA, Omary MA, Rawashdeh-Omary MA, Pietroni BR, Staples RJ. J Am Chem Soc. 2000;122:11264–11265. [Google Scholar]
- 18.Kim M, Taylor TJ, Gabbai FP. J Am Chem Soc. 2008;130:6332–6333. doi: 10.1021/ja801626c. [DOI] [PubMed] [Google Scholar]
- 19.Pyykko P. Angew Chem, Int Ed. 2004;43:4412–4456. doi: 10.1002/anie.200300624. [DOI] [PubMed] [Google Scholar]
- 20.Yigit MV, Mishra A, Tong R, Cheng JJ, Wong GCL, Lu Y. Chem Biol. 2009;16:937–942. doi: 10.1016/j.chembiol.2009.08.011. [DOI] [PubMed] [Google Scholar]
- 21.Girault L, Lemaire P, Boudou A, Debouzy JC, Dufourc EJ. Eur Biophys J. 1996;24:413–421. doi: 10.1007/BF00576713. [DOI] [PubMed] [Google Scholar]
- 22.(a) Ono A, Togashi H. Angew Chem, Int Ed. 2004;43:4300–4302. doi: 10.1002/anie.200454172. [DOI] [PubMed] [Google Scholar]; (b) Chan DS, Lee H, Che C, Leung C, Ma D. Chem Commun. 2009:7479–7481. doi: 10.1039/b913995h. [DOI] [PubMed] [Google Scholar]
- 23.(a) Yoon S, Miller EW, He Q, Do PH, Chang CJ. Angew Chem, Int Ed. 2007;46:6658–6661. doi: 10.1002/anie.200701785. [DOI] [PubMed] [Google Scholar]; (b) Campos BB, Algarra M, Alonso B, Casado CM, Esteves da Silva JCG. Analyst. 2009;134:2447–2452. doi: 10.1039/b914302e. [DOI] [PubMed] [Google Scholar]; (c) Chen Y, Hua B, Hong W, Shi G. Analyst. 2009;134:2081–2086. doi: 10.1039/b910603k. [DOI] [PubMed] [Google Scholar]; (d) Lu N, Shao CY, Deng ZX. Analyst. 2009;134:1822–1825. doi: 10.1039/b908018j. [DOI] [PubMed] [Google Scholar]
- 24.Wang Z, Lee JH, Lu Y. Chem Commun. 2008:6005–6007. doi: 10.1039/b812755g. [DOI] [PMC free article] [PubMed] [Google Scholar]
- 25.(a) Liu J, Lu Y. Angew Chem, Int Ed. 2007;46:7587–7590. doi: 10.1002/anie.200702006. [DOI] [PubMed] [Google Scholar]; (b) Li D, Wieckowska A, Willner I. Angew Chem, Int Ed. 2008;47:3927–3931. doi: 10.1002/anie.200705991. [DOI] [PubMed] [Google Scholar]; (c) Freeman R, Finder T, Willner I. Angew Chem, Int Ed. 2009;48:7818–7821. doi: 10.1002/anie.200902395. [DOI] [PubMed] [Google Scholar]
- 26.(a) Liu XF, Tang YL, Wang LH, Zhang J, Song SP, Fan CH, Wang S. Adv Mater. 2007;19:1471–1472. [Google Scholar]; (b) Zhu Z, Su Y, Li J, Li D, Zhang J, Song SP, Zhao Y, Li GX, Fan CH. Anal Chem. 2009;81:7660–7666. doi: 10.1021/ac9010809. [DOI] [PubMed] [Google Scholar]
- 27.Lee JS, Mirkin CA. Anal Chem. 2008;80:6805–6808. doi: 10.1021/ac801046a. [DOI] [PubMed] [Google Scholar]
- 28.Chen P, He CA. J Am Chem Soc. 2004;126:728–729. doi: 10.1021/ja0383975. [DOI] [PubMed] [Google Scholar]
- 29.Ji XH, Song XN, Li J, Bai YB, Yang WS, Peng XG. J Am Chem Soc. 2007;129:13939–13948. doi: 10.1021/ja074447k. [DOI] [PubMed] [Google Scholar]
Associated Data
This section collects any data citations, data availability statements, or supplementary materials included in this article.


