

Abstract
Purpose
Stroking the whiskers of a rat is known to increase cerebral blood flow and glucose utilization in the somatosensory cortex. We sought to determine if this activation could be detected with small animal PET and [18F]FDG.
Methods
Awake rats were co-injected with [18F]FDG and [14C]DG, and during uptake of the tracers, either 5, 10, or 15 whiskers on one side of the face were continuously stimulated. At the end of uptake the animal was killed and imaged with the ATLAS small animal PET scanner. 14C autoradiography was then performed on brain sections obtained from each animal, and increases in tracer uptake in the somatosensory cortex were compared to those determined with PET.
Results
Both methods showed increases in [18F]FDG and [14C]DG uptake in the somatosensory cortex in response to stimulation of as few as five whiskers. However, the magnitude of activation determined from the PET images was less than that from autoradiography due to the lower spatial resolution of the PET scanner.
Conclusions
ATLAS small animal PET imaging with [18F]FDG can be used to assess neuronal functional activity in vivo.
Keywords: small animal imaging; PET, [18F]FDG; [14C]DG; whisker stimulation
INTRODUCTION
Neuronal functional activation is normally associated with increases in local cerebral glucose utilization (lCMRglc) and blood flow (lCBF) in anatomic stations of the activated neural pathways, and these associations are now widely exploited to map regions of the brain involved in specific neural and cognitive processes. The increases in lCMRglc appear to result mainly from activation of Na+, K+-ATPase activity needed to restore ionic gradients degraded by the spike activity [1]. Whisker-stroking has been shown to result in substantial increases in lCBF in four stations of the pathway examined [2]. Unilateral stroking of whiskers in rats has also been shown to increase glucose utilization in the somatosensory cortex [3,4].
Changes in lCMRglc reflect either physiological responses to alterations in regional functional activity or pathological conditions, such as brain tumors, epileptic foci, etc. These changes have generally been detected in small animals by means of the autoradiographic [14C]deoxyglucose ([14C]DG) method [5], but with the increasing availability of high resolution small animal PET scanners, many such studies are now being carried out with 2-[18F]fluoro-2-deoxyglucose ([18F]FDG) and PET [6]. Although PET scanning confers the advantage of allowing repeated longitudinal determinations in the same animals, its spatial resolution is more than an order of magnitude lower that that of quantitative autoradiography [7]. Changes in tracer uptake that are small in magnitude and/or extent, therefore, may not be detectable with PET. The present study was carried out to determine if the Advanced Technology Laboratory Animal Scanner (ATLAS) [8], a small animal PET scanner developed at the National Institutes of Health, could be used to detect changes in [18F]FDG uptake in the somatosensory cortex evoked by unilateral vibrissal stimulation of 5, 10, or 15 whiskers in rats. [18F]FDG uptake measured with the ATLAS scanner was compared with [14C]DG uptake determined with quantitative autoradiography.
MATERIAL AND METHODS
Chemicals
Halothane was purchased from Halocarbon (River Edge, NJ, U.S.A.). Euthanasia solution (Beuthanasia-D special) was obtained from Schering-Plough Animal Health Corp (Union, NJ, U.S.A.). 2-Deoxy-D-[1-14C]glucose was purchased from NEN DuPont (now PerkinElmer Life and Analytical Sciences, Inc., Boston, MA, U.S.A), and [18F]FDG was synthesized by a previously reported method routinely used in our facility [9].
System characteristics of ATLAS small animal PET scanner
All PET measurements were obtained with the ATLAS small animal scanner which has an 11.8 cm ring diameter, 8-cm aperture, 6.9-cm effective transverse field-of-view, and 2-cm axial field-of-view. The scanner consists of 18 “phoswich”, or depth-of-interaction, detector modules surrounding the imaging volume. Its spatial resolution is about 1.8 mm full-width at half maximum (FWHM) in the central field of view with filtered back-projection reconstruction and better than 1.5 mm when 3D ordered subset-expectation maximization (3D OSEM) reconstruction is employed with resolution recovery and exact positioning of the lines-of-response [8,10]. Sensitivity is 1.8% with a window of 250 to 650 keV and 2.7% with a window of 100–650 keV [8].
Animal Preparation
Normal adult male Sprague-Dawley rats (n=8) (220–245 g) were purchased from Charles River Laboratories (Wilmington, MA, U.S.A.) and maintained in a climate-controlled room on a 12 hour light/dark cycle with food and water available ad libitum. They were deprived of food but allowed free access to water for 16 hours prior to surgical preparation for the experiments. All animal procedures were in strict accordance with the National Institutes of Health “Guide for the Care and Use of Laboratory Animals” and approved by the NIH Clinical Center Animal Care and Use Committee. Animals were anesthetized with halothane (5% for induction and 1–1.5% for maintenance in 30% O2 / 70% N2O). Polyethylene catheters (PE 50; Clay Adams) were inserted into both femoral arteries and the left femoral vein. One arterial catheter was used for continuous monitoring of mean arterial blood pressure (MABP), and the other for sampling of arterial blood. The venous catheter was used for injection of radiochemical tracers. After the catheterizations, surgical wounds were treated with 5% lidocaine ointment and sutured. All except the 5, 10 or 15 vibrissae on the left (experimental) side of the face that were to be stimulated were cut close to the skin; vibrissae on the right (control) side of the face were left intact. We studied 8 rats, subdivided in three groups: 2 had 5 stimulated whiskers, 3 had 10 stimulated whiskers and 3 had 15 stimulated whiskers. Each animal was then restrained on a lead brick with a loose-fitting plaster cast around its pelvis, which prevented locomotion but allowed free movement of the upper body. The effects of immobilization stress on lCMRglc have been investigated by directly comparing local cerebral glucose utilization in immobilized and non-immobilized rats; no significant differences have been found [11,12]. Duration of anesthesia during the surgical preparation was usually about 30 min. Body temperature was monitored throughout the surgical preparations and experimental periods by a rectal probe and maintained at 37°C by a thermostatically controlled heating lamp (model 73A; Yellow Springs Instrument Co., Yellow Springs OH, U.S.A.). At least 3 h were allowed for recovery from the surgery and anesthesia before the vibrissal stimulation study.
Physiological Variables
Mean arterial blood pressure (MABP) was monitored continuously in all animals with a Digi-Med Blood Pressure Analyzer (Model 300; Micro-Med, Louisville, KY, U.S.A) that had previously been calibrated with an air-damped mercury manometer. Arterial blood partial pressures of CO2 (PACO2) and O2 (PAO2) and pH were measured with a blood-gas analyzer (Model 288 Blood Gas System; Ciba-Corning Diagnostics Corp., Medfield, MA, U.S.A). Hematocrit was determined in arterial blood samples centrifuged in a Microfuge B (Beckman Instruments, Fullerton, CA, U.S.A.). Arterial plasma glucose concentration was determined with a Beckman Glucose Analyzer 2 (Beckman Instruments).
Experimental Procedure
After 3-hours for recovery from the surgery and anesthesia the experimental period was initiated by the intravenous injection of a 0.5 ml-mixture containing ~82.5 MBq of [18F]FDG and ~1184 kBq of [14C]DG. Unilateral stimulation of the whiskers remaining on the left side of the face was started simultaneously with the injection of the tracers and continued throughout the experimental period. The stimulation of the whiskers was achieved by means of a modified electric toothbrush vibrating at a frequency of 10 Hz. Arterial blood samples for determination of arterial PAO2, PACO2, pH, hematocrit, and glucose concentrations were drawn immediately before injection of the radiotracer and again approximately 35 minutes later; additional samples were taken to monitor glucose concentration and tracer activities during the study. Blood samples were collected in a polyethylene microcentrifuge tube coated with heparin-lithium-fluoride (Beckman Instruments) and centrifuged in the Beckman Microfuge B centrifuge (Beckman Instruments) to separate the plasma. Total blood volume sampled was approximately 1.6 ml. Forty-five min after injection of the radioactive tracers and initiation of whisker stimulation, the rat received an intravenous injection of the euthanasia solution. The timeline of the experimental procedure is illustrated in Fig. 1.
FIGURE 1.

Timeline of the experimental procedure.
PET Scanning and Analysis
Immediately following euthanasia, rats were placed in a prone position on the platform of the ATLAS scanner and, with the assistance of a laser attached to the scanner, positioned so that the center of the field of view was 12 mm caudal to the line between the lateral edges of the eyes. A single acquisition scan of the head over a period of 40 minutes was then performed.
PET images were reconstructed by 3D-OSEM [10]. No corrections were made for attenuation or scatter. Counts detected by the scanner were converted into MBq/cc by use of a cross-calibration factor (325.63 scanner cps/cc per MBq/cc) previously determined in a phantom study. Regions of interest (ROIs) were placed on coronal views of the 1.125 mm thick reconstructed brain image slices. ROIs were then placed over the analogous region in the contralateral hemisphere. The somatosensory cortex was located relative to the readily identified auditory cortex and thalamus as follows. The slice in which the auditory cortex appeared was identified. Moving caudally from this section, we identified the section either immediately before the thalamus appeared or where only the tip of the thalamus was apparent. The somatosensory cortex ROI was drawn on both hemispheres on this slice. Percent increases evoked by unilateral whisker stimulation were calculated as follows:
where Cstim=[18F] concentration in stimulated somatosensory cortex and Cunstim=[18F] concentration in unstimulated somatosensory cortex.
Autoradiography
Immediately following the ATLAS scan, the rat brains were removed from the skull, frozen in isopentane at −40° C, and mounted on a cryostat tissue holder. The brains were then cut into 20 µm-thick coronal sections, which were immediately heat-dried. These brain sections were autoradiographed for 14C uptake together with calibrated plastic [14C]methylmethacrylate standards on Ektascan EMC-1 X-ray film (Eastman Kodak Co., Rochester, NY, U.S.A.). The autoradiographic films were digitized with the Duoscan T1200 film scanner (AGFA, Ridgefield Park, NJ. U.S.A.) in units of optical density, and the local brain concentrations 14C were computed from the local tissue optical densities and those of the calibrated 14C standards.
Tracer uptake in the barrel field of the somatosensory cortex of the stimulated side of the brain was measured by encircling the activated region of the somatosensory cortex; an analogous region was placed on the contralateral side. The percent increases evoked by the unilateral whisker stimulation were calculated from the differences in 14C concentration in the stimulated and unstimulated sides as described above.
Computations and Statistical Analyses
Statistical significance of the changes in the physiological variables determined in the blood samples drawn in each rat immediately before and 35 minutes after onset of the experimental period was evaluated by paired Student’s t tests. The effects of unilateral vibrissal stimulation were determined in each animal by computing the percent differences between the concentrations of radioactive tracer in the stimulated cortex and non-stimulated cortex. Because total concentrations of label were not corrected for the small amount of residual free unphosphorylated [18F]fluorodeoxyglucose or [14C]deoxyglucose in the tissue, these percent differences approximate, but slightly underestimate, the side-to-side differences in the rates of glucose utilization. Therefore, these differences provide a conservative, lower bound estimate of the differences in rates of glucose utilization between the stimulated and unstimulated sides. The effects of the stimulation on cortical glucose utilization were statistically evaluated by one-tailed paired Student's t-tests on the concentrations of label in the stimulated and unstimulated sides. The differences between the effects of stimulation determined with [14C]DG autoradiography and with [18F]FDG/PET were statistically compared by Student's t-tests on the logarithms of the percent differences between the stimulated and non-stimulated cortex observed with the two tracers.
RESULTS
Physiological Variables
Mean arterial blood pressure, core body temperature, arterial blood hematocrit, and arterial plasma PAO2, PACO2 and pH are shown in Table 1. There were no significant differences in body temperature, blood gas tensions, or pH between the measurements taken immediately prior to the onset of the experimental period and those taken 35 min later (Table 1). There were, however, some small though statistically significant changes in some other physiological variables between the first and second measurements, i.e., a 14% decline in hematocrit (p<0.001), a 9% fall in MABP (p<0.001), and a 10% increase in arterial plasma glucose level (p<0.001), all probably secondary to the small amount of blood loss during the experiment.
TABLE 1.
Physiological variables of the rats.
| Time of Measurement | Mean Arterial Blood Pressure (MABP) (mmHg) (n=7) |
Body Temperature (°C) (n=7) |
Hematocrit (%) (n=5) |
Arterial Plasma Glucose Concentration (mg/dL) (n=6) |
Arterial Blood | ||
|---|---|---|---|---|---|---|---|
| pH (n=8) |
PACO2 (mmHg) (n=6) |
PAO2 (mmHg) (n=7) |
|||||
| Immediately prior to onset of experimental period |
120±6 | 36.9±0.1 | 50±4 | 142±13 | 7.37±0.05 | 42±3 | 78±4 |
| 35 min after onset of experimental period |
110±3* | 37.0±0.1 | 43±2* | 156±6* | 7.37±0.03 | 38±5 | 82±6 |
Values are means ± standard deviations for the number of animals indicated.
Indicates statistically significant change (p< 0.001 by Student’s t test).
Comparison of stimulation-induced increases in tracer uptake measured by ATLAS/PET-[18F]FDG Imaging and [14C]DG Autoradiography
Three groups of rats were studied in each of which five, 10, or 15 whiskers were unilaterally stimulated. In the 5-whisker stimulation, side-to-side differences in labeling in the somatosensory cortex of the control and stimulated sides were visually apparent in the [14C]DG autoradiograms, although labeling in the stimulated side was not statistically significantly higher than in the control side (p=0.075, paired Student's t-test). Differences in labeling were also visually apparent in the [18F]FDG-ATLAS images, and when labeling levels determined in ROIs placed on the somatosensory cortical areas in the PET images were compared, higher uptakes of radioactivity were found in the stimulated than in the control sides (p<0.05). When 10 or 15 whiskers were stimulated, side-to-side differences in labeling were statistically significant in the [14C]DG autoradiograms (10 whiskers, p<0.05; 15 whiskers, p<0.01). In the [18F]FDG-ATLAS images higher uptakes of label in the stimulated side approached statistical significance (p=0.068) when 10 whiskers were stimulated and reached statistical significance with 15-whisker stimulation (p<0.01). It is well known that each whisker eventually projects to its own corresponding barrel region in the somatosensory cortex, and, therefore, the greater the number of whiskers stimulated, the larger the extent of sensory cortex activated. Accordingly, in the present studies increasing the number of whiskers stimulated was associated with increasing size of the visibly activated area in the somatosensory cortex (Table 2). In the [18F]FDG/ATLAS scans, the 10-whisker stimulation produced well-defined, activated areas of 2.5 ± 0.4 mm3 (mean ± SD, n=3) and the 15-whisker stimulation produced activated areas of 2.7 ± 0.8 mm3 (mean ± SD, n=3) (Fig. 2). In order to determine if partial volume effects could be ameliorated, we also examined smaller ROIs centered on the maximally activated voxel in the somatosensory cortex. The percent difference in labeling between the stimulated and control sides was only slightly greater when smaller ROIs were evaluated (data not shown). When the differences between the percent differences in labeling of the control and stimulated sides found with [14C]DG autoradiography and with [18F]FDG/PET were compared by grouped comparison t-tests on the logarithms of the percent effects observed with the two tracers, the group of five whiskers approached statistical significance with p=0.061 whereas the groups of ten and fifteen whiskers reached statistical difference (p<0.05 and p<0.001, respectively) (Table 2).
TABLE 2.
Comparison of sensitivities of ATLAS/PET [18F]FDG scanning and [14C]DG autoradiography in detection of functional activation in somatosensory cortex by unilateral whisker stimulation in the rat.
| No. of Whiskers |
Animal | ATLAS/PET [18F]FDG Scan |
[14C]DG Autoradiography |
|
|---|---|---|---|---|
| Activated Volume (mm3) |
Percent difference in labeling between stimulated and unstimulated side |
Percent difference in labeling between stimulated and unstimulated side |
||
| 5 | A-7 B-9 Mean ± SD |
0.7 1.1 0.9±0.3 |
19% 23% 21±3% |
41% 29% 35±9% N.S. |
| 10 | D-4 E-8 F-10 Mean ± SD |
2.5 2.1 2.8 2.5±0.4 |
9% 27% 13% 16±10% |
50% --- 60% 55±7% ** |
| 15 | G-6 H-11 I-12 Mean ±SD |
3.2 3.2 1.8 2.7±0.8 |
19% 18% 23% 20±3% |
45% 65% 57% 56±10% *** |
N.S., not significant.
Statistically significantly higher than that detected with PET, p<0.05.
Statistically significantly higher than that detected with PET, p<0.001.
FIGURE 2.
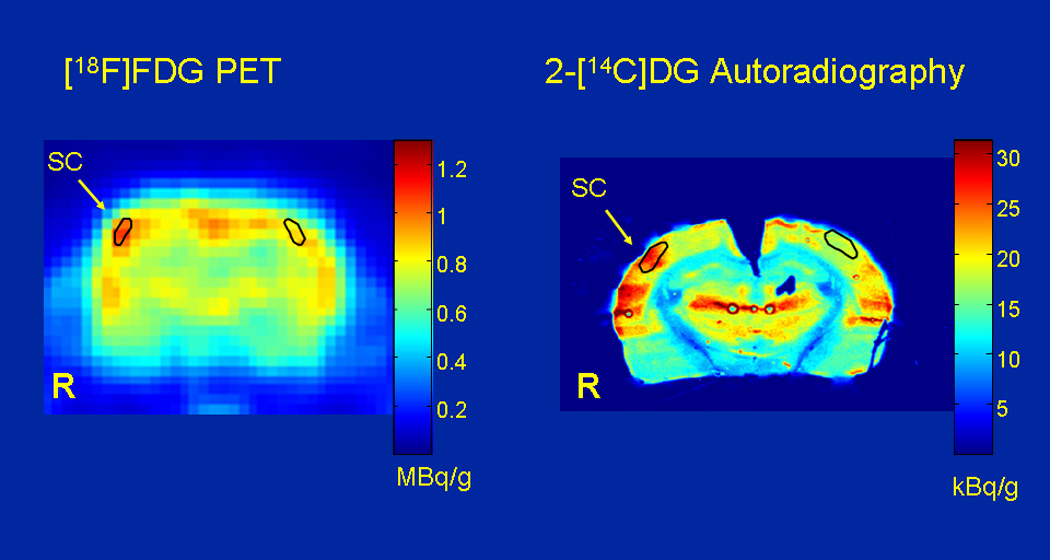
Comparison of [18F]FDG ALTAS PET image with the autoradiographic [14C]DG image in the same rat. The two tracers were co-injected, and during tracer uptake the animal was conscious, and 15 whiskers on the left side of the face were stroked at 10 Hz. After 45 minutes the animal was killed, placed on the scanner bed and scanned for 40 minutes with the ATLAS small animal PET scanner. The brain was then removed for 14C autoradiography. Unilateral whisker stroking increases lCMRglc in the barrel field of the somatosensory cortex (SC) on the side contralateral to the stimulation. In the animal shown, [18F]FDG uptake measured in the PET study was 19% higher in SC on the stimulated side compared to the unstimulated side whereas the 14C autoradiograms showed a 45% increase. The small area of activation can be detected by small animal PET, but due to partial volume effects, the magnitude of increase is not as great as that measured with quantitative autoradiography
DISCUSSION
Quantitative functional brain imaging is based largely on the regional changes in glucose utilization imaged by [14C]DG autoradiography in animals or [18F]FDG PET in humans. Autoradiography allows only one imaging session per animal, and small animal PET scanners have, therefore, been developed to enable repeated studies in the same animal. Repeated studies in the same animal have been limited, however, by the number of blood samples that can be drawn. By circumventing the need for multiple blood samples to characterize the blood input function, methods that derive blood input functions from PET images together with a small number of blood samples for calibration [e.g., 13, 14], may enhance the utility of small animal PET for repeated studies.
In the present study we have compared the capability of the ATLAS small animal PET scanner with that of [14C]DG autoradiography in imaging functional activation in the somatosensory cortex of the rat during vibrissal stimulation. Kornblum et al. [15] have also shown that metabolic activation in the somatosensory cortex by unilateral whisker stimulation in rats can be detected by [18F]FDG/small animal PET scanning. They did not, however, report on the number of stimulated whiskers nor compare the results with those obtained by autoradiography. In the present study, we attempted to define the limits of sensitivity of the [18F]FDG technique when used with the ATLAS PET scanner by varying the number of whiskers stimulated to determine the minimal number needed to produce detectable changes in the somatosensory cortex of conscious rats and by comparing the results with those obtained in the same rats by [14C]DG autoradiography. With 5, 10, or 15 whiskers stimulated, the ATLAS PET scanner was sensitive enough to detect greater tracer uptake in the stimulated side of the somatosensory cortex than on the contralateral control side although percent differences were lower than those obtained with [14C]DG autoradiography. The greater percent differences between stimulated and control sides found with autoradiography than with the PET scanning are probably due to the much greater spatial resolution and lower susceptibility to partial volume effects with autoradiography. Pain et al. [16] found a similar discrepancy between data obtained with a beta probe and with autoradiography in rats under α-chloralose anesthesia.
Although it goes beyond the scope of the present work, it would be worthwhile exploring the relationship between PET resolution and the degree to which the PET data underestimate the activation results by autoradiography. The 3D-OSEM reconstruction parameters (10 iterations at 16 subsets each) were chosen to strike a balance between improved resolution (1.5 mm 3DOSEM vs. 1.8 mm Filtered Back Projection) and acceptable noise, given the limited statistics of the PET data. Although slightly better resolution could theoretically be achieved [10] by iterating longer, this would come at the price of increased noise along with diminished reliability of the PET results.
The 3D-OSEM reconstruction code used in the present study did not support the correction for scatter and attenuation. These corrections should not, however, change the results in any significant way. The effect of attenuation can be thought of increasing image brightness throughout the rat brain by approximately 20–40%. While the magnitude of this increase varies across the brain, because we compared side-to side differences, it can be argued that the mirror symmetric ROIs on opposite sides of the somatosensenory cortex should be affected to the same degree. Thus, attenuation correction would increase all quantities entering the equation for %Effect by the same amount so that the results remain unchanged. Scatter creates a more or less flat background in the image. Background ROIs drawn outside the brain showed very small apparent activity (1–2%) compared to ROIs inside the brain. Both stimulated and unstimulated ROIs should contain the same scatter contribution. The scatter contribution will then cancel in the numerator of the %Effect ratio, but will remain in the denominator. If the scatter contribution were removed, we would expect %Effect to increase by 1–2%, which is insignificant compared to the differences in the PET vs. autoradiography activation results.
It should be noted that dynamic PET scanning was not used in the present study. Instead a single PET scan was carried out immediately at the end of the 45 minute period of tracer uptake, a time when the animals can be immobilized by either anesthesia or euthanasia with little if any effect on the tracer distribution [17]. This procedure was chosen to avoid the need to use anesthesia to immobilize the animal during the critical period of tracer uptake by the brain while it is being stimulated. General anesthetics are normally used specifically for the purpose of suppressing sensory functions, which could be expected to suppress or at least alter cerebral functional activation. Indeed, Nakao et al. [18] have found that even chloralose, an anesthesia which is alleged to have the least depressant effect on neural activity, markedly reduces the blood flow and metabolic responses in the somatosensory cortex to vibrissal stimulation to the point where they are hardly detectable. Shimoji et al. [19] also observed a reduction in uptake with isoflurane using 18F-FDG and ATLAS PET scanning. Until it is possible to subject animals to PET scanning without the need to immobilize them with anesthetic agents, it is advisable to scan after a period of cerebral tracer uptake during which the animals are in a conscious state.
In conclusion, ATLAS PET scanning is capable of detecting localized functional activations in very small volumes as evidenced when the effect is measured in as few as five barrels activated by the stimulation of five whiskers. Due to partial volume effects, however, the measured magnitude of the increases in tracer uptake is less with the ATLAS scanner than with [14C]DG autoradiography.
Footnotes
Publisher's Disclaimer: This is a PDF file of an unedited manuscript that has been accepted for publication. As a service to our customers we are providing this early version of the manuscript. The manuscript will undergo copyediting, typesetting, and review of the resulting proof before it is published in its final citable form. Please note that during the production process errors may be discovered which could affect the content, and all legal disclaimers that apply to the journal pertain.
CONFLICT OF INTEREST
The authors declare that they have no conflict of interest.
REFERENCES
- 1.Sokoloff L. Energetics of functional activation in neural tissues. Neurochem Res. 1999;24:321–329. doi: 10.1023/a:1022534709672. [DOI] [PubMed] [Google Scholar]
- 2.Adachi K, Takahashi S, Melzer P, Campos KL, Nelson T, Kennedy C, et al. Increases in local cerebral blood flow associated with somatosensory activation are not mediated by NO. Am J Physio. 1994;267:H2155–H2162. doi: 10.1152/ajpheart.1994.267.6.H2155. [DOI] [PubMed] [Google Scholar]
- 3.Melzer P, Van der Loos H, Dorfl J, Welker E, Robert P, Emery D, et al. A magnetic device to stimulate selected whiskers of freely moving or restrained small rodents: its application in a deoxyglucose study. Brain Res. 1985;348:229–240. doi: 10.1016/0006-8993(85)90441-x. [DOI] [PubMed] [Google Scholar]
- 4.McCasland JS, Carvell GE, Simons DJ, Woolsey TA. Functional asymmetries in the rodent barrel cortex. Somatosens Mot Res. 1991;8:111–116. doi: 10.3109/08990229109144735. [DOI] [PubMed] [Google Scholar]
- 5.Sokoloff L, Reivich M, Kennedy C, Des Rosiers MH, Patlak CS, Pettigrew KD, et al. The [14C]deoxyglucose method for the measurement of local cerebral glucose utilization: Theory, procedure and normal values in the conscious and anesthetized albino rat. J Neurochem. 1977;28:897–916. doi: 10.1111/j.1471-4159.1977.tb10649.x. [DOI] [PubMed] [Google Scholar]
- 6.Nikolaus S, Beu M, Wirrwar A, Vosberg H, Müller H-W, Larisch R. The contribution of small animal positron emission tomography to the neurosciences - a critical evaluation. Reviews in the Neurosciences. 2004;15:131–156. doi: 10.1515/revneuro.2004.15.2.131. [DOI] [PubMed] [Google Scholar]
- 7.Schmidt K, Smith CB. Resolution, sensitivity and precision with autoradiography and small animal positron emission tomography: implications for functional brain imaging in animal research. Nucl Med Biol. 2005;32:719–725. doi: 10.1016/j.nucmedbio.2005.04.020. [DOI] [PubMed] [Google Scholar]
- 8.Seidel J, Vaquero J, Green MV. Resolution uniformity and sensitivity of the NIH ATLAS small animal PET scanner: comparison to simulated LSO scanners without depth-of-interaction capability. IEEE Trans Nucl Sci. 2003;50:1347–1350. [Google Scholar]
- 9.Hamacher K, Coenen HH, Stöcklin G. Efficient stereospecific synthesis of no-carrier-added 2-[18F]-fluoro-2-deoxy-D-glucose using aminopolyether supported nucleophilic substitution. J Nucl Med. 1986;27:235–238. [PubMed] [Google Scholar]
- 10.Johnson CA, Seidel J, Vaquero JJ, Pascau J, Desco M, Green MV. Exact positioning for OSEM reconstructions on the ATLAS depth-of-interaction small animal scanner. Molecular Imaging and Biology. 2002;4 Suppl 1:22. [Google Scholar]
- 11.Soncrant TT, Holloway HW, Stipetic M, Rapoport SI. Cerebral glucose utilization in rats is not altered by hindlimb restraint or by femoral artery and vein cannulation. J Cereb Blood Flow Metab. 1988;8:720–726. doi: 10.1038/jcbfm.1988.119. [DOI] [PubMed] [Google Scholar]
- 12.Crane AM, Porrino LJ. Adaptation of the quantitative 2-[14-C]deoxyglucose method for use in freely moving rats. Brain Research. 1989;499:87–92. doi: 10.1016/0006-8993(89)91137-2. [DOI] [PubMed] [Google Scholar]
- 13.Kim J, Herrero P, Sharp T, Laforest R, Rowland DJ, Tai Y-C, et al. Minimally invasive method of determining blood input function from PET images in rodents. J Nucl Med. 2006;47:330–336. [PubMed] [Google Scholar]
- 14.Su K-H, Lee J-S, Li J-H, Yand Y-W, Liu R-S, Chen J-C. Partial volume correction of the microPET blood input function using ensemble learning independent component analysis. Phys Med Biol. 2009;54:1823–1846. doi: 10.1088/0031-9155/54/6/026. [DOI] [PubMed] [Google Scholar]
- 15.Kornblum HI, Araujo DM, Annala AJ, Tatsukawa KJ, Phelps ME, Cherry SR. In vivo imaging of neuronal activation and plasticity in the rat brain by high resolution positron emission tomography (microPET) Nat Biotechnol. 2000;18:655–660. doi: 10.1038/76509. [DOI] [PubMed] [Google Scholar]
- 16.Pain F, Besret L, Vaufrey F, Gregoire MC, Pinot L, Gervais P, et al. In vivo quantification of localized neuronal activation and inhibition in the rat brain using dedicated high temporal-resolution beta+ sensitive microprobe. Proc Natl Acad Sci USA. 2002;99:10807–10812. doi: 10.1073/pnas.162368899. [DOI] [PMC free article] [PubMed] [Google Scholar]
- 17.Matsumura A, Mizokawa S, Tanaka M, Wada Y, Nozaki S, Nakamura F, et al. Assessment of microPET performance in analyzing the rat brain under different types of anesthesia: comparison between quantitative data obtained with microPET and ex vivo autoradiography. NeuroImage. 2003;20:2040–2050. doi: 10.1016/j.neuroimage.2003.08.020. [DOI] [PubMed] [Google Scholar]
- 18.Nakao Y, Itoh Y, Kuang TY, Cook M, Jehle J, Sokoloff L. Effects of anesthesia on functional activation of cerebral blood flow and metabolism. Proc Nat Acad Sci USA. 2001;98:7593–7598. doi: 10.1073/pnas.121179898. [DOI] [PMC free article] [PubMed] [Google Scholar]
- 19.Shimoji K, Ravasi L, Schmidt K, Soto-Montenegro ML, Esaki T, Seidel J, et al. Measurement of Cerebral Glucose Metabolic Rates in the Anesthetized Rat by Dynamic Scanning with 18 F-FDG, the ATLAS Small Animal PET Scanner, and Arterial Blood Sampling. J Nucl Med. 2004;45:665–672. [PubMed] [Google Scholar]