

Abstract
Development of CRC involves a series of genetic alterations with altered expression of proteins and cell signaling pathways. Here, we identified that gal-4, a marker of differentiation, was down-regulated in CRC. The goal of this work was to determine the function of gal-4 in CRC. Toward this goal, the human colon biopsies and tissue microarrays containing a gradient of pathology were analyzed for gal-4 expression by immunohistochemistry. Cell proliferation, migration, motility, forced expression, knockdown, cell cycle and apoptosis assays were used to characterize gal-4 function. Immunohistochemistry identified that gal-4 expression was significantly down-regulated in adenomas and was essentially absent in invasive carcinomas. Forced expression of gal-4 in gal-4 -ve cells induced cell cycle arrest and retarded cell migration and motility. Further, gal-4 sensitized the cells to CPT-induced apoptosis. Gal-4 knockdown resulted in increased cell proliferation, migration and motility. Gal-4 was found to be associated with Wnt signaling proteins. Finally, gal-4 expression led to down-regulation of Wnt signaling target genes. This study demonstrates that loss of gal-4 is a common and specific event in CRC. This study also shows that gal-4 exhibits tumor suppressive effects in colorectal cancer cells in vitro. Through its ability to interact with, and down-regulate the functions of Wnt signaling pathway, gal-4 reveals a new dimension in the control of the Wnt signaling pathway. Thus, gal-4 may prove to be an important molecule in understanding the biology of CRC.
Keywords: Colorectal cancer, galectins, Wnt signaling, tumor suppressor
The luminal epithelial cells in the normal colon mucosa are differentiated. Characteristically, these cells undergo apoptosis and/or shed, and are continuously replaced by the maturing crypts. Maturation of crypts is fuelled by intestinal epithelial stem and progenitor cells located at the base of each crypt, resulting in the formation of different cell lineages that differentiate into specific functional cell types of the colon. This process of crypt epithelial cell proliferation, differentiation and migration toward the intestinal lumen is balanced by a variety of signaling pathways. A recent analysis of the gene expression profile along the crypt has further established the previous studies that as the colonic epithelia matures, there is a dramatic down-regulation of genes involved both in Wnt signaling and apoptosis 1. These studies indicate that epithelial cells at the colon top compartment are non-proliferative and undergo apoptosis with appropriate physiological or external stimuli. It is now well established that dysregulation of Wnt signaling pathway contributes to the loss of differentiation, a characteristic feature of colorectal cancer (CRC) (Reviewed in2, 3). The fundamental gatekeeper step in CRC development leading primarily to adenomas is the constitutive activation of the Wnt signaling pathway, usually by the loss of function of the classical tumor suppressor APC, less frequently by activating mutations in CTNNB1, a gene that codes for ß-catenin. Further steps in the progression of cancer are associated with activating mutations in KRAS and loss of p53 function.
Galectins, localized both intra- and extracellularly, participate in a variety of normal cellular functions and are aberrantly expressed in cancers4. Although as many as 15 mammalian galectins are identified so far [reviewed in5], isoforms with alternative splicing reported in the NCBI database greatly increase the number of galectins in the family. The facts that galectins share only partial amino acid sequence homology and certain galectins are uniquely expressed in a tissue-dependent manner raise a strong possibility that each galectin possesses a specific cellular function. For instance, galectin-4 (gal-4), a 323-amino acid (36 kDa) protein, is predominantly expressed in the luminal epithelia of the gastrointestinal tract6, 7. However, gal-4 was also detected in liver, breast, ovary and other tissues, which was up-regulated in the corresponding cancers8-11. In constrast, studies have shown that colon tumors contain reduced level of gal-4 mRNA compared to the normal colon crypt epithelia12-14. Therefore, the tissue-specific background is important in determining the functional significance of gal-4 for tumor development. Although gal-4 protein expression is used as marker of epithelial differentiation14, 15, neither the protein expression profile nor the function of gal-4 in CRC is known.
In this study, we sought to determine the function of gal-4. Our data demonstrate that gal-4 negatively regulates cell cycle, cell proliferation, migration and motility of CRC cells. Further, we show that gal-4 interacts with Wnt signaling pathway proteins and down-regulates Wnt signaling target genes. Our results reveal that gal-4 functions as a tumor suppressor and inhibits cell proliferation by down-regulating Wnt signaling.
MATERIALS AND METHODS
Reagents
Anti-gal-4 antibody raised in goat was purchased from R&D Biosystems (Minneapolis, MN). Bcl-2, axin and APC antibodies were purchased from Santa Cruz biotechnology (Santa Cruz, CA). All the other antibodies used in this study were obtained from Cell Signaling Technologies (Beverly, MA). Vectastain Elite ABC kit and biotinylated IgG was purchased from Vector Laboratories, Inc., Burlingame, CA. Camptothecin (CPT) was obtained from Sigma. The sources of other reagents were described previously 16.
Cell lines and culture conditions
Human CRC cell lines HT-29, LS-180, HCT-116, ATRFLOX and Caco-2 were obtained from the American Type Culture Collection, Vanassas, MD and cultured according to the Supplier's instructions.
Tissue specimens
Formalin-fixed, paraffin-embedded human colon tissue biopsies with equal representation of normal, adenomas and carcinomas were obtained from the archives of the Department of Cytopathology, Ameripath, Covenant Health System, Lubbock, TX. Normal colon tissue sections were gathered either from colon biopsies or normal areas of the CRC specimens as diagnosed by the pathologist. Colon cancer tissue microarrays with different pathologies and normal tissue were obtained from Biomax, Inc., Rockville, MD.
Immunohistochemistry
For immunohistochemistry, sections were deparaffinated in xylene, rehydrated in graded ethanol and water. The tissue sections on microscope glass slides were processed for antigen retrieval by microwaving twice for 5 min in 10 mM citrate, pH 6 and cooled to room temperature. The slides were rinsed in water and incubated with methanol-peroxide (70:30 (v/v) methanol : hydrogen peroxide) for 5 min at 40°C. The slides were washed and incubated with fetal bovine serum prepared in phosphate buffered saline (PBS) at 37°C for 1 h. Slides were washed and incubate with primary antibody solution prepared in PBS for 1 hr at 37°C. Slides were washed thrice with PBS and then incubated with secondary antibodies (biotinylated antibodies as recommended by the Vector Laboratories). Following this, slides were incubated with an avidin–biotin–peroxidase reagent (Vectastain Elite ABC kit, Vector laboratories, Burlingame, CA) and stained with a staining solution containing 3,3'-diaminobenzidine (DAB) and hydrogen peroxide for 10 min. Slides were counterstained with hematoxylin (Dako Corp), mounted, dehydrated and coverslipped. Bright field images were acquired using Olympus IX81 microscope and the acquisition was controlled by Slidebook software (Intelligent Imaging Innovations, Denver, CO). Tissue sections of normal colon were used as positive control. Negative controls in each experiment consisted of omission of the primary antibody in the staining procedure.
Image analysis of DAB labeled-immunostains
The DAB staining intensity of gal-4 in the tissues was quantitated by NIH ImageJ software using color deconvolution plugin17 with minor modifications in the macros. The stained and unstained regions in the tissue were used for optimizing the quantification process. Normal colon tissues were used as control to measure the average staining intensity level. This intensity level thus determined was used for threshold segmentation of the DAB stained areas of the region of interest. Following threshold segmentation, any outliers in the region of interest were removed (noise correction) and the staining intensity per unit area was calculated.
Immunocytochemistry
Immunocytochemistry of gal-4 was performed as described previously16. Briefly, cells growing on coverslips were washed in PBS and fixed using acetone : methanol (1:1 v/v) for 5 min at room temperature. The fixative was removed and the coverslips were air dried. Coverslips were washed in PBS and blocked in PBS containing 0.25% Nonidet-P40 and 1% fetal bovine serum (FBS) for 30 min. Coverslips were washed in PBS and incubated overnight at 4°C with primary antibody prepared in PBS containing 0.25% Tween-20 and 1% FBS. Coverslips were then washed and incubated with AlexaFluor-488 coupled secondary antibody and propidium iodide prepared in PBS containing 0.25% Tween-20 for 1 h. Coverslips were washed and mounted on microscope slides in anti-fade solution (Molecular Probes). Location of fluorescence of AlexaFluor-488 and propidium iodide in cells was determined using Leica confocal laser microscope (TCS SL; Leica Microsystems, Heidelberg, GmbH), with 63×1.4 oil objective and immersion oil, and the images were digitally recorded on a computer hard drive.
Wound healing assay
Cells (300,000) were seeded on 35 mm plates and allowed to grow to ~90% confluency. A scratch was made using a 10 μl plastic pipette tip and the width of the wound along the entire scratch was measured on the images taken at different time intervals of culturing. The average width of the scratch at 0 h was set at 100%, and the mean percentage of the scratch width remaining at subsequent time points was calculated.
Plasmids and transfection
Gal-4 plasmid (pCMV6-XL5/gal-4) and vector control (pCMV6-XL5) were purchased from Origene (Rockville, MD). Green fluorescent protein (GFP) expressing pEGFP-C1 plasmid was purchased from Clontech. Transfection of cells with these plasmids was carried out using Lipofectamine 2000 reagent (Invitrogen) as described previously 18.
RNA interference (RNAi's)
Stealth Select RNAi's (RNAi1, 5′-GGCUCAACGUGGGAAUGUCUGUUUA-3′; RNAi2, 5′-CCUUCCACUUCAAUCCGCGGUUUGA-3′; RNAi3, 5′-CCGGACAUUGCCAUCAACAGCUGAA-3′) against LGALS4 (human gal-4 gene; Accession: NM_006149) and Stealth RNAi negative control duplexes (high GC duplex) were purchased from Invitrogen, CA.
Electroporation
HT-29 cells were transfected with RNAi's and pEGFP-C1 by electroporation using Amaxa electroporator (Lonza Walkersville Inc., Walkersville, MD) with recommended solutions and transfection conditions. The cells were then grown in complete growth media and analyzed accordingly.
Cell cycle analysis
Cell cycle analysis was carried out by flow cytometry (FACScan Instrument, Becton Dickinson) using the data acquisition CellQuest software, as reported by others19. Briefly, subsequent to transfections, cells were washed in PBS and fixed in 70% ethanol. Cells were washed in PBS and stained with propidium iodide (5 μg/ml) solution. Cells were then analyzed for propidium iodide fluorescence by flow cytometry.
Cell proliferation assay
Cells were seeded in 96-well plates at a density of 10,000 cells/well and cell proliferation was determined by MTS assay (Aqueous Non-Radioactive Cell Proliferation Assay Kit, Promega, Madison, WI) according to the supplier's instructions. The RNAi-transfected cells (10,000/well) were transferred to 48-well plate, with each well containing 0.4 ml of growth media.
Cell motility assay
Cell motility was determined using 12-well Transwell Permeable Support inserts with polycarbonate filters with a pore size of 8 μm (Corning Costar, Lowell, MA), according to the manufacturer's instructions. Briefly, 100,000 cells were plated on each insert filter and were allowed to migrate toward complete growth media present in the lower chamber overnight. Non-migrated cells were removed and the migrated cells were stained with hematoxylin and counted under bright field microscope.
Apoptosis assay
Vector- and gal-4 plasmid-transfected cells treated with 5 μM CPT for 4 h were harvested and subjected to apoptosis assay using Annexin V-FITC Apoptosis detection kit (Calbiochem) according to the manufacturer's instructions. Cells were then analyzed by flow cytometry.
Other methods
Isolation of total RNA, RT-PCR, amplification of gal-4 transcript and sequencing of the cDNA fragments were carried out as described previously16. Immunoprecipitations were carried out using Universal Magnetic Co-immunoprecipitation kit (Active Motif, Carlsbad, CA). Preparation of whole cell lysates from CRC cells, protein estimation and western blotting were carried out as described previously16.
Statistical Analysis
Each of the experiments presented in this paper was carried out at least three different times using samples obtained from different experiments, with essentially identical results. Immunohistochemical staining of tissue sections was compared using one-way ANOVA with Bonferroni post-test. Statistical analyses between different treatments or groups were determined using ANOVA and post hoc multiple range testing as appropriate, using the GraphPad Prism software. Each of the columns represent mean with s.e.m., *P <0.05, **P <0.01, and ***P<0.001.
RESULTS
Gal-4 expression was downregulated in human CRC
We analyzed gal-4 expression in 25 sets of clinical colon tissue sections representing normal tissue, adenomas and locally invasive carcinomas by immunohistochemistry. Fig. 1(A-C) shows that gal-4 expression was uniformly high in superficial epithelial layer and epithelial cells lining the crypts just below the luminal side, which gradually decreased to minimal level in the epithelial cells of the immature crypts closer to muscularis mucosa. Under identical immunostaining conditions, crypts in the adenomas, characterized by dysplastic epithelia, fan-like elongations, protuberances and short-branchings, showed weak gal-4 expression. Normal tissue regions adjacent to adenomas were gal-4 positive and served as an internal positive control. On the other hand, the invasive carcinomas, showing characteristic irregular and severely distorted crypts, were essentially negative for gal-4 expression. Similar immunostaining pattern was observed in all of the biopsy sets representing the normal tissue, adenomas and invasive carcinomas. Finally, gal-4 was not detectable in the connective tissue surrounding the crypts or muscularis mucosa in any of these biopsies.
Figure 1. Immunohistochemistry of gal-4 expression in the human colorectal cancer sections encompassing.
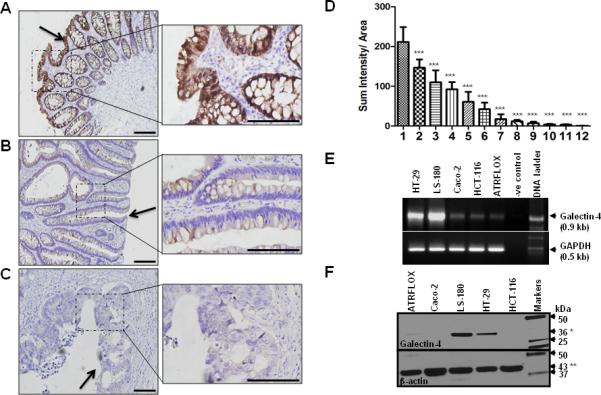
(A). Normal tissue; (B). Adenoma and (C). Invasive colorectal carcinoma. Gal-4 staining was visualized by DAB (brown). Magnification was 20x (left panel) and 60x (right panel). Scale bar represents 200 μm. A P value of <0.001 (***) was considered significant. Arrows here indicate the luminal side of the tissue. (D). Quantification of gal-4 staining in colon tissue microarrays representing: 1) normal tissue (n=82); 2) normal adjacent tissue to cancer (n=20); 3) chronic inflammation of colon (n=7); 4) adenoma (n=18); 5) villotubulous adenoma (n=46); 6) Crohn's disease (n=8); 7) mucinous adenocarcinoma (n=38); 8) adenocarcinoma (n=54); 9) metastatic mucinous adenocarcinoma (n=18); 10) signet-ring cell carcinoma (n=13); 11) metastatic adenocarcinoma (n=61); and 12) muscularis mucosa (n=24). Gal-4 DAB staining was quantitated as described under Materials and Methods. Results represent sum intensity per unity area ; bars represent SEM. Means of groups were compared using one-way ANOVA with Bonferroni's multiple comparison tests and significant differences were found when comparing gal-4 levels between normal and various disease-states (*** indicates P <0.001). (E). RT-PCR analysis. Three out of 50 μl reverse transcription reaction mixture obtained from 5 μg of total RNA isolated from each cell line was used as template in the PCR. Gal-4 cDNA was amplified using its specific primer set16. Glyceraldehyde-3-phosphate dehydrogenase (GAPDH) was amplified as an internal control. Equal volumes of these PCR mixtures were separated on 1% agarose gels containing ethidium bromide. (F). Western blot analysis. Total cell lysate (10 μg total protein each) from the indicated cells was separated on 4-20% acrylamide gradient SDS-PAGE gels followed by immunoblotting using anti-gal-4 antibody. 36 kDa gal-4 (*) and 43 kDa β-actin (**) were indicated with arrows. Standard protein markers were loaded in the far right lane.
To determine if there is any relationship between gal-4 loss and CRC progression, a quantitative analysis of gal-4 expression was carried out on tissue microarrays carrying a wide range of colonic disease states as indicated in Fig. 1D. The DAB staining (intensity per unit area) was quantified using NIH ImageJ software with deconvolution plugins. Fig. 1D shows a graphic compilation of these quantitative data, which showed a trend toward increased CRC severity with decreased gal-4 expression. Gal-4 expression was high in normal tissue, progressively decreased in adenomas (adenoma>villotubulous adenoma>mucinous adenocarcinoma) and negligible in metastatic carcinomas (metastatic mucinous adenocarcinoma>signet-ring cell carcinoma>metastatic adenocarcinoma). Interestingly, gal-4 expression was consistently low in inflammation-afflicted tissues (chronic inflammation of colon>Crohn's disease), a condition that predisposes to tumorigenesis 20.
CRC cell lines as key models for determining the function of gal-4
Because downregulation of gal-4 correlated with CRC progression from adenomas to invasive carcinomas, we next screened CRC cell lines that may serve as models to understand gal-4 function. The reverse transcription-polymerase chain reaction (RT-PCR) analysis on total RNAs isolated from LS-180, HT-29, HCT-116, ATRFLOX and Caco-2 showed that LS-180 and HT-29 cell lines expressed high amount of gal-4 when compared to other cell lines (Fig. 1E). DNA sequencing confirmed that the amplified DNA fragments were derived from gal-4 cDNA (data not shown). This analysis of gal-4 mRNA expression in CRC cell lines correlates well with the observations reported by Lahm et al.21. Western blot analysis showed high levels of gal-4 expression in LS-180 and HT-29 cells, which was minimal or undetectable in ATRFLOX, Caco-2 and HCT-116 cells (Fig. 1F), corroborating the above RT-PCR analysis. We thus chose cell lines that were gal-4 +ve and -ve to delineate the function of gal-4.
Isolation of gal-4-ve cells from HT-29 cells
To further establish the overexpression of gal-4 in LS-180 and HT-29 cells, we characterized gal-4 expression by immunocytochemistry. Fig. 2A shows that gal-4 was readily detectable in all of the LS-180 cells. Gal-4 immunostaining was negligible in HCT-116 cells, corroborating the above western blot analysis. On the other hand, gal-4 expression was not uniform in HT-29 cells. While majority of the cells were high gal-4 expressing, nearly 10% of the cells were gal-4 negative. Freshly obtained HT-29 cells from ATCC were also found to contain these two cell populations with similar proportions of gal-4 expressing cells. In fact, heterogeneity in HT-29 cells appear to be the case as other investigators made similar observations in HT-29 cells with respect to other proteins 22, 23. We thus colony purified the high and low gal-4 expressing cells from HT-29 cells and two isolates expressing extremely minimal level of gal-4 termed, HT-29-2 and HT-29-6G, and a homogenously high gal-4 expressing isolate (termed HT-29) were obtained. Gal-4 expression in these isolates was confirmed by western blotting (Fig. 2B) and immunocytochemistry (not shown). Although it is known that cell isolates tend to change their phenotypic characteristics, HT-29-2 and HT-29-6G isolates were essentially gal-4 – ve even after four months of continued maintenance in the laboratory. These cell lines were continually monitored for their homogeneity, before using in the following studies.
Figure 2. Characterization of gal-4 in CRC cells and isolation of low gal-4 expressing cells.
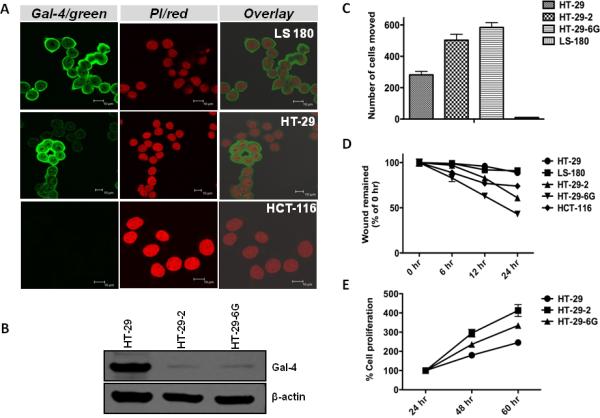
(A). Immunocytochemical analysis of gal-4 in CRC cell lines. Cells were immunostained with anti-gal-4 antibody and the AlexaFluor-488 coupled secondary antibody. AlexaFluor-488 (Gal-4/green) and propidium iodide (PI/red) fluorescence was digitally recorded using Leica Confocal laser microscope. The scale-bar in each of the image represents 10 μm. (B). Gal-4 expression in HT-29 isolates. HT-29, HT-29-2 and HT-29-6G cells were separated and analyzed by western blotting for gal-4 expression (upper panel) and β-actin (lower panel). (C). Cell motility assay. HT-29, HT-29-2, HT-29-6G and LS-180 cells were plated on Transwell chambers and after 24 h, cells that moved to the underside of the Transwell filter membrane were stained with hematoxylin and counted. (D). Wound healing assay. Cells were plated on six well plates and wound healing assay was performed as described under Materials and Methods. The average initial width of the entire scratch (0 h) was considered as 100%. The entire scratch width at different time points was measured and expressed as % 0 h. (E). Cell proliferation assay. Cells were subjected to MTS proliferation assay as described under Materials and Methods. Statistical analysis of the data presented in Panels C-E indicated a P value of <0.05, which was considered significant.
Gal-4 +ve cells displayed reduced cell motility
To gain insights into the function of gal-4, motility of LS-180, HT-29, HT-29-2 and HT-29-6G cells was measured by cell motiliy assay. Fig. 2C shows that gal-4 +ve LS-180 cells exhibited minimal motility when compared with HT-29 cells, which express slightly lower level of gal-4 (see Fig. 1F). The capacity of very low gal-4 expressing HT-29-2 and HT-29-6G cells to invade through membrane filter was even greater, with ~2-3 fold increase in the number of invading cells when compared to HT-29 cells.
Gal-4 +ve cells exhibited decreased cell migration and proliferation
Cell migration of CRC cells was measured by wound healing assay. Fig. 2D shows that very low gal-4-expressing HT-29-2 and HT-29-6G cells exhibited increased migration when compared to gal-4 +ve HT-29 and LS-180 cells. Gal-4 –ve HCT-116 cells exhibited similar increased cell migration as that of HT-29-6G cells. Further, an analysis of the doubling time of HT-29, HT-29-2 and HT-29-6G cells indicated that cells expressing gal-4 (HT-29) exhibited increased doubling time when compared to cells expressing very minimal gal-4 (HT-29-2 and HT-29-6G) (Fig. 2E).
Overexpression of gal-4 induced cell cycle arrest and reduced cell motility and migration
To further analyze the function of gal-4, ATRFLOX, HCT-116 and HT-29-2 cells were transfected with the gal-4 plasmid. Analysis of transfectants by western blotting showed the expression of ~36 kDa gal-4 (Fig. 3A). To determine the transfection efficiency, cells were transfected identically with pEGFP vector and the proportion of GFP fluorescent cells in total cells were counted using a fluorescence microscope. This analysis indicated that nearly 80% of the cells were GFP +ve (data not shown), suggesting similar level of transfection had occurred with the gal-4 plasmid. This high transfection efficiency allowed us in establishing the functional role of gal-4. An analysis of cell division cycle of ATRFLOX and HT-29-2 cells overexpressing gal-4 showed that these cells were arrested at G2/M phase when compared to vector transfected cells (Fig. 3B). On the other hand, HCT-116 cells were arrested at both S and G2/M phases with gal-4 expression.
Figure 3. Effects of gal-4 expression.
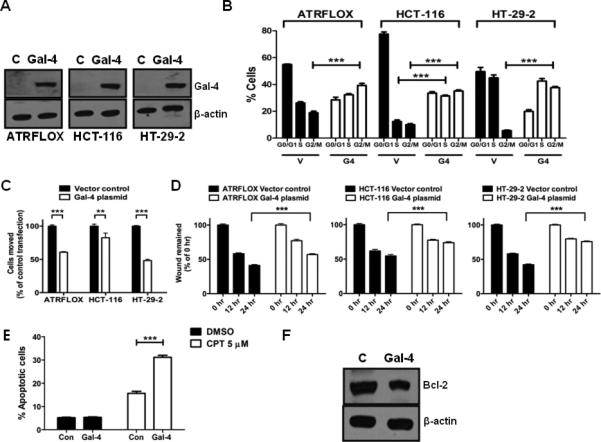
(A). Gal-4 transient transfection in ATRFLOX, HCT-116 and HT-29-2 cells. Cells were transiently transfected with either the gal-4 plasmid or the vector. Cell lysates (10 μg each) prepared after 24 h were analyzed for gal-4 and β-actin. (B). Cell cycle analysis. The above transiently transfected cells were also subjected to cell cycle analysis as described under Materials and Methods. The G1, G2/M and S phase distribution of cells was determined by FlowJo software. *** indicates P <0.001. (C). Cell motility assay. The above transiently transfected cells were used in motility assay as described under Materials and Methods. A P value of <0.001 was considered significant. ** indicates P <0.01 and *** indicates P <0.001. (D). Wound healing assay. The above transiently transfected cells were used in migration assay as described under Materials and Methods. A P value of <0.001 was considered significant. *** indicates P <0.001. (E). Effect of gal-4 on CPT induced apoptosis. HCT-116 cells transfected with either the vector plasmid or the gal-4 plasmid for 48 h and were subjected to apoptosis in the presence of either DMSO (vehicle control) or CPT (5 μM) for 4 h. *** indicates P <0.001. (F). Effect of gal-4 on Bcl-2 expression. HCT-116 cells were transiently transfected with either the vector plasmid or the gal-4 plasmid and the expression of Bcl-2 was analyzed by western blotting after 48 h. β-actin was used as loading control.
The effects of gal-4 on cell motility and migration were also determined. Upon expression of gal-4, there was a significant decrease in the number of ATRFLOX, HCT-116 and HT-29-2 cells invading through the membrane filter, when compared to control (Fig. 3C). Similarly, there was a significant decrease in wound healing in all of these cell lines subsequent to gal-4 expression (Fig. 3D).
To determine if gal-4 expression-induced cell cycle arrest leads to apoptosis, flow cytometric analysis was carried out subsequent to Annexin V-FITC labeling. This analysis indicated that cells (ATRFLOX, HCT-116 and HT-29-2) transfected with vector plasmid contained 8.98%, 5.17% and 5.82% apoptotic cells, whereas, cells transfected with gal-4 plasmid contained 7.10%, 5.32% and 5.45% apoptotic cells, respectively (data not shown). These results suggested that gal-4 expression does not lead to induction of apoptosis in these cells. To determine if gal-4 expression makes the cells responsive to apoptosis, HCT-116 cells transfected with gal-4 plasmid were treated with CPT and analyzed for apoptosis by flow cytometry. Fig. 3E shows that there was a significant increase in apoptotic cell population in cells expressing gal-4 upon treatment with CPT, when compared to vector controls. To determine the mechanism of increased sensitization to CPT-induced apoptosis, cells were analyzed by western blotting for Bcl-2, an anti-apoptotic protein that was over-expressed in CRC cells 24. Fig. 3F shows a decrease in Bcl-2 level with gal-4 plasmid transfection, providing an explanation for increased sensitization to apoptosis.
RNAi-mediated gal-4 knockdown led to increased cell proliferation and migration
To further establish that the above observations are related to the gal-4 function, gal-4 expression was silenced in gal-4-expressing cells and the functional consequences were analyzed. Initial experiments using all the Stealth RNAi's mentioned in the Materials and Methods in HT-29 cells identified RNAi3 as effective in reducing the gal-4 level to near 80% in 24 h (Fig. 4A). This reduction in gal-4 expression was persistent for next few days, allowing in the characterization of cell proliferation and migration of these gal-4 knockdown cells. Fig. 4B shows that RNAi3 transfected cells exhibited statistically significant increase in cell proliferation when compared to scrambled RNAi controls. Although, gal-4 knockdown was maximally observed at initial time points, there was a delayed response in cell proliferation, which could be due to delayed adjustment of cellular pathways that are controlled by gal-4. Finally, knockdown of gal-4 resulted in increased wound healing, when compared to control (Fig. 4C).
Figure 4. Effects of Gal-4 knockdown.
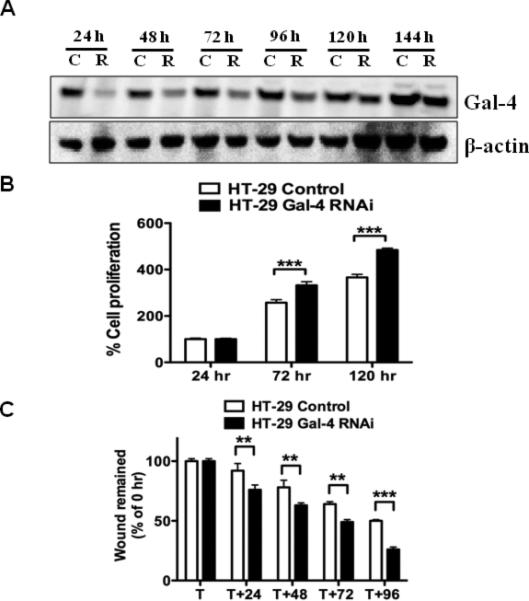
(A). Effect of gal-4 RNAi on gal-4 expression in HT-29 cells. Whole cell extracts of HT-29 cells transfected either with gal-4 RNAi3 (R) or Stealth RNAi negative control (C) were subjected to immunoblotting for gal-4 expression. (B). Cell proliferation assay. HT-29 cells were transfected either with gal-4 RNAi3 or Stealth RNAi negative control for 24 h and were subjected to MTS assay as described in the methods section. A P value <0.001 (***) was considered significant. (C). Wound healing assay. HT-29 cells were transfected either with gal-4 RNAi3 or Stealth RNAi negative control and were subjected to wound healing assay as described in the Methods section. T is the time point at which the scratch was introduced and the average initial wound width was measured and considered 100%. ** indicates P <0.01 and *** indicates P <0.001.
Mechanism of gal-4
To elucidate the mechanism by which gal-4 regulated the above cellular processes, we analyzed cells after overexpression of gal-4, knockdown of gal-4 as well as the gal-4 immunoprecipitates. Western blot analysis showed that overexpression of gal-4 resulted in a decrease in cyclin D1 level and an increase in p21 and p15 levels in three different cell lines, namely, HCT-116, ATRFLOX and HT-29-2 cells (Fig. 5A). Western blot analysis of cells transfected with RNAi3 for 96 h showed a significant reduction in p15 and phosphorylated p53. A significant increase in the amount of β-catenin was observed in cells transfected with RNAi3.
Figure 5. Gal-4 mechanism.
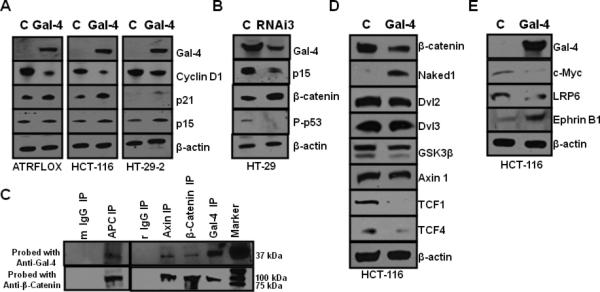
(A). Effect of gal-4 transient transfection in ATRFLOX, HCT-116 and HT-29-2 cells. Cells were transiently transfected with either gal-4 plasmid (Gal-4) or vector plasmid (C). Cell lysates (10 μg each) prepared after 24 h were analyzed for expression of gal-4, cyclin D1, p21, p15 and β-actin. (B). Effect of gal-4 RNAi3 transfection in HT-29 cells. HT-29 cells were transfected either with gal-4 RNAi3 (RNAi3) or Stealth RNAi negative control (C) using electroporation and cell lysates at 96 hrs were analyzed for the expression of gal-4, p15, β-catenin, Phospho-p53 and β-actin. (C). Immunoprecipitation of gal-4 with Wnt signaling proteins. Antibodies against gal-4 (rabbit), β-catenin (rabbit), axin (rabbit) and APC (mouse), mouse IgG (m) and rabbit IgG (r) (controls) were used in the immunoprecipitation from HT-29 cell lysates. The IP's were probed with anti-mouse-gal-4 and anti-mouse-β-catenin antibodies. Prominent bands observed were 37 kDa gal-4 band and 92 kDa β-Catenin band. All the IPs could pull down both gal-4 and β-catenin. (D). Gal-4 effect on Wnt signaling pathway. HCT-116 cells transfected either with gal-4 plasmid (Gal-4) or vector plasmid (C) and cell lysates at 48 h were analyzed for β-catenin, Naked 1, Dvl2, Dvl3, GSK-3β, axin1, TCF1, TCF4 and β-actin. (E). Gal-4 effect on Wnt target genes. HCT-116 cells transfected either with gal-4 plasmid (Gal-4) or vector plasmid (C) for 48 h and cell lysates were analyzed for the expression of gal-4, c-Myc, LRP6, Ephrin B1 and β-actin.
To further analyze the relationship between gal-4 a n d β-catenin, immunoprecipitates were prepared using antibodies against β-catenin, APC, axin and gal-4 and analyzed for the presence of gal-4 and β-catenin by western blotting. Fig. 5C shows that all of the immunoprecipitates contained their respective proteins, as expected. Importantly, antibodies against β-catenin, APC and axin co-immunoprecipitated gal-4 and, gal-4 antibody pulled-down β-catenin. These data suggested the existence of protein-protein interactions between gal-4 and APC, axin and β-catenin, which are the key components of the Wnt signaling destruction complex.
Gal-4 inhibited Wnt signaling
Gal-4 was over-expressed in HCT-116 cells to determine the role of gal-4 in Wnt signaling. Fig. 5D shows that there was a significant decrease in β-catenin level upon gal-4 expression. Importantly, gal-4 expression led to an increase in Naked 1. Naked 1 was implicated to antagonize the Wnt signaling pathway through its ability to bind and destabilize Dsh/Dvl proteins25. However, there was a slight reduction in the levels of Dvl2, Dvl3 and GSK-3β, without any change in axin 1 level. There was a significant reduction in TCF4 upon expression of gal-4. Importantly, the level of TCF1, a target gene for TCF4, was decreased dramatically in the presence of gal-4 26.
Gal-4 decreased the expression of Wnt target genes
Overexpression of proteins such as cyclin D1, c-Myc, LRP6 and down-regulation of Ephrin B1 has been implicated in colon carcinogenesis and are well-known Wnt signaling targets27. To investigate if gal-4 expression results in the modulation in the levels of these genes, gal-4 was expressed in HCT-116 cells and analyzed. Fig. 5E shows that upon gal-4 expression, there was a significant decrease in c-Myc, LRP6 and cyclin D1 levels, and an increase in Ephrin B1 level.
Gal-4 and β-catenin were inversely expressed in normal and adenocarcinoma tissues
The above in vitro studies that gal-4 expression led to a decrease in β-catenin and, gal-4 knockdown resulted in an increased β-catenin expression, prompted us to further analyze this relationship in situ using human biopsies. Fig. 6 shows the immunohistochemistry of β-catenin in both normal colon mucosa and adenocarcinoma. β-Catenin expression was high in epithelial cells of crypts localized in the adenocarcinomas, when compared to the corresponding cells in the normal tissues. As shown in Fig. 1, gal-4 expression was greatly diminished in crypt epithelial cells in the adenocarcinoma when compared to that in normal mucosa.
Figure 6. Expression analysis of β-catenin in normal and adenocarcinoma sections.
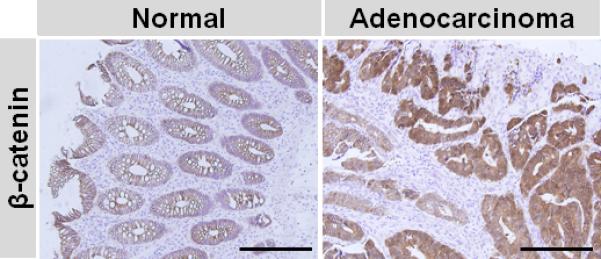
Immunohistochemistry was carried out on human colon normal and adenocarcinoma sections and β-catenin staining was visualized by DAB (brown). Magnification was 20x and the scale bar represents 500 μm.
DISCUSSION
Development of CRC follows the normal-adenoma-carcinoma sequence28, 29. This model suggests that adenomas develop from the normal colonic epithelial cells, which become progressively dysplastic resulting in carcinoma foci30, 31. These transitions occur through multistep carcinogenic processes in which genetic and epigenetic alterations accumulate in a sequential manner. Multiple studies have identified mutations in the well-characterized APC, K-Ras, p53, ß-catenin, axin, EGFR, as well as uncharacterized genes whose function is yet to be established in predisposition to the majority of CRC 3. Although gal-4 mRNA is highly restricted to the gastrointestinal tract6, 7, its translation and function in colonic epithelia or consequences of its loss of expression in CRC remains unknown. Our immunohistochemical analyses clearly indicated that gal-4 was highly expressed in the epithelial lining of the normal human colon crypts, which was greatly reduced in adenomas and, nearly absent in invasive carcinomas. The data presented in Fig.1 that progressive loss of gal-4 from normal epithelia to the development of invasive carcinoma bears a direct correlation to the above paradigm and predicts that loss of gal-4 is one of the important contributing factors in the onset and progression of CRC.
Gal-4 level was decreased in colon tissues with chronic inflammation and Crohn's disease. Since inflammation is a pre-disposing condition that may lead to neoplasia, gal-4 loss may play a role in inflammation as well. Because normal epithelia are differentiated, gal-4 has been hitherto used principally as a marker of epithelial cell differentiation14, 15. A predictive analysis by Hufflet and Leffler11 has suggested that the gal-4 promoter region harbors binding sites for a number of transcription factors associated with epithelial differentiation. In fact, immunohistochemistry of the normal colonic sections clearly indicated that gal-4 expression greatly increases as the crypts near the muscularis mucosa mature and migrate toward the luminal surface, supporting the view that gal-4 expression is an indicator of differentiation. Interestingly, forced expression of gal-4 resulting in the up-regulation of Ephrin B1 (Fig. 5E), a differentiation marker, further supports this view. It is unknown what would happen if gal-4 expression were lost in the differentiated cells. Would loss of gal-4 lead epithelial cells to de-differentiate allowing them to proliferative similar to the behavior of cancer? From the comparison of cell proliferation, migration and motility in cells expressing different levels of endogenous gal-4; in cells with forced expression and knockdown of gal-4, a conclusion that gal-4 downregulates cell proliferation and its loss leads to cell proliferation is emerged.
Cyclin D1 is overly expressed as an early event in CRC, and its inhibition causes growth-arrest in CRC cell lines32. In addition, tumor suppressor proteins p15 and p21 are down-regulated during colorectal carcinogenesis33, 34. Importantly, it has been shown that down-regulation of cyclin D1 and up-regulation of p21 lead to cell cycle arrest at either G1/S or G2/M phase35. Interestingly, the data that gal-4-induced down-regulation of cyclin D1 level and up-regulation of p21 and p15 explain the mechanism of cell cycle arrest induced in cells over-expressing gal-4. From these analyses, gal-4 appears to maintain normal colonic epithelial cells in a non-proliferative state by regulating the levels of these cell cycle proteins, mimicking the function of a tumor suppressor protein. As mentioned in the Introduction, the normal colonic luminal epithelia continually undergo apoptosis. In contrast, CRC cells are known to be resistant to apoptosis. While the mechanisms underlying the cause for these phenomena are unknown, gal-4 appears to be a key player in normal epithelial cells to their sensitivity to undergo apoptosis, which is evident by increased sensitivity to CPT-induced apoptosis.
Wnt signaling pathway is essential in different biological processes such as cell fate specification, cell migration and polarity (reviewed in36) and dysregulation of this pathway is a hallmark of CRC 37. Briefly, in the absence of a Wnt signal, β-catenin is maintained at low steady state level by ubiquitination-degradation, which is mediated by a multiprotein destruction complex consisting of APC, axin, CK-1 and GSK-3β. On the other hand, binding of Wnt to the cell surface Frizzled receptor results in the destabilization of the destruction complex with the release of GSK-3β from the complex, resulting in an increased accumulation of β-catenin and its translocation to the nucleus, where it functions as a cofactor for TCF/LEF (T-cell factor/lymphoid-enhancing factor) and initiates transcription of its target genes like c-Myc, cyclin D1, LRP6 and Ephrin B1. Our data that gal-4 interacts with APC, axin and ß-catenin, suggested that gal-4 is a component of the Wnt signaling destruction complex. Forced expression of gal-4 resulted in an increased Naked 1, Ephrin B1 levels and decreased the levels of ß-catenin, Dvl2, TCF1, TCF4, c-Myc, LRP6 and cyclin D1, which together suggested that gal-4 plays an important role in regulating the Wnt signaling pathway.
Finally, we gathered expression data from published microarray studies available at Public Gene Expression Data Repositories (Omnibus database, GEO profiles, http://www.ncbi.nlm.nih.gov/sites/entrez) at the National Center of Biotechnology Information (NCBI, National Health Institute, USA). Searching this database for gal-4 expression in colorectal cancer tissues, we identified records that highlighted the role of gal-4 in the early onset of CRC and its relapse. Record GDS2609 indicated that gal-4 expression is down-regulated in patients with early onset of CRC compared to healthy controls. On the other hand, Record GDS1263 indicated that patients with tumors expressing gal-4 mRNA did not show any tumor relapse when compared to patients with gal-4 negative tumors. These meta-analyses raise a distinct possibility that gal-4 plays a key role in preventing tumor relapse.
In conclusion, our data provides the first evidence that gal-4 functions as a tumor suppressor and its loss is an important event in CRC tumorigenesis. These findings thus provide a novel framework for further investigation into the regulation of gal-4 expression and its function in vivo.
Acknowledgments
Supported by funds from NIH grant, RO1 CA106625, to U.S. Rao.
Abbreviations
- CPT
camptothecin
- CRC
colorectal cancer
- DAB, 3
3'-diaminobenzidine
- FITC
Fluorescein isothiocyanate
- Gal-4
galectin-4
- GFP
Green fluorescent protein
- PCR
Polymerase chain reaction
- RT-PCR
Reverse transcriptase-PCR
- RNAi
RNA interference
Footnotes
Novelty and Impact
In spite of recent advances, colorectal cancer (CRC) remains one of the leading causes of cancer-related deaths worldwide. Here we show galectin-4 (gal-4) expression, a protein restricted to the GI tract, is greatly diminished during CRC progression. In addition, we unraveled the function of gal-4 in CRC, by showing its ability to suppress proliferation, migration, motility and sensitize cells to apoptosis, indicating a tumor suppressor role in CRC. To our knowledge, this is the first study that reports the tumor suppressive effects of gal-4 in colorectal cancer. Thus, a therapy that reactivates gal-4 expression could provide means to treat CRC patients.
References
- 1.Kosinski C, Li VS, Chan AS, Zhang J, Ho C, Tsui WY, Chan TL, Mifflin RC, Powell DW, Yuen ST, Leung SY, Chen X. Gene expression patterns of human colon tops and basal crypts and BMP antagonists as intestinal stem cell niche factors. Proc Natl Acad Sci U S A. 2007;104:15418–23. doi: 10.1073/pnas.0707210104. [DOI] [PMC free article] [PubMed] [Google Scholar]
- 2.Jass JR. Colorectal cancer: a multipathway disease. Crit Rev Oncog. 2006;12:273–87. doi: 10.1615/critrevoncog.v12.i3-4.50. [DOI] [PubMed] [Google Scholar]
- 3.Rustgi AK. The genetics of hereditary colon cancer. Genes Dev. 2007;21:2525–38. doi: 10.1101/gad.1593107. [DOI] [PubMed] [Google Scholar]
- 4.Danguy A, Camby I, Kiss R. Galectins and cancer. Biochim Biophys Acta. 2002;1572:285–93. doi: 10.1016/s0304-4165(02)00315-x. [DOI] [PubMed] [Google Scholar]
- 5.Liu FT. Regulatory roles of galectins in the immune response. Int Arch Allergy Immunol. 2005;136:385–400. doi: 10.1159/000084545. [DOI] [PubMed] [Google Scholar]
- 6.Wasano K, Hirakawa Y. Rat intestinal galactoside-binding lectin L-36 functions as a structural protein in the superficial squamous cells of the esophageal epithelium. Cell Tissue Res. 1995;281:77–83. doi: 10.1007/BF00307960. [DOI] [PubMed] [Google Scholar]
- 7.Wooters MA, Hildreth MB, Nelson EA, Erickson AK. Immunohistochemical characterization of the distribution of galectin-4 in porcine small intestine. J Histochem Cytochem. 2005;53:197–205. doi: 10.1369/jhc.4A6439.2005. [DOI] [PubMed] [Google Scholar]
- 8.Kondoh N, Wakatsuki T, Ryo A, Hada A, Aihara T, Horiuchi S, Goseki N, Matsubara O, Takenaka K, Shichita M, Tanaka K, Shuda M, et al. Identification and characterization of genes associated with human hepatocellular carcinogenesis. Cancer Res. 1999;59:4990–6. [PubMed] [Google Scholar]
- 9.Hippo Y, Yashiro M, Ishii M, Taniguchi H, Tsutsumi S, Hirakawa K, Kodama T, Aburatani H. Differential gene expression profiles of scirrhous gastric cancer cells with high metastatic potential to peritoneum or lymph nodes. Cancer Res. 2001;61:889–95. [PubMed] [Google Scholar]
- 10.Tripodi D, Quemener S, Renaudin K, Ferron C, Malard O, Guisle-Marsollier I, Sebille-Rivain V, Verger C, Geraut C, Gratas-Rabbia-Re C. Gene expression profiling in sinonasal adenocarcinoma. BMC Med Genomics. 2009;2:65. doi: 10.1186/1755-8794-2-65. [DOI] [PMC free article] [PubMed] [Google Scholar]
- 11.Huflejt ME, Leffler H. Galectin-4 in normal tissues and cancer. Glycoconj J. 2004;20:247–55. doi: 10.1023/B:GLYC.0000025819.54723.a0. [DOI] [PubMed] [Google Scholar]
- 12.Kim K, Park U, Wang J, Lee J, Park S, Kim S, Choi D, Kim C, Park J. Gene profiling of colonic serrated adenomas by using oligonucleotide microarray. Int J Colorectal Dis. 2008;23:569–80. doi: 10.1007/s00384-008-0451-y. [DOI] [PubMed] [Google Scholar]
- 13.Lee S, Bang S, Song K, Lee I. Differential expression in normal-adenoma-carcinoma sequence suggests complex molecular carcinogenesis in colon. Oncol Rep. 2006;16:747–54. [PubMed] [Google Scholar]
- 14.Rechreche H, Mallo GV, Montalto G, Dagorn JC, Iovanna JL. Cloning and expression of the mRNA of human galectin-4, an S-type lectin down-regulated in colorectal cancer. Eur J Biochem. 1997;248:225–30. doi: 10.1111/j.1432-1033.1997.00225.x. [DOI] [PubMed] [Google Scholar]
- 15.van de Wetering M, Sancho E, Verweij C, de Lau W, Oving I, Hurlstone A, van der Horn K, Batlle E, Coudreuse D, Haramis AP, Tjon-Pon-Fong M, Moerer P, et al. The beta-catenin/TCF-4 complex imposes a crypt progenitor phenotype on colorectal cancer cells. Cell. 2002;111:241–50. doi: 10.1016/s0092-8674(02)01014-0. [DOI] [PubMed] [Google Scholar]
- 16.Satelli A, Rao PS, Gupta PK, Lockman PR, Srivenugopal KS, Rao US. Varied expression and localization of multiple galectins in different cancer cell lines. Oncol Rep. 2008;19:587–94. [PubMed] [Google Scholar]
- 17.Ruifrok AC, Johnston DA. Quantification of histochemical staining by color deconvolution. Anal Quant Cytol Histol. 2001;23:291–9. [PubMed] [Google Scholar]
- 18.Rao PS, Satelli A, Zhang S, Srivastava SK, Srivenugopal KS, Rao US. RNF2 is the target for phosphorylation by the p38 MAPK and ERK signaling pathways. Proteomics. 2009;9:2776–87. doi: 10.1002/pmic.200800847. [DOI] [PMC free article] [PubMed] [Google Scholar]
- 19.Kuuselo R, Savinainen K, Azorsa DO, Basu GD, Karhu R, Tuzmen S, Mousses S, Kallioniemi A. Intersex-like (IXL) is a cell survival regulator in pancreatic cancer with 19q13 amplification. Cancer Res. 2007;67:1943–9. doi: 10.1158/0008-5472.CAN-06-3387. [DOI] [PubMed] [Google Scholar]
- 20.Coussens LM, Werb Z. Inflammation and cancer. Nature. 2002;420:860–7. doi: 10.1038/nature01322. [DOI] [PMC free article] [PubMed] [Google Scholar]
- 21.Lahm H, Andre S, Hoeflich A, Fischer JR, Sordat B, Kaltner H, Wolf E, Gabius HJ. Comprehensive galectin fingerprinting in a panel of 61 human tumor cell lines by RT-PCR and its implications for diagnostic and therapeutic procedures. J Cancer Res Clin Oncol. 2001;127:375–86. doi: 10.1007/s004320000207. [DOI] [PMC free article] [PubMed] [Google Scholar]
- 22.Vermeulen L, De Sousa EMF, van der Heijden M, Cameron K, de Jong JH, Borovski T, Tuynman JB, Todaro M, Merz C, Rodermond H, Sprick MR, Kemper K, et al. Wnt activity defines colon cancer stem cells and is regulated by the microenvironment. Nat Cell Biol. 2010;12:468–76. doi: 10.1038/ncb2048. [DOI] [PubMed] [Google Scholar]
- 23.Yeung TM, Gandhi SC, Wilding JL, Muschel R, Bodmer WF. Cancer stem cells from colorectal cancer-derived cell lines. Proc Natl Acad Sci U S A. 2010;107:3722–7. doi: 10.1073/pnas.0915135107. [DOI] [PMC free article] [PubMed] [Google Scholar]
- 24.Bedi A, Pasricha PJ, Akhtar AJ, Barber JP, Bedi GC, Giardiello FM, Zehnbauer BA, Hamilton SR, Jones RJ. Inhibition of apoptosis during development of colorectal cancer. Cancer Res. 1995;55:1811–6. [PubMed] [Google Scholar]
- 25.Guo J, Cagatay T, Zhou G, Chan CC, Blythe S, Suyama K, Zheng L, Pan K, Qian C, Hamelin R, Thibodeau SN, Klein PS, et al. Mutations in the human naked cuticle homolog NKD1 found in colorectal cancer alter Wnt/Dvl/beta-catenin signaling. PLoS One. 2009;4:e7982. doi: 10.1371/journal.pone.0007982. [DOI] [PMC free article] [PubMed] [Google Scholar]
- 26.Roose J, Huls G, van Beest M, Moerer P, van der Horn K, Goldschmeding R, Logtenberg T, Clevers H. Synergy between tumor suppressor APC and the beta-catenin-Tcf4 target Tcf1. Science. 1999;285:1923–6. doi: 10.1126/science.285.5435.1923. [DOI] [PubMed] [Google Scholar]
- 27.Batlle E, Henderson JT, Beghtel H, van den Born MM, Sancho E, Huls G, Meeldijk J, Robertson J, van de Wetering M, Pawson T, Clevers H. Beta-catenin and TCF mediate cell positioning in the intestinal epithelium by controlling the expression of EphB/ephrinB. Cell. 2002;111:251–63. doi: 10.1016/s0092-8674(02)01015-2. [DOI] [PubMed] [Google Scholar]
- 28.Cho KR, Vogelstein B. Suppressor gene alterations in the colorectal adenoma-carcinoma sequence. J Cell Biochem Suppl. 1992;16G:137–41. doi: 10.1002/jcb.240501124. [DOI] [PubMed] [Google Scholar]
- 29.Morson B. President's address. The polyp-cancer sequence in the large bowel. Proc R Soc Med. 1974;67:451–7. doi: 10.1177/00359157740676P115. [DOI] [PMC free article] [PubMed] [Google Scholar]
- 30.Beerenwinkel N, Antal T, Dingli D, Traulsen A, Kinzler KW, Velculescu VE, Vogelstein B, Nowak MA. Genetic progression and the waiting time to cancer. PLoS Comput Biol. 2007;3:e225. doi: 10.1371/journal.pcbi.0030225. [DOI] [PMC free article] [PubMed] [Google Scholar]
- 31.Fearon ER, Vogelstein B. A genetic model for colorectal tumorigenesis. Cell. 1990;61:759–67. doi: 10.1016/0092-8674(90)90186-i. [DOI] [PubMed] [Google Scholar]
- 32.Arber N, Doki Y, Han EK, Sgambato A, Zhou P, Kim NH, Delohery T, Klein MG, Holt PR, Weinstein IB. Antisense to cyclin D1 inhibits the growth and tumorigenicity of human colon cancer cells. Cancer Res. 1997;57:1569–74. [PubMed] [Google Scholar]
- 33.Ishiguro A, Takahata T, Saito M, Yoshiya G, Tamura Y, Sasaki M, Munakata A. Influence of methylated p15 and p16 genes on clinicopathological features in colorectal cancer. J Gastroenterol Hepatol. 2006;21:1334–9. doi: 10.1111/j.1440-1746.2006.04137.x. [DOI] [PubMed] [Google Scholar]
- 34.Guda K, Giardina C, Nambiar P, Cui H, Rosenberg DW. Aberrant transforming growth factor-beta signaling in azoxymethane-induced mouse colon tumors. Mol Carcinog. 2001;31:204–13. doi: 10.1002/mc.1055. [DOI] [PubMed] [Google Scholar]
- 35.Lin HM, Moon BK, Yu F, Kim HR. Galectin-3 mediates genistein-induced G(2)/M arrest and inhibits apoptosis. Carcinogenesis. 2000;21:1941–5. doi: 10.1093/carcin/21.11.1941. [DOI] [PubMed] [Google Scholar]
- 36.Cadigan KM, Nusse R. Wnt signaling: a common theme in animal development. Genes Dev. 1997;11:3286–305. doi: 10.1101/gad.11.24.3286. [DOI] [PubMed] [Google Scholar]
- 37.Moon RT, Kohn AD, De Ferrari GV, Kaykas A. WNT and beta-catenin signalling: diseases and therapies. Nat Rev Genet. 2004;5:691–701. doi: 10.1038/nrg1427. [DOI] [PubMed] [Google Scholar]