

Abstract
A barrier phases nucleosomes at the yeast (S. cerevisiae) GAL1/10 genes. Here we separate nucleosome positioning from occupancy, and show that the degree of occupancy of these phased sites is predictably determined by the underlying DNA sequences. As this occupancy is increased (by sequence alteration) nucleosome removal upon induction is decreased, as is mRNA production. These results explain why promoter sequences have evolved to form nucleosomes relatively inefficiently.
The UASg, the yeast regulatory locus that bears binding sites for the activator Gal4, also bears binding sites for the protein RSC1. A RSC/partially-unwound nucleosome complex constitutively covers the UASg and presents Gal4 binding sites for ready access by the activator. By virtue of its tight positioning, the complex also comprises a barrier to what would otherwise be encroaching nucleosomes and, as a result, nucleosomes flanking the UASg are unusually tightly positioned, or phased. This positioning is effected in different sequence contexts1. Here we contrast nucleosome positioning (i.e. the location of the phased sites adjacent to the UASg, essentially the same in every member of the population), with occupancy of each of the phased sites (i.e. the fraction of the population of each of these sites that is occupied by a nucleosome at any given instant). We find that occupancy is increased in a predictable fashion as the underlying DNA sequence is changed. As occupancy is increased, nucleosome removal upon induction is decreased, as is mRNA production.
The disposition of nucleosomes in and around the UASg, prior to and following induction, at the GAL1/10 genes is shown in Figure 1a. A RSC/partially unwound nucleosome complex at the UASg (cyan oval) spans only some 130 bp (see Floer et al.1 and below), whereas each of the other nucleosomes, depicted as a green oval, extends over the canonical length of 150 bp. The height of each peak indicates the fraction of the population, at that site, that is protected from micrococcal nuclease (MNase) digestion. Whereas the UASg is occupied by the RSC/partially unwound nucleosome complex in essentially every member of the population (100% occupancy), each of the adjacent phased sites is fully protected on only some 35–45% of the templates at any given instant. Despite this weak formation, removal of these promoter nucleosomes is required for rapid induction2. When the UASg was inserted into an ORF, the flanking nucleosomes became phased, but in this case the phased nucleosomes were found on 60–70% of the templates at any given instant1. Thus nucleosome phasing occurred in two different sequence contexts (and thus was attributed to a barrier effect of the complex on the UASg), but occupancy of the phased sites evidently depended upon the sequences flanking the UASg. Here we explore further the effect on DNA sequence on occupancy of the phased sites.
Figure 1. Chromatin architecture at the GAL1/10 locus prior to and following induction.
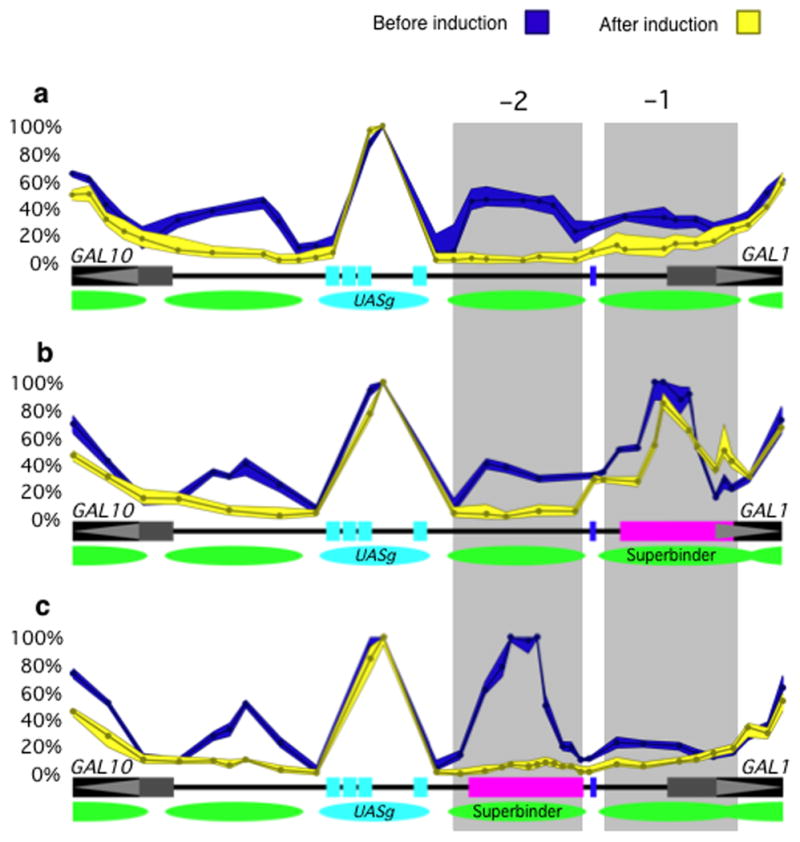
(a) The wild type locus. The distribution of nucleosomes prior to induction, as well as the fractional occupancy of each implied site, is shown in blue. The corresponding values following induction are shown in yellow. The data was obtained using the assay of Bryant et al.2. The UASg bears four Gal4 binding sites shown in cyan, and the RSC/nucleosome complex is indicated by a cyan oval. Nucleosomes flanking the UASg are shown as green ovals. The shaded areas −1 and −2 indicate the sites of positioned (phased) nucleosomes in the GAL1 promoter. The 5′ ends of the GAL1 and GAL10 genes are shown as horizontal black bars, and the GAL1 TATA box by the small vertical blue bar that lies between sites −1 and −2. The distribution shown in blue is unchanged by addition or deletion of the activator Gal4, but nucleosome removal as shown in yellow requires Gal4 and the inducer galactose (2% in this case, added to cells growing in raffinose). The envelopes encompassing the curves indicate the range of experimental error, calculated as described in Bryant et al.2. (b) As in (a) except that the “superbinder” sequence of Supplementary Table 1 has been substituted for the wild type sequence at site −1 as indicated by the horizontal magenta bar. (c) As in (a) except that the superbinder sequence has been substituted for the wild type sequence at site −2.
Our conclusions require that our assay accurately measure fractional occupancies of DNA sites by nucleosomes. The percentage occupancies shown in Figure 1a were generated by first digesting crosslinked chromatin over a wide range of MNase concentrations2. We then measured (using QPCR), for each of many 60 bp fragments (amplicons), the fraction remaining uncut at each nuclease concentration. Each digestion curve (for most cases) was biphasic, indicating the presence of both naked and protected DNA. The digestions rates were sufficiently different so that, from the inflection points of the curves, we could determine the fraction protected2. By noting inflection points rather than absolute values of digestion rates, we avoid artifacts that otherwise arise from effects of DNA sequence on inherent MNase sensitivities3,4. By analyzing a tiled array of such curves (and thus making no priori assumptions as to the length of any protected region) we derived a map that (as confirmed by further experiments) shows the positioning and occupancy of nucleosomes in and around the UASg. For a more detailed discussion of the assay see Bryant et al.2 as well as Floer et al.1, which describes further experiments confirming the picture presented in Figure 1a.
The rules describing how sequences differences might influence nucleosome-forming propensities have long been the subject of debate5-9. Many years ago it was proposed that a DNA segment comprising AA/TT/TA dinucleotides alternating at 5 bp intervals with GC dinucleotides would form nucleosomes particularly efficiently5,10. We therefore substituted at site −1 an artificial sequence, a so-called “superbinder”, designed to fit this criterion. This specific 133bp sequence, shown in Supplementary Table 1, was kindly provided to us by E. Segal and J. Widom. We found that, according to our assay, the nucleosome occupancy of this artificial site was essentially that observed at the UASg, i.e. 100% (Fig. 1b). The same degree of occupancy was observed for site −2 when the superbinder sequence was introduced there (Fig. 1c). A ChIP assay for FLAG-tagged H2B, performed with cells bearing the construct of Figure 1b or 1c, confirmed the presence of that histone at each of these sites (Supplementary Fig. 1). These findings also confirm, for an extreme case at least, that our assay can measure differences in nucleosome occupancies determined by different DNA sequences at a specific site.
To systematically explore the relation between DNA sequence at site −1 and nucleosome occupancy, we substituted for site −1 six different 133 bp DNA sequences, including the superbinder sequence, designed to form nucleosomes with ever increasing efficiencies (Fig. 2a). We morphed, stepwise, the wild type (weak) sequence found at site −1 into the “superbinder” sequence, so that each successive sequence bears an increased number of ideally placed dinucleotide elements as shown in Figure 2a. Each successive sequence, from top to bottom, is expected to form a nucleosome more efficiently than its predecessor according to the various models of Travers and Klug10, Kaplan et al.11, Tillo et al.9 and Takasuka et al.12. The complete sequences are shown in Supplementary Table 1.
Figure 2. The effects of increasing nucleosome-forming propensities on nucleosome occupancies at site −1.
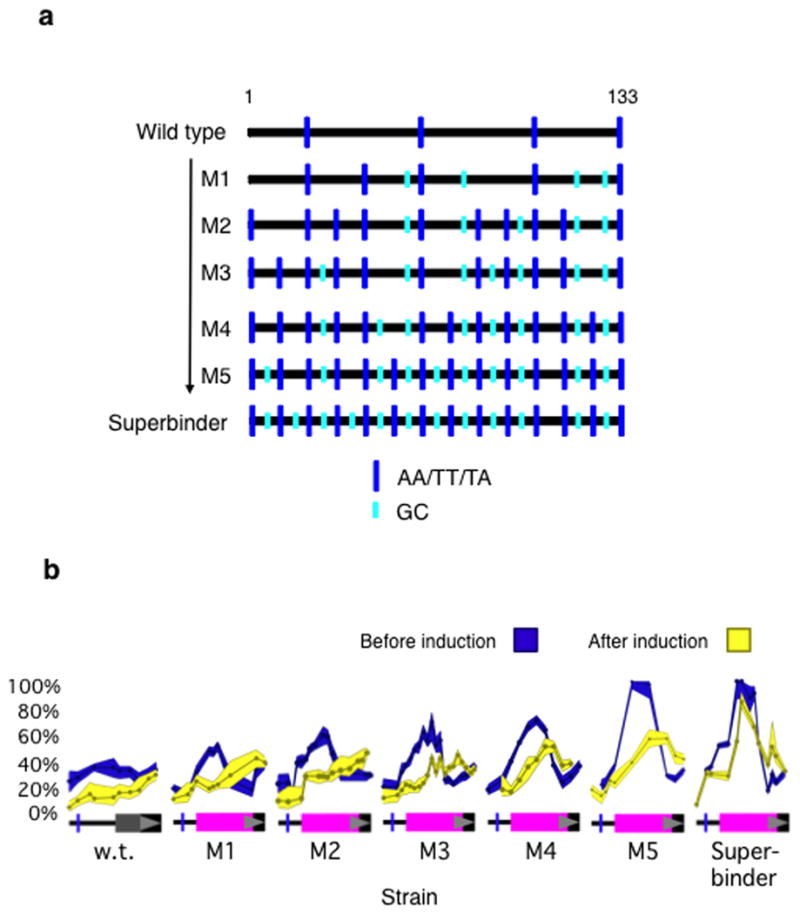
(a) The bottom line indicates the positions of GC and AT/TT/TA dinucleotide elements in a 133 bp sequence designed to form nucleosomes with high efficiency. Each successive TA element is separated by ten base pairs, as is each successive GC element. At the top is the array of these sequence elements found in the wild type (WT) sequence at position −1 in Figure 1. Each successive sequence (starting at the top) was modified by sequential substitutions of 20 bp, resulting in the distribution of TA and GC elements as indicated. The predicted nucleosome-forming propensities of these sequences increase from top to bottom (see text). (b) Nucleosome occupancies were determined, prior to (blue) and some 30 min following (yellow) induction, of wild type, superbinder and five other sequences (M1–M5) substituted at site −1 (see (a)).
Prior to induction, the degree of occupancies of variants of site −1, bearing the wild type sequence or substituted with each of the sequences of Figure 2a, increased monotonically from some 35% (wild type) to 100% (superbinder) as predicted (Fig. 2b). As the occupancy prior to induction was increased by these sequence changes, so too was the occupancy following induction. For substitutions labeled M4, M5 and “superbinder” in Figure 2b, in which cases a significant fraction of sites remain occupied after induction, the centers of binding had been shifted some 10–20 bp downstream. We have not investigated this matter further. We attempted to measure mRNA production in these mutants, and found that in every case transcription was severely reduced (not shown). The various substitutions change, and presumably damage, sequences required for transcriptional initiation. We therefore turned our attention to the effects of a substitution at site −2.
Substitution of the superbinder sequence at site −2 greatly increased nucleosome occupancy prior to induction as it did when substituted at site −1 (Fig. 1b and 1c). In contrast to its effect at site −1, however, the superbinder sequence at site −2 was essentially cleared upon induction (Fig. 1c). The conditions used in those experiments to induce the GAL genes – i.e., adding galactose to 2% to cells growing in raffinose – are extreme, unlikely to reflect induction as it often occurs in nature. A more reasonable scenario would be that cells growing in glucose and another sugar (e.g. raffinose or galactose) would first largely deplete the glucose and gradually begin to use the second sugar. Because glucose represses transcription of the GAL genes (including GAL4), this environmental change would, initially at least, induce less dramatically than does our standard laboratory method, and thus might reveal an effect on nucleosome removal of substituting the superbinder at site −2.
We therefore grew cells overnight in glucose (2%), and transferred them to medium containing a low level of glucose (0.1%) plus 2% galactose. Under these conditions, nucleosome removal from the superbinder sequenced at site −2 was significantly impaired compared to wild type (Fig. 3a). Thus whereas virtually all of the wild type sequences had been cleared by six hours (yellow), some 40% of the superbinder sites remain occupied (blue). This fraction of occupied superbinder sites after induction is about equal to the degree of occupancy of the wild type site prior to induction. We found similar results when cells were transferred from glucose to medium containing 0.1% glucose plus 0.5% or 0.1% galactose (not shown).
Figure 3. Nucleosome removal and mRNA production.
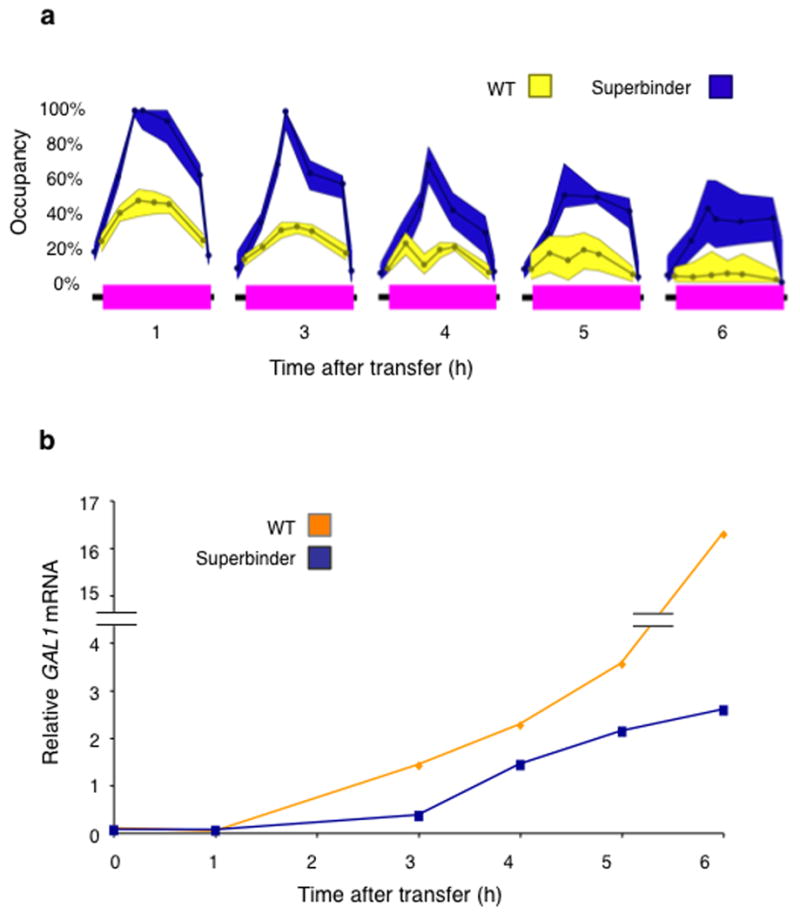
(a) Cells bearing the substitution mutant of Figure 1c, (which bears the superbinder at site −2), and wild type (WT) cells, growing in 2% glucose, were transferred to medium containing 0.1% glucose and 2% galactose. Nucleosome occupancy at the WT site −2 (yellow) and the superbinder-substituted site −2 (blue) was assayed at the indicated time points following induction. (b) Aliquots of cells used for the experiment of (a) were assayed for GAL1 mRNA using QPCR as described1.
Under strongly inducing conditions (in which the superbinder at site −2 is efficiently cleared of its nucleosome), substitution of the superbinder sequence at site −2 had little effect on mRNA production (not shown). Under weaker inducing conditions, however, – transfer from 2% glucose to 0.1% glucose plus 2% galactose – the presence of the superbinder sequence at site −2 decreased mRNA production (Fig. 3b). Thus under conditions in which nucleosome removal was decreased, so too was transcription.
We do not know why recruited Swi/Snf evidently works more efficiently on a proximal (Fig. 1c), as compared to a distal nucleosome (Fig. 1b). The DNA threading model of Bartholomew13 is, however, consistent with this finding, as well as with our finding that, upon induction, a “superbinder” nucleosome at the distal position appears to be “pushed” some 10–20 bp downstream upon induction (Fig. 2b). Nor can we be certain as to why more efficient occupancy of nucleosomal sites prior to induction correlates with higher occupancy (and decreased transcription) following induction. A simple explanation would be that once removed, nucleosomes simply reform, and they do so more efficiently at preferred sequences. We do not know how precise is the correlation between nucleosome removal as determined in our assay and the extent of transcription. Certainly nucleosome removal does not suffice under all conditions to allow transcription2.
Our current results, taken with those of Floer et al.1 might help explain the variation in the efficiencies with which Gal4 activates gene expression when working from a UASg inserted into one or another place in the genome of higher eukaryotes14,15. No RSC found in such organisms, to our knowledge, bears the specific DNA binding determinants found on yeast RSC16,17, and so we imagine that in all such cases Gal4 must compete with nucleosomes for binding to the UASg, or to an artificial array of Gal4 sites (e.g. the 5×17mer). The rate and extent of Gal4 binding would likely depend on the concentration of Gal4, the number of Gal4 sites, and so on. In this paper we add an additional variable: the efficiency with which nucleosomes form in the regions adjacent to the Gal4 sites (which we expect would not be phased) will affect the ease with which they are removed once Gal4 has bound its sites and recruited a nucleosome remodeler. A recent report suggests that mammalian promoters, unlike yeast promoters, may not have evolved to form nucleosomes inefficiently18, and if so variation in nucleosome forming potential of mammalian promoters could affect the efficiencies with which activators such as Gal4 work in those organisms.
Our findings suggest a plausible explanation, at least in part, for why promoter sequences have evolved to form nucleosomes inefficiently11,19-22. Nucleosome formation may suppress basal, unwanted gene transcription, and as such their role would mimic that of many other inhibitory factors and designs in regulatory systems. Thus inhibitors must be poised to discourage spontaneous interactions – binding interactions – but must not be so effective as to prevent activity when required23.
Methods
Yeast strains and growth conditions
All strains used here are derived from BY4741 (MATa his3Δ1 leu2Δ0 met15Δ0 ura3Δ0) obtained from EUROSCARF (European Saccharomyces cerevisiae Archive for Functional Analysis). To construct the mutant strains that substitute an array of 133 bp sequences for the wild type sequences underlying the phased nucleosome at sites −1 or −2, a two-step process was used24. In brief, a cassette containing the Kanr and URA3 genes was first inserted in the GAL1 promoter region and subsequently replaced with the desired sequences. The sequences of the primers used for the construction of these strains can be given upon request.
For all experiments reported, yeast cells were grown logarithmically overnight in synthetic complete (SC) media prior to harvesting. For galactose induction experiments, cells were grown in SC media containing 2% raffinose, and then galactose was added to the media at a final concentration of 2%. Alternatively, cells were grown in SC media containing 2% glucose, then collected by centrifugation and directly resuspended in fresh media containing 0.1% glucose and 2% galactose.
MNase protection assays
Cells were harvested at OD600 0.5–0.9 and then fixed with formaldehyde at a final concentration of 0.5% for 15 min. The fixing reaction was stopped by adding glycine to a final concentraion of 0.125M. MNase protection assays of chromatin were performed as described in Bryant et al.2. The sequences of the QPCR primers used can be given upon request.
ChIP Assays and mRNA Determination
ChIP assays probing for FLAG-tagged histone H2B were performed essentially as described1. The immunoprecipitated DNA was analyzed by QPCR. GAL1 mRNA was assayed as described25. The sequences of the QPCR primers used can be given upon request.
Supplementary Material
Acknowledgments
We thank Eran Segal (Weizmann Institute of Science) and Jon Widom (Northwestern University) for the “superbinder” sequence, and Santosh Narayan, Geogina Berrozpe, Alex Gann and Daniela Rhodes for helpful discussions. This work was supported by National Institute of Health grant GM032308 to M.P., Ludwig Professor of Molecular Biology.
Footnotes
Contributions: X.W., G.O.B., and D.S. performed the experiments. X.W. and G.O.B. analyzed the data. X.W., G.O.B., M.F. and M.P. wrote the paper.
References
- 1.Floer M, et al. Cell. 2010;141:407–18. doi: 10.1016/j.cell.2010.03.048. [DOI] [PMC free article] [PubMed] [Google Scholar]
- 2.Bryant GO, et al. PLoS Biol. 2008;6:2928–39. doi: 10.1371/journal.pbio.0060317. [DOI] [PMC free article] [PubMed] [Google Scholar]
- 3.Chung HR, et al. PLoS ONE. 2010;5:e15754. doi: 10.1371/journal.pone.0015754. [DOI] [PMC free article] [PubMed] [Google Scholar]
- 4.Fan X, et al. Proc Natl Acad Sci U S A. 2010;107:17945–50. doi: 10.1073/pnas.1012674107. [DOI] [PMC free article] [PubMed] [Google Scholar]
- 5.Satchwell SC, Drew HR, Travers AA. J Mol Biol. 1986;191:659–75. doi: 10.1016/0022-2836(86)90452-3. [DOI] [PubMed] [Google Scholar]
- 6.Segal E, et al. Nature. 2006;442:772–8. doi: 10.1038/nature04979. [DOI] [PMC free article] [PubMed] [Google Scholar]
- 7.Segal E, Widom J. Curr Opin Struct Biol. 2009;19:65–71. doi: 10.1016/j.sbi.2009.01.004. [DOI] [PMC free article] [PubMed] [Google Scholar]
- 8.Stein A, Takasuka TE, Collings CK. Nucleic Acids Res. 2010;38:709–19. doi: 10.1093/nar/gkp1043. [DOI] [PMC free article] [PubMed] [Google Scholar]
- 9.Tillo D, Hughes TR. BMC Bioinformatics. 2009;10:442. doi: 10.1186/1471-2105-10-442. [DOI] [PMC free article] [PubMed] [Google Scholar]
- 10.Travers AA, Klug A. Philos Trans R Soc Lond B Biol Sci. 1987;317:537–61. doi: 10.1098/rstb.1987.0080. [DOI] [PubMed] [Google Scholar]
- 11.Kaplan N, et al. Nature. 2009;458:362–6. doi: 10.1038/nature07667. [DOI] [PMC free article] [PubMed] [Google Scholar]
- 12.Takasuka TE, Stein A. Nucleic Acids Res. 2010 doi: 10.1093/nar/gkq279. [DOI] [PMC free article] [PubMed] [Google Scholar]
- 13.Dechassa ML, et al. Mol Cell. 2010;38:590–602. doi: 10.1016/j.molcel.2010.02.040. [DOI] [PMC free article] [PubMed] [Google Scholar]
- 14.Ahmad K, Henikoff S. Cell. 2001;104:839–47. doi: 10.1016/s0092-8674(01)00281-1. [DOI] [PubMed] [Google Scholar]
- 15.Halpern ME, et al. Zebrafish. 2008;5:97–110. doi: 10.1089/zeb.2008.0530. [DOI] [PMC free article] [PubMed] [Google Scholar]
- 16.Mohrmann L, Verrijzer CP. Biochim Biophys Acta. 2005;1681:59–73. doi: 10.1016/j.bbaexp.2004.10.005. [DOI] [PubMed] [Google Scholar]
- 17.Wilson B, Erdjument-Bromage H, Tempst P, Cairns BR. Genetics. 2006;172:795–809. doi: 10.1534/genetics.105.047589. [DOI] [PMC free article] [PubMed] [Google Scholar]
- 18.Tillo D, et al. PLoS ONE. 2010;5:e9129. doi: 10.1371/journal.pone.0009129. [DOI] [PMC free article] [PubMed] [Google Scholar]
- 19.Bernstein BE, Liu CL, Humphrey EL, Perlstein EO, Schreiber SL. Genome Biol. 2004;5:R62. doi: 10.1186/gb-2004-5-9-r62. [DOI] [PMC free article] [PubMed] [Google Scholar]
- 20.Lee CK, Shibata Y, Rao B, Strahl BD, Lieb JD. Nat Genet. 2004;36:900–5. doi: 10.1038/ng1400. [DOI] [PubMed] [Google Scholar]
- 21.Sekinger EA, Moqtaderi Z, Struhl K. Mol Cell. 2005;18:735–48. doi: 10.1016/j.molcel.2005.05.003. [DOI] [PubMed] [Google Scholar]
- 22.Zhang Y, et al. Nat Struct Mol Biol. 2009;16:847–52. doi: 10.1038/nsmb.1636. [DOI] [PMC free article] [PubMed] [Google Scholar]
- 23.Ptashne M. Curr Biol. 2009;19:R234–41. doi: 10.1016/j.cub.2009.02.015. [DOI] [PubMed] [Google Scholar]
- 24.Storici F, Resnick MA. Methods Enzymol. 2006;409:329–45. doi: 10.1016/S0076-6879(05)09019-1. [DOI] [PubMed] [Google Scholar]
- 25.Wang X, Muratani M, Tansey WP, Ptashne M. Curr Biol. 2010;20:868–71. doi: 10.1016/j.cub.2010.03.029. [DOI] [PMC free article] [PubMed] [Google Scholar]
Associated Data
This section collects any data citations, data availability statements, or supplementary materials included in this article.