

Abstract
We used detailed phylogenetic trees for human mtDNA, combined with pathogenicity predictions for each amino acid change, to evaluate selection on mtDNA-encoded protein variants. Protein variants with high pathogenicity scores were significantly rarer in the older branches of the tree. Variants that have formed and survived multiple times in the human phylogenetics tree had significantly lower pathogenicity scores than those that only appear once in the tree. We compared the distribution of pathogenicity scores observed on the human phylogenetic tree to the distribution of all possible protein variations to define a measure of the effect of selection on these protein variations. The measured effect of selection increased exponentially with increasing pathogenicity score. We found no measurable difference in this measure of purifying selection in mtDNA across the global population, represented by the macrohaplogroups L, M, and N. We provide a list of all possible single amino acid variations for the human mtDNA-encoded proteins with their predicted pathogenicity scores and our measured selection effect as a tool for assessing novel protein variations that are often reported in patients with mitochondrial disease of unknown origin or for assessing somatic mutations acquired through aging or detected in tumors.
Introduction
mtDNA population studies1 have shown how human migrations and genetic drift were responsible for the current distribution of maternal lineages across the world; the oldest lineages (designated by L) are observed in Africa, whereas all non-African clades can be subdivided into two groups (M and N) derived from the African haplogroup L3. Broadly, L (except for the M and N subclades of L3) is only observed in populations of African ancestry,2 whereas M is most frequent in South and East Asia3–5 and N has a vast geographic distribution but is the only macrohaplogroup in West Eurasia and Southwest Asia, where M is virtually absent.1
Many studies in humans and other species have indicated the importance of nonneutral mtDNA variation. For instance, by comparing the sequences of the gene MT-ND3 among 61 humans, five chimpanzees, and one gorilla, Nachman et al.6 observed that the ratio of replacement to silent nucleotide substitutions was higher within humans and within chimpanzees than in comparisons between the two species, contrary to neutral expectations. This result was later confirmed in 17 out of 25 studied animal species7 and attributed to a substantial number of mildly deleterious amino acid mutations that contribute to heterozygosity but rarely become fixed in the population. Since then, many other authors have published reports on the effect of purifying selection against nonsynonymous mutations in mtDNA in many other species, such as in Adélie penguins8 in which recent and ancient mtDNA samples were compared and in mice9 in which a rapid loss of these mutations in the genetically engineered mutator mouse line expressing a proofreading-deficient mtDNA polymerase has been observed.
If selection on human mtDNA variations were to vary across the globe, the distribution of lineages would be influenced, thus affecting inferences on human migrations and age estimates for branch divergences in the phylogenetic tree. An early analysis of 104 worldwide human mtDNA complete sequences10 proposed climate as a selection force that shaped human mtDNA variation differently in the arctic and temperate zones, although not being effective in tropical Africa. This claim has been controversial and has been refuted through phylogenetic analyses11–13 and an experimental bioenergetics approach.14 Accepting a scenario of purifying selection acting equally throughout the human mtDNA tree, Soares et al. have proposed a correction to the molecular clock that includes the modest effect of selection.15
Phylogenetic evaluations of selection in humans have mainly been restricted to comparisons either between haplogroups observed in the three main geographic regions10,12,13,16 or by comparing terminal branches to internal branches of the tree.11,17 The haplogroup methods suffer from a problem of mixing lineages with diverse times of emergence, whereas the branch comparison method suffers from a similar problem of combining internal branches that can differ by almost 200,000 years in their time of formation.1,15 In order to avoid these simplifications and use the full complexity of the human mtDNA phylogenetic tree, the statistic ρ, which measures the diversity (the average number of sites differing between a set of sequences and a specified common ancestor) accumulated in each node of the tree18 can be used. The value of ρ increases with increasing depth of a node within the tree, corresponding to increasing age of the node. Thus, ρ is an objective measure of the depth of a node within the tree and is an indicator of the age of the mutations defining the branch leading to that node. Converting ρ to time would require assumptions about the consistency of mutation rates on different branches of the phylogenetic tree, and there is some disagreement in the literature related to differences in mutation rates.15,19 That subjectivity can be avoided by not transforming ρ into time.
Another major factor in evaluating selection is the definition of a deleterious mutation. Traditionally, ratios of nonsynonymous and synonymous variations are compared, but this lumps together all nonsynonymous variations even though many substitutions of amino acids with similar physical and chemical properties are well tolerated (perhaps even neutral).20,21 As an estimate of the impact of an amino acid change on the protein function, we used the recently developed MutPred score,22 which builds on the well-established SIFT method.23 This score is based upon the protein sequence, structural features, and comparison between functional sites in putatively neutral variations and reported pathogenic mutations. The MutPred pathogenicity score ranges from 0 to 1. Higher pathogenicity scores correspond to a greater likelihood that the amino acid variation might be pathogenic.
In this work, we used the phylogenetic reconstruction from two recent sources,2,15 one for the M and N subtrees (based on 843 and 1154 sequences, respectively) and the second for the L subtree excluding M and N (based on 624 sequences). We then evaluated the distribution of MutPred pathogenicity scores for nonsynonymous substitutions along the trees by using ρ as an objective measure of the depth of a node. For comparison, we also calculated the MutPred pathogenicity score for all of the 24,206 possible amino acid changes (defined as single point mutations from the revised Cambridge reference sequence24) on the 13 human mtDNA-encoded proteins.25
Material and Methods
Pathogenicity Measure
The MutPred analysis score22 was used as a proxy for the pathogenicity of an amino acid variation for the 13 proteins encoded by the mtDNA. Higher pathogenicity scores correspond to a greater likelihood that the amino acid variation is pathogenic. The revised Cambridge reference sequence (rCRS24) was used to define the reference amino acid sequence of each gene. Pathogenicity scores were calculated for all of the 24,206 possible amino acid variations defined by a single point mutation away from the reference sequence. The list of all possible amino acid variations from the reference sequence was defined by using the mtDNA-GeneSyn software.25 All observed protein variants listed in the L, M, and N trees (described below) were included in this list, indicating that this list of all possible variants was sufficient (i.e., two or more nucleotide variations within a single codon were not needed).
The MutPred score is determined by a set of features reflecting protein structure and its dynamics, the presence of functional residues, biases of amino acid sequence, and evolutionary conservation at the substitution site and in its neighborhood. The software was trained as a random forest classification model26 to discriminate between disease-associated amino acid substitutions from the Human Gene Mutation Database27 and putatively neutral polymorphisms from Swiss-Prot.28 In addition to its pathogenicity (or general) score, MutPred also outputs p values for various hypotheses (property scores) regarding the molecular basis of disease (e.g., loss of structure, gain of a phosphorylation site, etc.). In this work, only the pathogenicity score was analyzed.
The MutPred scoring software was trained on a set of 65,657 reported variants on 10,150 proteins.22 The vast majority of this training set consisted of nuclear-encoded genes. Ninety-six of the variants in the training set were mtDNA population variants, and 57 of these variants were involved in this phylogenic analysis (0.09% of the training set). No mtDNA variants were included in the pathogenic training set.
Human mtDNA Phylogeny
Two recent sources were used to define the three basic subtrees for the human mtDNA phylogeny. Soares et al.15 was used for the M and N subtrees, which contain 843 and 1154 samples, respectively. Because the level of detail in the L subtree excluding M and N, represented as L(xM,N), in Soares et al.15 was much lower (199 samples) than the one in Behar et al.2, the latter was used as the source for the L(xM,N) subtree in this analysis (624 samples).
The nonsynonymous variations within the protein genes were identified for each branch of the three trees. For each node on the M, N, and L trees, we calculated the ρ value,18 that is, the average number of sites differing between a set of sequences and a specified common ancestor. Because variations are associated with branches and ρ values are properties of nodes, a choice of ρ value (upper or lower node on the branch) must be made. The ρ of the node at the distal (lower) end of the branch was used in this analysis. This value provides a lower bound on the age of a mutation. We did not attempt to convert the ρ values to actual ages to avoid making unnecessary assumptions about the mutation rate. Variations that occurred independently on separate branches of the trees were necessarily included in the analysis multiple times, once for each branch on which they independently arose. The complete data set is given in Table S1.
Reported Pathogenic mtDNA Variations
All reported pathogenic variations in mtDNA in the Online Mendelian Inheritance in Man (OMIM) database as of December 2010 were collected. The reported pathogenic variations resulting in a single amino acid change were analyzed (Table S2). Insertion and deletion variants and premature stop codons were not analyzed because the pathogenicity score used here only applies to single amino acid variations. To avoid bias, we analyzed all of these reported pathogenic variations without attempting to evaluate the evidence for pathogenicity in each case or the magnitude of the pathogenic effect. Such evaluations were judged to be too subjective.
Statistics and Exponential Fit
The p values for all comparisons of mean values were calculated in Excel by using two-tailed t tests assuming unequal variances. A selection function for the amino acid variants was calculated by dividing the distribution of pathogenicity scores for all observed protein variants by the distribution of scores for all possible variations. The nonlinear curve fit of the selection function to the pathogenicity score was done in Origin 7. The fit had R2 = 0.96 with a p value < 0.0001. The fit had the exponential form (14 ± 2) × exp(−S/(0.26 ± 0.04)), where S is the pathogenicity score.
Results
The pathogenicity scores for all nonsynonymous amino acid variations occurring in the three human mtDNA subtrees (a total of 938 amino acid variants distributed on 2227 branches of the phylogenetic tree) displayed a trend of decreasing ρ value as the pathogenicity score increases and a rapid drop in average ρ value for pathogenicity scores greater than 0.6 to 0.7 (Figure 1 and Figure S1). High pathogenicity scores are absent from the older nodes (higher ρ values) in the tree (Figures S1 and S2). Based on this pattern, we separated the amino acid variants into a high pathogenicity score group (≥0.7) and a low pathogenicity score group (<0.7). For the L, M, and N trees, the high pathogenicity score group occurred preferentially on younger branches of the trees, indicated by low average ρ values (Figure 2A), consistent with selection against these variants. Compared across all three trees there is no significant difference in the average ρ value in the variants with high pathogenicity scores. The much deeper time scale of the L tree can be seen in the much higher ρ values for the low pathogenicity score variants in that tree.
Figure 1.
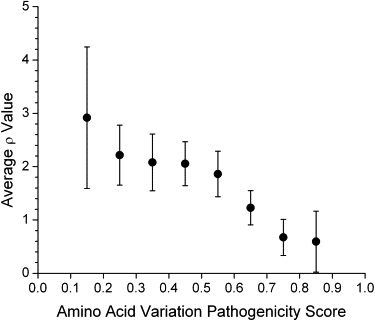
Average Values of the Statistic ρ for All Nonsynonymous Variations on Every Node in the Three Human mtDNA Subtrees, Macrohaplogroups L, M, and N
The variations are broken down by the pathogenicity score (ranging from 0 to 1) of the variation, averaged over bins of size 0.1. Values below 0.1 and above 0.9 are not averaged because of the small number of data points in those ranges (n = 3 with pathogenicity score < 0.1 and n= 7 with pathogenicity score > 0.9). The values plotted are mean ± 2 standard errors of the mean (SEM).
Figure 2.
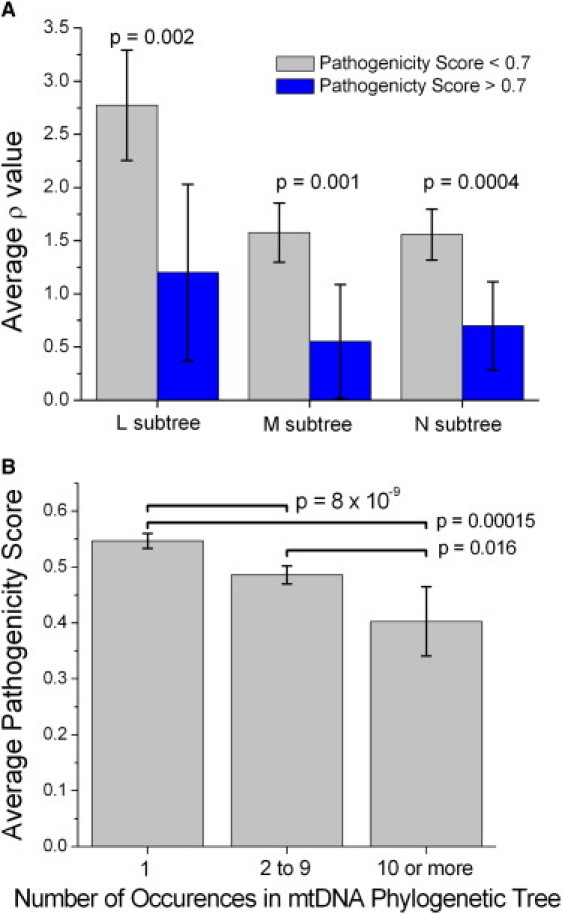
Statistics of the Distribution of the Pathogenicity Scores in the Human Phylogenetics Trees
(A) A comparison of the average ρ values for amino acid variants in the L, M, and N trees for pathogenicity scores lower and higher than 0.7.
(B) Average pathogenicity scores for the variants that occur only once in the tree, two to nine times, and ten or more times.
In both panels the values plotted are mean ± 2 SEM. The p values are for a two-tailed t test comparison of the average values.
It is fairly common that an mtDNA variation occurs on multiple independent branches of the phylogenetic tree. These multiple occurrences indicate multiple and independent mutation events forming the same variant. A reasonable hypothesis is that those variants that have formed multiple times in human evolution, and that have survived purifying selection multiple times should have lower pathogenicity scores. To test this hypothesis, we grouped the variants into those that occurred (over the L, M, and N trees combined) only once (n = 528 variants), those that occurred two to nine times (n = 388), and those that occurred ten or more times (n = 22) and calculated the average pathogenicity score in each group. These average pathogenicity scores show a statistically very significant decrease as the number of occurrences of the variation in the human phylogenetic tree increases (Figure 2B), indicating that a lower predicted pathogenicity is needed for a variation to survive multiple times within the tree. The observation that some mtDNA mutations have reoccurred many time independently in recent human evolution is often attributed to higher mutation rates for these particular variations.15,29 The result in Figure 2B indicates that the number of times that a variation occurs in the tree is a complicated combination of both mutation rates that might vary with position and purifying selection that varies with the pathogenicity score of the variation.
The observed nonsynonymous variations in the human mtDNA phylogenetic trees are only a small fraction of all the possible amino acids changes that could occur through a single nucleotide change. We compared the probability distributions of the pathogenicity score for the amino acid variants in each tree to the distribution of the pathogenicity scores for all possible variants (Figure 3A). The set of all possible variations is strongly skewed toward higher pathogenicity scores, indicating that most variants are deleterious. The three human mtDNA trees all have much lower average pathogenicity scores than the set of all possible variations (p < 10−100). Surprisingly, the distribution of pathogenicity scores in each of the three trees is nearly identical, and the average scores are not significantly different (L versus M, p = 0.20; L versus N, p = 0.97; M versus N, p = 0.16).
Figure 3.
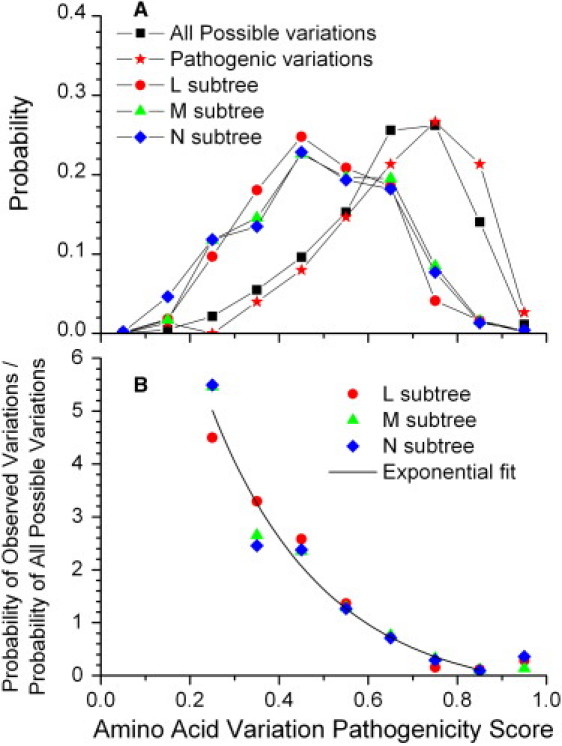
Assessing Selection as a Function of the Pathogenicity Score
(A) Probability distributions of the observed amino acid variation pathogenicity scores for each of the three human mtDNA subtrees and the OMIM list of pathogenic mtDNA variants compared against the probability distribution of all possible variations.
(B) The selection function for the amino acid variants defined by dividing the observed distributions of pathogenicity scores by the distribution of scores for all possible variations. The exponential fit is to the data with pathogenicity scores from 0.2 to 0.9 (R2 = 0.96).
As noted above, several mtDNA variants have independently arisen multiple times throughout the human phylogenetic tree. We then checked whether the agreement of the distribution of pathogenicity scores in the three trees could be due to the same amino acid changes occurring on the three trees. To test this, we analyzed only the subset of variants that were unique to each tree (187 unique variants for L, 221 for M, and 327 for N). Even just considering the unique nonsynonymous variants from each of the trees, the plots were remarkably similar (Figure S3) and clearly different than the distribution of all possible variants. The mean values for the pathogenicity scores of the variants specific to each tree were not significantly different (L versus M, p = 0.8; L versus N, p = 0.8; M versus N, p = 0.9).
A possible explanation for the difference in probability distribution between the observed variants and the list of all possible variations is that the list of all possible variants consists mainly of amino acid variants caused by transversions, whereas the observed variants consist overwhelmingly of transitions. If there was a strong difference in the pathogenicity scores for transitions compared to transversions, then this could be the cause for the difference between the distributions of the observed variants and all possible variants. To test this, we split the list of all possible variants into those variants arising from transitions and those arising from transversions (Figure S4). The distributions of the pathogenicity scores for transitions and transversions are very similar, and the set of all possible transitions is still significantly different from the observed variants (p < 10−100), so this explanation can be confidently rejected.
As a counterpoint to the population level variants, it is instructive to consider the properties of the identified pathogenic mutations in the mitochondrially encoded proteins. For an authoritative source for identified pathogenic mutations in the 13 mtDNA-encoded proteins, we used the OMIM database, which currently lists 75 pathogenic variants in these proteins involving a single amino acid change (Table S2). To avoid bias in the definition of this list, we included all such variants listed in OMIM without attempting to assess the severity of the pathology or the strength of the evidence for pathogenicity. The distribution of the pathogenicity scores for these reported pathogenic mutations (Figure 3A) is remarkably close to the distribution for all possible variants. The mean pathogenicity score for the OMIM pathogenic variants is only slightly higher than that of all possible variants (mean = 0.68 ± 0.03 for OMIM variants, 0.645 ± 0.002 for all variants), and the difference between these means does not quite reach statistical significance (p = 0.06). This agreement between the probability distributions indicates that the pathogenic variants approximate a random sample from all possible variations, thus indicating that purifying selection has not yet acted strongly upon these variants.
We can use the evolution of human mtDNA-encoded proteins as a natural experiment to quantitatively measure the effect of selection on variations in these proteins. We defined a selection function for the amino acid variants by dividing the distribution of pathogenicity scores for all observed protein variants by the distribution of scores for all possible variations (Figure 3B). This selection function for all three trees is consistent with a remarkably simple exponential decay (R2 = 0.96, p < 0.0001) of the form
where P is the probability distribution of the pathogenicity scores and S is the pathogenicity score. Curiously, the measured selection function values for the variants with very high pathogenicity score (>0.9) lie quite a bit above the exponential fit in all three trees (Figure 3B). At this time we cannot say whether this is due just to noise or sequencing errors introducing unreal variations or whether there is something different about the purifying selection that has acted on those variants with extremely high pathogenicity score. The consistency of the selection function values from the L, M, and N trees indicates that there is no significant difference in the selection that has occurred in the evolution of populations from these three geographical groups. This definition of the selection function gives a biologically-based calibration of the pathogenicity scores by using human evolution as the determinant of that scale.
The progress over time of the purifying selection on human mtDNA can be seen by comparing the pathogenicity scores of recently acquired mutations to the oldest variations (Figure 4). We defined recently acquired variants as those on the branches connecting nodes with ρ values between 0 (the leaves of the trees) and 2. For comparison, the old variations were defined as those on branches above nodes with ρ values of 20 or higher. There were 182 recent variants and 23 old variants. As should be expected, the vast majority of the old variants were from the L tree (n = 18) representing the sub-Saharan Africa population, but there were also four variants from the M tree and one from the N tree. The pathogenicity scores for the oldest variants are significantly shifted (p = 0.0009 from a two-tailed t test for difference in the means; p = 0.0016 from a nondirectional Mann-Whitney test) to lower values compared to the most recently acquired variants (the mean pathogenicity score for the new variants was 0.51, and for the old variants was 0.40). By comparing the shapes of the distributions, it is clear that this difference has developed through the loss of the variants with a higher pathogenicity score.
Figure 4.
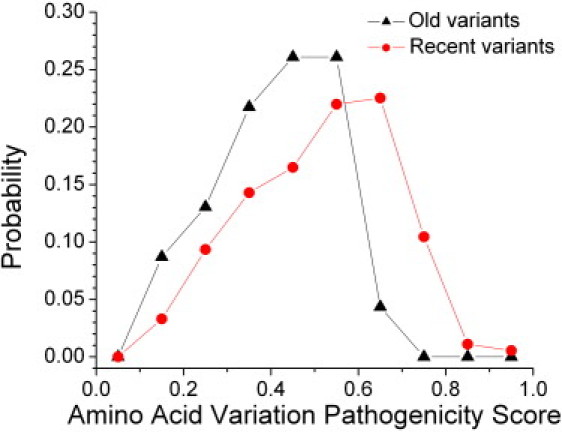
Comparing Old and Recent Variants
Probability distributions of the pathogenicity scores for recently formed protein variants (defined as those on branches connecting nodes with ρ = 0 and ρ ≤ 2) and old variants (ρ ≥ 20).
Discussion
mtDNA has a special feature that makes it a useful genomic tool for the difficult issue of evaluating selection. The maternal inheritance of mtDNA avoids the shuffling by recombination of alleles inherited from both parents that occurs in nuclear DNA genes. That lack of recombination from the two parents means a single clear phylogeny can be constructed for these 13 mtDNA-encoded genes, extending back to the most recent maternal ancestor, roughly 200,000 years ago. That phylogeny is now well established and has been described in great detail, allowing us to determine the time-order of the formation of all of these variations in these genes. The same analysis would be far more difficult, perhaps impracticably so, for nuclear genes, including the ones that code for proteins of the oxidative respiratory chain. These nuclear-encoded genes for mitochondrial proteins are of particular interest because they must coadapt with mitochondrial genes because proteins coded by both genomes interact to form the oxidative phosphorylation protein complexes.30,31
The equivalent distribution of pathogenicity scores for the L, M, and N trees indicates that the purifying selective forces producing these distributions have been equal on each of the trees despite their different geographic distributions and thus different climates affecting these populations. This implies that the primary selective force acting on the mtDNA-encoded proteins does not involve adaptive evolution for temperature regulation or any other environmental factor that might differ between the sub-Saharan African populations and the rest of the global population. However, this analysis involves the statistics of the probability distributions of the complete set of variations of the 13 mtDNA-encoded proteins, so we can only draw conclusions about the general forces of selection acting across the full set of protein variations. By necessity, this analysis might not detect selection effects focused on a very small set of variations.
Other than varying environmental effects, what other factors might have affected the global distribution of mtDNA variants? The effective population size could be an important variable. The survival of mutations within any population, or subpopulation, is determined by the balance of selection (either positive or negative) and random drift. The weight of random drift in this balance is strongly affected by the effective population size32 and smaller subpopulations are more likely to retain deleterious mutations through random drift. Considering the large bottleneck that must have occurred in the migration of the European and Asiatic ancestral population out of Africa, the effective population sizes must have varied greatly between the African and non-African branches of humanity. This raises the possibility that random drift alone might have increased the survival of deleterious mutations in the M and N subtrees. The fact that we do not see any indication of such a difference in this data (Figure 3) indicates that the purifying selection effects on mtDNA variation were strong enough to outweigh the varying effects of random drift between the L, M, and N subtrees.
The quantitative approach used here combining phylogenetics and pathogenicity scoring is a powerful method for evaluating and quantifying the effect of selection on protein variants. By using these methods, we can use the evolution of humans over the past 200,000 years to calibrate the force of selection on these proteins. In Figure 3B we showed that the probability distribution for the observed mtDNA-encoded protein variants divided by the probability distribution for the set of all possible variations on these proteins had a surprisingly simple and clear exponential function. We propose that the relative effect of selection on two different amino acid variations with pathogenicity scores S1 and S2 can be assessed by a ratio of this exponential function for the two S values. For example, based on this exponential selection function a variation with a pathogenicity score of 0.8 is more than twice as bad as a variation with score 0.6 (calculate by exp((0.8-0.6)/0.26) = 2.2), meaning that mtDNA-encoded protein variations with pathogenicity score of 0.8 have experienced twice as much purifying selection in recent human evolution compared to variations with pathogenicity score of 0.6.
In Table S3, we provide the list of all possible amino acid variations that can be reached by a single nucleotide shift from the human mtDNA reference sequence and include pathogenicity scores and predicted selection strengths for each variant. These data could be of use in evaluating the case for pathogenicity of novel variants in the mtDNA-encoded proteins of patients with mitochondrial diseases of unknown origin or in evaluating the possible functional changes of somatic mtDNA mutations acquired through the aging process or in cancer cells.
Acknowledgments
The Portuguese Foundation for Science and Technology (FCT) supported this work through a grant to P.S. (SFRH/BPD/64233/2009). IPATIMUP is an Associate Laboratory of the Portuguese Ministry of Science, Technology and Higher Education and is partially supported by FCT.
Supplemental Data
Web Resources
The URL for data presented herein is as follows:
Online Mendelian Inheritance in Man (OMIM), http://www.ncbi.nlm.nih.gov/omim
References
- 1.Torroni A., Achilli A., Macaulay V., Richards M., Bandelt H.J. Harvesting the fruit of the human mtDNA tree. Trends Genet. 2006;22:339–345. doi: 10.1016/j.tig.2006.04.001. [DOI] [PubMed] [Google Scholar]
- 2.Behar D.M., Villems R., Soodyall H., Blue-Smith J., Pereira L., Metspalu E., Scozzari R., Makkan H., Tzur S., Comas D., Genographic Consortium The dawn of human matrilineal diversity. Am. J. Hum. Genet. 2008;82:1130–1140. doi: 10.1016/j.ajhg.2008.04.002. [DOI] [PMC free article] [PubMed] [Google Scholar]
- 3.Sun C., Kong Q.P., Palanichamy M.G., Agrawal S., Bandelt H.J., Yao Y.G., Khan F., Zhu C.L., Chaudhuri T.K., Zhang Y.P. The dazzling array of basal branches in the mtDNA macrohaplogroup M from India as inferred from complete genomes. Mol. Biol. Evol. 2006;23:683–690. doi: 10.1093/molbev/msj078. [DOI] [PubMed] [Google Scholar]
- 4.Kong Q.P., Yao Y.G., Sun C., Bandelt H.J., Zhu C.L., Zhang Y.P. Phylogeny of east Asian mitochondrial DNA lineages inferred from complete sequences. Am. J. Hum. Genet. 2003;73:671–676. doi: 10.1086/377718. [DOI] [PMC free article] [PubMed] [Google Scholar]
- 5.Macaulay V., Hill C., Achilli A., Rengo C., Clarke D., Meehan W., Blackburn J., Semino O., Scozzari R., Cruciani F. Single, rapid coastal settlement of Asia revealed by analysis of complete mitochondrial genomes. Science. 2005;308:1034–1036. doi: 10.1126/science.1109792. [DOI] [PubMed] [Google Scholar]
- 6.Nachman M.W., Brown W.M., Stoneking M., Aquadro C.F. Nonneutral mitochondrial DNA variation in humans and chimpanzees. Genetics. 1996;142:953–963. doi: 10.1093/genetics/142.3.953. [DOI] [PMC free article] [PubMed] [Google Scholar]
- 7.Nachman M.W. Deleterious mutations in animal mitochondrial DNA. Genetica. 1998;102-103:61–69. [PubMed] [Google Scholar]
- 8.Subramanian S., Denver D.R., Millar C.D., Heupink T., Aschrafi A., Emslie S.D., Baroni C., Lambert D.M. High mitogenomic evolutionary rates and time dependency. Trends Genet. 2009;25:482–486. doi: 10.1016/j.tig.2009.09.005. [DOI] [PubMed] [Google Scholar]
- 9.Stewart J.B., Freyer C., Elson J.L., Wredenberg A., Cansu Z., Trifunovic A., Larsson N.G. Strong purifying selection in transmission of mammalian mitochondrial DNA. PLoS Biol. 2008;6:e10. doi: 10.1371/journal.pbio.0060010. [DOI] [PMC free article] [PubMed] [Google Scholar]
- 10.Mishmar D., Ruiz-Pesini E., Golik P., Macaulay V., Clark A.G., Hosseini S., Brandon M., Easley K., Chen E., Brown M.D. Natural selection shaped regional mtDNA variation in humans. Proc. Natl. Acad. Sci. USA. 2003;100:171–176. doi: 10.1073/pnas.0136972100. [DOI] [PMC free article] [PubMed] [Google Scholar]
- 11.Moilanen J.S., Majamaa K. Phylogenetic network and physicochemical properties of nonsynonymous mutations in the protein-coding genes of human mitochondrial DNA. Mol. Biol. Evol. 2003;20:1195–1210. doi: 10.1093/molbev/msg121. [DOI] [PubMed] [Google Scholar]
- 12.Kivisild T., Shen P., Wall D.P., Do B., Sung R., Davis K., Passarino G., Underhill P.A., Scharfe C., Torroni A. The role of selection in the evolution of human mitochondrial genomes. Genetics. 2006;172:373–387. doi: 10.1534/genetics.105.043901. [DOI] [PMC free article] [PubMed] [Google Scholar]
- 13.Elson J.L., Turnbull D.M., Howell N. Comparative genomics and the evolution of human mitochondrial DNA: Assessing the effects of selection. Am. J. Hum. Genet. 2004;74:229–238. doi: 10.1086/381505. [DOI] [PMC free article] [PubMed] [Google Scholar]
- 14.Amo T., Brand M.D. Were inefficient mitochondrial haplogroups selected during migrations of modern humans? A test using modular kinetic analysis of coupling in mitochondria from cybrid cell lines. Biochem. J. 2007;404:345–351. doi: 10.1042/BJ20061609. [DOI] [PMC free article] [PubMed] [Google Scholar]
- 15.Soares P., Ermini L., Thomson N., Mormina M., Rito T., Röhl A., Salas A., Oppenheimer S., Macaulay V., Richards M.B. Correcting for purifying selection: An improved human mitochondrial molecular clock. Am. J. Hum. Genet. 2009;84:740–759. doi: 10.1016/j.ajhg.2009.05.001. [DOI] [PMC free article] [PubMed] [Google Scholar]
- 16.Subramanian S. Temporal trails of natural selection in human mitogenomes. Mol. Biol. Evol. 2009;26:715–717. doi: 10.1093/molbev/msp005. [DOI] [PubMed] [Google Scholar]
- 17.Ruiz-Pesini E., Mishmar D., Brandon M., Procaccio V., Wallace D.C. Effects of purifying and adaptive selection on regional variation in human mtDNA. Science. 2004;303:223–226. doi: 10.1126/science.1088434. [DOI] [PubMed] [Google Scholar]
- 18.Forster P., Harding R., Torroni A., Bandelt H.J. Origin and evolution of Native American mtDNA variation: A reappraisal. Am. J. Hum. Genet. 1996;59:935–945. [PMC free article] [PubMed] [Google Scholar]
- 19.Endicott P., Ho S.Y.W. A Bayesian evaluation of human mitochondrial substitution rates. Am. J. Hum. Genet. 2008;82:895–902. doi: 10.1016/j.ajhg.2008.01.019. [DOI] [PMC free article] [PubMed] [Google Scholar]
- 20.Henikoff S., Henikoff J.G. Performance evaluation of amino acid substitution matrices. Proteins. 1993;17:49–61. doi: 10.1002/prot.340170108. [DOI] [PubMed] [Google Scholar]
- 21.Ng P.C., Henikoff S. Predicting the effects of amino acid substitutions on protein function. Annu. Rev. Genomics Hum. Genet. 2006;7:61–80. doi: 10.1146/annurev.genom.7.080505.115630. [DOI] [PubMed] [Google Scholar]
- 22.Li B., Krishnan V.G., Mort M.E., Xin F.X., Kamati K.K., Cooper D.N., Mooney S.D., Radivojac P. Automated inference of molecular mechanisms of disease from amino acid substitutions. Bioinformatics. 2009;25:2744–2750. doi: 10.1093/bioinformatics/btp528. [DOI] [PMC free article] [PubMed] [Google Scholar]
- 23.Ng P.C., Henikoff S. SIFT: Predicting amino acid changes that affect protein function. Nucleic Acids Res. 2003;31:3812–3814. doi: 10.1093/nar/gkg509. [DOI] [PMC free article] [PubMed] [Google Scholar]
- 24.Andrews R.M., Kubacka I., Chinnery P.F., Lightowlers R.N., Turnbull D.M., Howell N. Reanalysis and revision of the Cambridge reference sequence for human mitochondrial DNA. Nat. Genet. 1999;23:147. doi: 10.1038/13779. [DOI] [PubMed] [Google Scholar]
- 25.Pereira L., Freitas F., Fernandes V., Pereira J.B., Costa M.D., Costa S., Máximo V., Macaulay V., Rocha R., Samuels D.C. The diversity present in 5140 human mitochondrial genomes. Am. J. Hum. Genet. 2009;84:628–640. doi: 10.1016/j.ajhg.2009.04.013. [DOI] [PMC free article] [PubMed] [Google Scholar]
- 26.Breiman L. Random forests. Mach. Learn. 2001;45:5–32. [Google Scholar]
- 27.Stenson P.D., Mort M., Ball E.V., Howells K., Phillips A.D., Thomas N.S., Cooper D.N. The Human Gene Mutation Database: 2008 update. Genome Med. 2009;1:13. doi: 10.1186/gm13. [DOI] [PMC free article] [PubMed] [Google Scholar]
- 28.Boeckmann B., Bairoch A., Apweiler R., Blatter M.C., Estreicher A., Gasteiger E., Martin M.J., Michoud K., O'Donovan C., Phan I. The SWISS-PROT protein knowledgebase and its supplement TrEMBL in 2003. Nucleic Acids Res. 2003;31:365–370. doi: 10.1093/nar/gkg095. [DOI] [PMC free article] [PubMed] [Google Scholar]
- 29.Excoffier L., Yang Z.H. Substitution rate variation among sites in mitochondrial hypervariable region I of humans and chimpanzees. Mol. Biol. Evol. 1999;16:1357–1368. doi: 10.1093/oxfordjournals.molbev.a026046. [DOI] [PubMed] [Google Scholar]
- 30.Blier P.U., Dufresne F., Burton R.S. Natural selection and the evolution of mtDNA-encoded peptides: Evidence for intergenomic co-adaptation. Trends Genet. 2001;17:400–406. doi: 10.1016/s0168-9525(01)02338-1. [DOI] [PubMed] [Google Scholar]
- 31.Rand D.M., Haney R.A., Fry A.J. Cytonuclear coevolution: The genomics of cooperation. Trends Ecol. Evol. (Amst.) 2004;19:645–653. doi: 10.1016/j.tree.2004.10.003. [DOI] [PubMed] [Google Scholar]
- 32.Kimura M. Evolutionary rate at the molecular level. Nature. 1968;217:624–626. doi: 10.1038/217624a0. [DOI] [PubMed] [Google Scholar]
Associated Data
This section collects any data citations, data availability statements, or supplementary materials included in this article.