

Abstract
Tobacco smoking is responsible for substantial morbidity and mortality worldwide, in particular through cardiovascular, pulmonary, and malignant pathology. CpG methylation might plausibly play a role in a variety of smoking-related phenomena, as suggested by candidate gene promoter or global methylation studies. Arrays allowing hypothesis-free searches on a scale resembling genome-wide studies of SNPs have become available only very recently. Methylation extents in peripheral-blood DNA were assessed at 27,578 sites in more than 14,000 gene promoter regions in 177 current smokers, former smokers, and those who had never smoked, with the use of the Illumina HumanMethylation 27K BeadChip. This revealed a single locus, cg03636183, located in F2RL3, with genome-wide significance for lower methylation in smokers (p = 2.68 × 10⁻³¹). This was similarly significant in 316 independent replication samples analyzed by mass spectrometry and Sequenom EpiTyper (p = 6.33 × 10⁻³⁴). Our results, which were based on a rigorous replication approach, show that the gene coding for a potential drug target of cardiovascular importance features altered methylation patterns in smokers. To date, this gene had not attracted attention in the literature on smoking.
Introduction
Epigenetic variations of DNA, particularly the attachment of methyl groups to cytosine bases neighbored by guanine (CpG sites), are an important source of variation and regulation in the genome.1–3 Scientists have only started to unravel the diversity of these modifications with the advent of pertinent high-resolution technologies.2,4 It is assumed that epigenetic variation plays a significant role in complex multifactorial diseases.3 It appears compelling that CpG methylation could account for some of the “missing” heritability not explained by sequence variation,5 but associating methylation with complex phenotypes, especially outside the field of malignancy, has been very difficult.6
Whereas methods for assessing methylation at candidate gene loci and for estimating overall methyl contents of DNA have been available for some time, genome-wide arrays for the study of interindividual variations in methylation patterns with locus-specific resolution have been added to the repertoire of investigators only very recently.7 This development resembles the first establishment of genome-wide SNP arrays, which was a major prerequisite for successfully elucidating the genetic architecture of many complex diseases.8,9 With large numbers of candidate loci being investigated and increasing the danger of false-positive findings, independent replications have been recognized as crucial for ensuring the validity of SNP associations, including those discovered in genome-wide approaches.9–11
Tobacco smoking is a leading cause of disease and premature death.12,13 Through nicotine, it exerts an overwhelming addictive potential,14 and consequently, attempts to quit smoking often fail early on.15 Although the promotion of smoking cessation clearly remains imperative, better understanding the pathophysiological processes linking tobacco smoking and its sequelae could yield opportunities to positively influence disease risk in the large population of continuing smokers.
Alterations in DNA methylation are one possible mechanism potentially mediating the harmful effects of tobacco smoking. Smoking has, for example, been associated with altered global methylation16,17 and differential methylation extent in several cancer-related genes.18,19,20 Whereas the majority of studies have focused on cancer-related issues and cancer-affected populations, a rare comparison of noncancer patients made up of heavy smokers and those who had never smoked (“never smokers”) found candidate gene methylation to be significantly less frequent in the 30 never-smoking subjects.21 Nicotine itself has been shown to influence not only the expression of DNA methyltransferase 1, an enzyme crucial to DNA methylation, but also promoter methylation levels in GABAergic neurons, providing a plausible link to nicotine addiction.22
Given the recent accessibility of genome-wide locus-specific methylation methodology7 and previous support for a role of methylation changes in smoking-related pathologies,16,19,21 we conducted a genome-wide screen for CpG sites that are differentially methylated by tobacco-smoking status in peripheral-blood DNA.
Subjects and Methods
Study Participants, Data, and Sample Collection
Study subjects were selected from participants of the general population-based epidemiological ESTHER study conducted in southwest Germany.23 Eligibility for this methylation study was restricted to participants aged 50–60 years (in order to avoid confounding of our analyses by potential age-related changes in methylation) for whom blood samples drawn at baseline by their general practitioner and mailed to the study center were available; whose smoking status based on standardized self-administered questionnaires could be classified as never having smoked, former heavy smoker, or current heavy smoker; who never smoked tobacco products other than cigarettes; who reported no diagnosis of cancer; and for whom sufficient DNA had been extracted from peripheral blood. Study procedures conformed to the protocol approved by the ethics committee of the University of Heidelberg and the medical board of the State of Saarland. All participants gave written informed consent.
In addition to smoking-related data, alcohol consumption was assessed as part of a standardized self-administered questionnaire (items pertaining to average weekly intake of beer, wine, and liquors, reported in common consumption units and transformed into gram alcohol per week). The body mass index (BMI) was derived from body height and weight measurements recorded by the participant's physician at recruitment.
The smoking phenotypes were defined to maximize the contrast between groups, and current tobacco abstinence was validated by cotinine immunoassay (Immundiagnostik, Bensheim), because smoking behavior tends to be underreported.24 Details of the phenotype definitions and distributions in the 180 subjects examined for the genome-wide discovery round and of the additional 328 subjects used for replication purposes are presented in Table 1.
Table 1.
Characteristics of the Study Populations
| Sample Type | Phenotype | Target N | Assayeda | Women | Men |
|---|---|---|---|---|---|
| Discovery Roundb | |||||
| Heavy smoker | smoking ≥ 20 cigarettes per day at ages 30 and 40 and at enrollment | 60 | 65 | 30 | 35c |
| Former smoker | abstinent for past 10+ years, but smoking ≥ 20 cigarettes per day before | 60 | 56 | 28 | 28 |
| Never smoker | lifetime smoking ≤ 100 cigarettes, never regularly smoking | 60 | 56 | 29 | 27 |
| Total | 180 | 177d | 87 | 90 | |
| Replication Rounde | |||||
| Heavy smoker | as above | 100 | 95 | 41 | 54 |
| Former smoker | as above | 100 | 97 | 36 | 61 |
| Never smoker | as above | 128 | 124 | 51 | 73 |
| Total | 328 | 316 | 128 | 188 | |
Because of the strict demands on phenotypes and availability of DNA, former and current female heavy smokers essentially presented all such ESTHER23 samples eligible in the discovery round (rather than a random subset), whereas in the replication round this was the case for all groups but never smokers and current male heavy smokers.
Peripheral-blood DNA extracted manually by the phenol method.
Including five subjects who were self-reportedly abstinent but had serum cotinine > 10 ng/ml.
One sample excluded before application of the 27K methylation assay, two samples excluded during postassay quality control.
Peripheral-blood DNA extracted with the use of Invisorb kits (Invitek).
Infinium 27K Methylation Assay
For the discovery round, the HumanMethylation27 BeadChip, using Infinium technology25 for genome-wide DNA methylation screening, was employed.7,26 In brief, genomic DNA (500 ng) from each sample was treated by bisulfite conversion with the EZ-96 DNA Methylation Kit (Zymo Research) according to manufacturer recommendations, and subjected to whole-genome amplification. After enzymatic fragmentation, about 200 ng DNA was applied to BeadChips (Illumina).
During hybridization, the DNA molecules anneal to locus-specific DNA oligomers linked to individual bead types. The two bead types correspond to each CpG locus—one to the methylated state and the other to the nonmethylated state. Allele-specific primer annealing is followed by single-base extension using DNP- and Biotin-labeled ddNTPs. After extension, the array is fluorescently stained and scanned, and the intensities of the nonmethylated and methylated bead types are measured. DNA methylation values, described as “beta values,” are recorded for each locus in each sample and represent the ratio of the intensity of the methylated bead type to the combined locus intensity.
Quality control conducted according to manufacturer instructions included assessment of DNP and Biotin staining, hybridization, target removal, extension, bisulfite conversion, G/T mismatch, negative and nonpolymorphic controls, and correlation cluster analysis. The various control procedures supported an appropriate efficiency, sensitivity, and specificity of the individual assay steps without remarkable deviations from optimal performance. Two samples, however, were excluded because of aberrant correlation clustering suggesting specific problems with the sample material of these two individuals.
Sequenom MALDI-TOF Mass Spectrometry
Sequenom MALDI-TOF mass spectrometry (Sequenom) was used in the various replication efforts. In brief, DNA bisulfite conversion was performed by the EZ-96 DNA Methylation Gold Kit (Zymo Research). The bisulfite-specific primers for the PCR aimed at the replication of the main hit of the genome-wide discovery round were 5′-aggaagagagGGTTTATTAGTAGTATGGTGGAGGG-3′ (sense) and 5′-cagtaatacgactcactatagggagaaggctCCCAAACCAAATCTATACCAATAAC-3′ (antisense). Uppercase letters indicate the sequence-specific regions, whereas the nonspecific tags are shown in lowercase letters.
For the additional investigation of methylation patterns in the neighboring region, two additional amplicons were examined (see Figures S1 and S2 available online). These were obtained with the use of the primers 5′-aggaagagagTGGTTAGTAGGGGTAGGAAATAGTTTA-3′ (sense) and 5′-cagtaatacgactcactatagggagaaggctCCTCCACCATACTACTAATAAACCTC-3′ (antisense) for the first amplicon and primers 5′-aggaagagagTTTTTGTTGGTTATGTTGTTGTGTT-3′ (sense) and 5′-cagtaatacgactcactatagggagaaggctCAACCTTCCCCACTTTATATCACTA-3′ (antisense) for the second amplicon.
The PCR products were treated according to the standard protocol (Sequenom EpiTyper Assay) by SAP treatment and T-cleavage reaction. The samples were then cleaned by Resin and were dispensed to a 384 SpectroCHIP by Nanodispenser. The chip was read by a Bruker Autoflex Mass Spectrometer system. Data were collected with the use of SpectroACQUIRE v3.3.1.3 software and visualized with MassARRAY EpiTyper v1.0 software.
Statistical Analysis
Medians and interquartile ranges were used for the description of methylation intensities. A median methylation intensity of 0.83 in smokers, for example, would indicate that in 50% of the smokers a proportion ≤ 0.83 of the individual's DNA was methylated at the respective locus, whereas in the remaining 50% a proportion > 0.83 of the DNA was methylated.
In the discovery round, data were analyzed by modeling the methylation at each individual CpG site as quantified by the Illumina “beta value” by mixed linear regression with sex and smoking stratum (never, former, or heavy smoker) as independent variables and the inclusion of a random batch effect. The overall results were summarized in a –log10(P) versus –log10(rank) plot, in which a straight line would be expected in the absence of any association between methylation extents and smoking behavior.27 Furthermore—because nonnormal distributions were assumed to occur—we also analyzed the data by applying the nonparametric Kruskal-Wallis test for differences in methylation by smoking stratum, analyzing women and men separately. The most significant locus was carried forward for replication.
Because the HumanMethylation27 assay was always applied to groups of 12 samples at a time, we ensured that individuals of both sexes and all three smoking categories were represented in each such batch. Because “batch” thus was not associated with the exposure, sometimes even significant batch effects had very limited confounding potential. For example, the batch effect for the main hit described below had a likelihood ratio test p value of 3.14 × 10⁻⁶ (based on a 1:1 mixture of χ2 distributions with 0 and 1 degrees of freedom28) but its inclusion in the model did not relevantly affect the association of methylation with smoking (Pno batch effect = 1.14 × 10⁻²⁷, Pincluding batch effect = 2.68 × 10⁻³¹).
In the validation and replication analyses based on mass spectrometry data, methylation intensities were analyzed by linear regression adjusted for age and sex and by sex-specific Kruskal-Wallis testing as outlined above.
Because of a lack of prior data on the expected distributions of methylation levels measured by the discovery assay and because it was not clear what would constitute the smallest relevant difference in methylation, no formal sample-size calculations were conducted.
Results
Discovery Round: Illumina 27K Analysis
The 177 subjects successfully characterized in the discovery had a mean ± standard deviation (SD) age of 54 ± 3 years, and 90 (51%) were male (Table 1, top). Of 27,578 CpG sites assayed, 87.6% had complete data, 98.4% and 99.4% had ≤ 1 and ≤ 2 missing values, and only 0.1% had 12 or more missing values. This corresponded to a median of 18 (interquartile range: 10–30) missing values per subject.
Figure 1 shows the distribution of the mixed linear regression p values for each locus for the smoking stratum variable. Only one locus clearly deviated from this pattern (cg03636183 in F2RL3 [MIM 602779]; Psmoking = 2.68 × 10⁻³¹). Note that a conservative adjustment for multiple testing using the Bonferroni method and the standard type I error rate of 0.05 would result in a cutoff for genome-wide significance of p = 0.05/27,578 loci = 1.81 × 10⁻⁶. The same locus reassuringly also showed the most significant group differences on the basis of the Kruskal-Wallis tests (Pmales = 5.75 × 10⁻⁹, Pfemales = 3.08 × 10⁻¹¹; Table 2).
Figure 1.
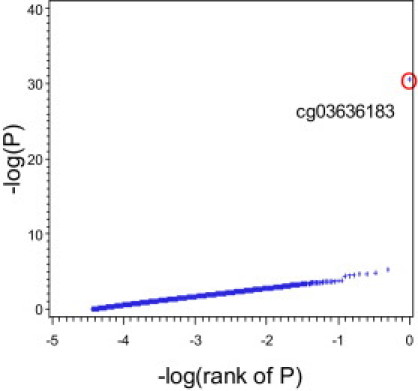
Mixed Linear Regression p Values of the Sex-Adjusted Association of Smoking Status with Methylation Intensities at 27,578 CpG Sites
–log10(P) versus –log10(rank) plot.
Table 2.
Loci that Showed the Most Significant Differential Methylation by Smoking Status on the Basis of the Different Analytical Approaches Taken
| CpG Site | Gene (Chromosome) | Psmoking | p Value Ranksa |
Median (IQR) Methylationb |
||||
|---|---|---|---|---|---|---|---|---|
| Never Smokers | Former Smokers | Current Smokers | ||||||
| Order and Psmoking of Mixed Linear Regression | ||||||||
| cg03636183 | F2RL3 (19p12) | 2.68 × 10⁻³¹ | 1 | 1 | 1 | 0.95 (0.94–0.96) | 0.94 (0.90–0.95) | 0.83 (0.78–0.88) |
| cg19859270 | GPR15 (3q11.2-q13.1) | 4.89 × 10⁻⁶ | 2 | 7 | 83 | 0.93 (0.91–0.94) | 0.92 (0.89–0.94) | 0.89 (0.86–0.91) |
| cg02564523 | ORAI2 (7q22.1) | 1.62 × 10⁻⁵ | 3 | 418 | 9 | 0.21 (0.18–0.23) | 0.21 (0.18–0.28) | 0.17 (0.13–0.20) |
| cg09155905 | FNDC8 (17q12) | 2.00 × 10⁻⁵ | 4 | 8 | 138 | 0.24 (0.21–0.25) | 0.20 (0.16–0.25) | 0.19 (0.15–0.22) |
| cg09084200 | NCAPD3 (11q25) | 2.25 × 10⁻⁵ | 5 | 198 | 2 | 0.15 (0.12–0.16) | 0.13 (0.11–0.15) | 0.11 (0.09–0.14) |
| Order and Psmoking of Kruskal-Wallis Test in Females | ||||||||
| cg03636183 | F2RL3 (19p12) | 3.08 × 10⁻¹¹ | 1 | 1 | 1 | 0.95 (0.94–0.97) | 0.94 (0.92–0.96) | 0.84 (0.78–0.88) |
| cg08504583 | SLAIN1 (13q22.3) | 2.16 × 10⁻⁵ | 8 | 2 | 1343 | 0.59 (0.50–0.63) | 0.64 (0.55–0.69) | 0.69 (0.64–0.75) |
| cg24833277 | FAM83A (8q24.13) | 7.33 × 10⁻⁵ | 389 | 3 | 15,610 | 0.88 (0.85–0.91) | 0.92 (0.88–0.93) | 0.92 (0.90–0.92) |
| cg21919219 | AMY1A (1p21) | 1.01 × 10⁻⁴ | 568 | 4 | 19,056 | 0.83 (0.81–0.84) | 0.85 (0.83–0.86) | 0.83 (0.82–0.84) |
| cg12251508 | RBM3 (Xp11.2) | 1.90 × 10⁻⁴ | 10,720 | 5 | 7405 | 0.49 (0.47–0.51) | 0.45 (0.41–0.48) | 0.44 (0.40–0.48) |
| Order and Psmoking of Kruskal-Wallis Test in Males | ||||||||
| cg03636183 | F2RL3 (19p12) | 5.75 × 10⁻⁹ | 1 | 1 | 1 | 0.95 (0.94–0.96) | 0.94 (0.90–0.95) | 0.82 (0.77–0.87) |
| cg09084200 | NCAPD3 (11q25) | 2.58 × 10⁻⁵ | 5 | 198 | 2 | 0.15 (0.13–0.16) | 0.13 (0.11–0.15) | 0.11 (0.10–0.14) |
| cg18329036 | CRLS1 (20p13-p12.3) | 9.52 × 10⁻⁵ | 132 | 6206 | 3 | 0.03 (0.03–0.04) | 0.04 (0.03–0.04) | 0.03 (0.02–0.03) |
| cg21939482 | C7orf70 (7p22.1) | 1.21 × 10⁻⁴ | 1854 | 15,287 | 4 | 0.02 (0.02–0.02) | 0.02 (0.02–0.02) | 0.01 (0.01–0.02) |
| cg04541293 | PTPRT (20q12-q13) | 1.34 × 10⁻⁴ | 20,878 | 1422 | 5 | 0.16 (0.13–0.18) | 0.19 (0.17–0.25) | 0.13 (0.12–0.16) |
Psmoking value ranks of the mixed linear regression, Kruskal-Wallis tests in females, and Kruskal-Wallis tests in males, respectively.
Values in rows ordered by Kruskal-Wallis tests present medians in only the females and only the males, respectively.
The regression model suggested neither sex differences (Psex = 0.63) nor a smoking × sex interaction (Pinteraction = 0.97) regarding methylation at this locus. Additional adjustment for age (Page = 0.00065), alcohol consumption (Palcohol = 0.99), or BMI (PBMI = 0.32) did not change the results substantially (Psmoking = 3.26 × 10⁻³¹, 6.40 × 10⁻²⁸, and 1.46 × 10⁻²⁹, respectively). As can be seen in Figure 2A and Table 2, the association of methylation with smoking was mainly due to a lower methylation in heavy smokers as compared to never smokers, with former smokers showing a distribution close to the methylation intensities seen in never smokers (Kruskal-Wallis test of never versus former smokers: Pfemales = 0.11, Pmales = 0.011).
Figure 2.
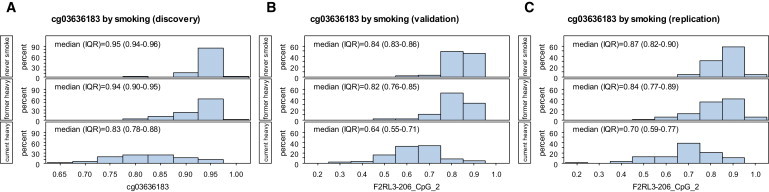
Distribution of Methylation Intensities by Smoking Status at the CpG Site cg03636183 Located in F2RL3
(A) Histograms of “beta values” obtained in the 27K genome-wide screening (discovery measurements).
(B) cg03636183 methylation extent as determined by the Sequenom MassArray, validating the discovery measurements in the same samples.
(C) cg03636183 methylation measured by the Sequenom MassArray in a nonoverlapping replication sample set.
Discovery Round: Sequenom Validation
The differential methylation at cg03636183 was validated by personnel blinded to 27K results and smoking status who reanalyzed cg03636183 and flanking CpG sites in the discovery round samples via the Sequenom MALDI-TOF mass spectrometry method.
The DNA segment of the cg03636183-harboring region of F2RL3 amplified for this purpose and analyzed by MassArray consisted of the sequence 5′-GGTTCATCAGCAGCATGGTGGAGGGCAGCCGAGGTGCCTGCGTGGCCAGCACCCACAGCGCCAGCCCATTGGCCGGCAGCCCCACCACCAGGACCAGCCCATAGAGGGCGGGCACCAGCCTGGTGGGCACCCAGCCCAGAAGCAGTGCCCGTGAGCTGTCCGGGAGCTCCAGGGTGTCACTGTCATTGGCACAGACTTGGCCTGGG-3′. As indicated by the use of underlining, this amplicon contained seven CpG sites overall. The one referring to cg03636183 is written in bold, an aberrant one (that is, less correlated with the other sites; see below) is written in italics, and one site for which methylation levels could not be measured because of too-low mass in the MassArray is written in strikethrough font. Note, furthermore, that the 4th and 6th CpG site were cleaved into fragments with the same mass and we thus could not distinguish them because they yielded a single overlapping signal in the mass spectrometry analysis. Figure 3 provides example mass spectrometry results of cg03636183.
Figure 3.
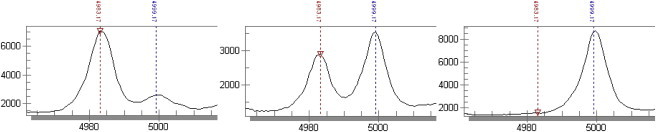
Example Results of the Sequenom MassArray Analysis of cg03636183 Methylation Extents
The graphs show the detection intensity (y axis) of amplicon fragments after base-specific cleavage. The latter results in fragments of different masses (x axis) for originally methylated and nonmethylated CpG sites. The proportion of methylated CpG at this locus can thus be determined by the ratio of detection intensities at masses corresponding to fragments originating from methylated and nonmethylated CpG sites (blue and red vertical lines, respectively). The graphs originating from samples with 17%, 59%, and 98% methylation at cg03636183 (from left to right) show clearly distinguishable peaks.
Methylation at the site corresponding exactly to cg03636183 showed a Spearman correlation of 0.82 (p < 0.0001) with the 27K measurements. Except for the one aberrant site, the CpG loci covered were highly correlated with cg03636183 and among each other (coefficients ≥ 0.72; all p < 0.0001). As can be seen in Figure 2B, the MassArray results featured a wider range than the 27K measurements for this locus, suggesting somewhat different assay dynamics at lower methylation levels, but the overall pattern of group differences with pronounced hypomethylation in current smokers was unambiguously preserved (Psmoking = 1.07 × 10⁻²⁸). Methylation at the other well-measureable loci in this amplicon showed similar associations with smoking (Psmoking ranging from 4.81 × 10⁻²⁷ to 4.81 × 10⁻³¹).
Discovery Round: Neighboring CpG Island Analysis
To gain further insight into the extent of methylation changes at the F2RL3 locus, we analyzed two additional amplicons covering the adjacent CpG island by Sequenom MassArray (Figures S1 and S2), using 79 samples of the discovery study. Only the methylation of the two CpGs most closely located near our main hit (separated from cg03636183 by 41 bp, producing a joint peak in the mass spectrometry) showed a pronounced correlation with cg03636183 (Spearman coefficient = 0.49, p < 0.0001).
Independent Replication Analysis
The same Sequenom MassArray assay used during the validation of the main hit described above was used to analyze 328 nonoverlapping subjects, of whom 316 (96.3%) could be successfully characterized (Table 1, bottom). The mean ± SD age was 55 ± 3 years, and 188 (59%) were male.
The correlation pattern between the loci was similar to that seen in the main-hit amplicon in the discovery samples; i.e., the CpG sites covered were all strongly correlated with each other (all coefficients ≥ 0.50 and p < 0.0001, except those referring to the previously mentioned aberrant site), although the Spearman coefficients were slightly smaller than those in the discovery samples. The pronounced association with smoking status could be confirmed in both the parametric and nonparametric approaches (linear regression: Psmoking = 6.33 × 10⁻³⁴; Kruskal-Wallis: Pmales = 9.20 × 10⁻¹⁴, Pfemales = 2.22 × 10⁻¹²). The distribution of methylation intensities was very similar to that observed in the discovery samples, with heavy smokers showing the lowest levels and never smokers the highest levels (Figure 2C). The distribution seen in former smokers also more resembled the pattern seen in never smokers, although a tendency toward lower methylation intensities was again suggested (Kruskal-Wallis test of never versus former smokers: Pfemales = 0.0026, Pmales = 0.20).
Dose-Response Explorations
In additional analyses, there was a tendency of cg03636183 methylation to decrease with increases in the cumulative amount of cigarette consumption among current smokers in the study (measured in pack years; Spearman coefficient = −0.18, p = 0.031, n = 150) and a tendency for cg03636183 methylation to increase with increasing duration of abstinence in former smokers (Spearman coefficient = 0.10, p = 0.21, n = 152), which was slightly more pronounced for another CpG in the same amplicon (Spearman coefficient = 0.18, p = 0.026; coefficients controlled for sex and study round).
Discussion
The present 27K discovery and replication study of methylation changes according to smoking behavior identified one single locus strongly differentially methylated between exposure groups, a finding fully replicable in an independent, nonoverlapping sample set. Given that the hit was located in a gene of cardiovascular relevance that is being investigated as a drug target,29,30 these results open up a variety of research avenues for future studies.
The locus significantly less methylated in smokers is designated to the coagulation factor II receptor-like 3 gene (F2RL3), coding for protease-activated receptor-4 (PAR4). Intriguingly, this protein has not been discussed or even mentioned in the tobacco smoking literature to date. It has been shown to introduce platelet activation and to affect other cardiovascular functions such as intimal hyperplasia and inflammation,29 all of which are considered plausible mechanisms of smoking-induced pathology.31 Smoking is indeed considered to detrimentally affect clotting through altered endothelial function, platelet adhesiveness and aggregation, and fibrinogen levels.32 Platelet aggregability has interestingly been shown to improve substantially after only 2 weeks of tobacco abstinence, at least in young smokers.33 In this context, future studies need to corroborate the functionality and clinical importance of the differential methylation described here. Given the prominent detrimental role of smoking in public health, it would appear worthwhile to call for large-scale, multidisciplinary and collaborative efforts in this regard, allowing a timely elucidation of the potential emerging from the present finding.
At present, epigenetic studies favor complex bioinformatics and multivariate data analyses of methylation signatures over many loci,34–36 contrasting the dearth of convincingly replicated specific discoveries from genome-wide epigenetic approaches. The findings reported here clearly demonstrate that locus-specific genome-wide methylation studies applying classical statistical tests in a hypothesis-free but strictly stage-wise discovery and replication fashion along the lines of genome-wide SNP studies8 can identify replicable and previously unknown locus-phenotype associations of high biological plausibility. A larger number of affected CpG sites might have been expected on the basis of the less specific associations of smoking with methylation changes reported in the literature,16–20 although it is not immediately clear how these would translate into single CpG signals of genome-wide significance. Future studies with higher assay coverage—balanced with increased sample sizes to improve power despite more extreme multiple testing—might turn up important signals in addition to the single outstanding hit described here.
Whereas it appears unlikely that cell-type-specific methylation differences were responsible for our findings—changes in blood composition would need to be excessively drastic in order to explain the pronounced observation described and probably should have resulted in some lineage-related hits—tissue-specific analyses would be of great interest in the future. The utility of peripheral-blood DNA might have limitations in this regard, but there are precedents in which methylation patterns in such material have been used successfully to distinguish between subjects with or without disease; for example, subjects with or without ovarian34 or breast37 cancer. Also note that, whereas the differential methylation seemed not to reach into the adjacent CpG island, methylation in “CpG island shores” has recently been described as being of particular biological importance.38 In the absence of pertinent data on F2RL3, it remains unclear how or to what extent the rather localized methylation differences described here might affect gene regulation. Future studies certainly should address in detail the functionality of the differential methylation in F2RL3 in terms of expression, as well as tissue-specific aspects thereof.
Common limitations of observational studies include the potential distortion of associations by confounding factors. Arguably, only a confounder very strongly associated with both smoking behavior and locus-specific methylation could result in such a strong signal. Given that sex, age, BMI, and alcohol consumption were addressed through restriction, stratification, or adjusted multiple regression, confounding appears an unlikely—albeit not impossible—explanation for our findings. Smoking nonetheless does not necessarily have a direct effect on methylation at the CpG sites described here, and such an immediate relationship might actually appear rather unlikely given the pronounced and currently inexplicable specificity of the association. Given the assumed role of the gene product for the pertinent biological processes,29 the altered methylation in F2RL3 might also reflect smoking-induced alterations of, for example, the vascular system and platelet function.
In conclusion, the present 27K methylation study employed a simple yet rigorous stage-wise design leading to the discovery of a fully replicable, differentially methylated CpG in F2RL3 associated with smoking behavior. Intriguing perspectives lie in the possibility that epigenetic variability in this gene could be causally involved at a very initial stage of smoking-related cardiovascular pathology through the gene's role in endothelial physiology and platelet activation.29,31 In this case, better understanding of its role might open up avenues for preventing the development of associated disease in subjects unable to give up smoking.
Acknowledgments
This work was funded by the German Research Foundation (Br1704/11-1); Baden Württemberg Ministry of Research, Science and Arts; Marsilius Kolleg, University of Heidelberg; Helmholtz Society; the Dietmar-Hopp Foundation; and BMBF (PB13358). The Institute of Molecular Biology Mainz is funded by the Boehringer Ingelheim Foundation.
Supplemental Data
Web Resources
The URLs for data presented herein are as follows:
Online Mendelian Inheritance in Man, http://www.ncbi.nlm.nih.gov/Omim/
UCSC Genome Browser, http://genome.ucsc.edu
References
- 1.Feinberg A.P. Genome-scale approaches to the epigenetics of common human disease. Virchows Arch. 2010;456:13–21. doi: 10.1007/s00428-009-0847-2. [DOI] [PMC free article] [PubMed] [Google Scholar]
- 2.Lister R., Pelizzola M., Dowen R.H., Hawkins R.D., Hon G., Tonti-Filippini J., Nery J.R., Lee L., Ye Z., Ngo Q.M. Human DNA methylomes at base resolution show widespread epigenomic differences. Nature. 2009;462:315–322. doi: 10.1038/nature08514. [DOI] [PMC free article] [PubMed] [Google Scholar]
- 3.van der Maarel S.M. Epigenetic mechanisms in health and disease. Ann. Rheum. Dis. 2008;67(Suppl 3):iii97–iii100. doi: 10.1136/ard.2008.098392. [DOI] [PubMed] [Google Scholar]
- 4.Suzuki M.M., Bird A. DNA methylation landscapes: provocative insights from epigenomics. Nat. Rev. Genet. 2008;9:465–476. doi: 10.1038/nrg2341. [DOI] [PubMed] [Google Scholar]
- 5.Manolio T.A., Collins F.S., Cox N.J., Goldstein D.B., Hindorff L.A., Hunter D.J., McCarthy M.I., Ramos E.M., Cardon L.R., Chakravarti A. Finding the missing heritability of complex diseases. Nature. 2009;461:747–753. doi: 10.1038/nature08494. [DOI] [PMC free article] [PubMed] [Google Scholar]
- 6.Feinberg A.P. Phenotypic plasticity and the epigenetics of human disease. Nature. 2007;447:433–440. doi: 10.1038/nature05919. [DOI] [PubMed] [Google Scholar]
- 7.Ammerpohl O., Martin-Subero J.I., Richter J., Korn B., Siebert R. Illumina, Inc.; San Diego, CA: 2008. Application note: Genome-wide detection of DNA methylation changes in lymphomas using the Infinium(R) HumanMethylation27 BeadChip. [Google Scholar]
- 8.Hardy J., Singleton A. Genomewide association studies and human disease. N. Engl. J. Med. 2009;360:1759–1768. doi: 10.1056/NEJMra0808700. [DOI] [PMC free article] [PubMed] [Google Scholar]
- 9.Seng K.C., Seng C.K. The success of the genome-wide association approach: a brief story of a long struggle. Eur. J. Hum. Genet. 2008;16:554–564. doi: 10.1038/ejhg.2008.12. [DOI] [PubMed] [Google Scholar]
- 10.Ioannidis J.P., Ntzani E.E., Trikalinos T.A., Contopoulos-Ioannidis D.G. Replication validity of genetic association studies. Nat. Genet. 2001;29:306–309. doi: 10.1038/ng749. [DOI] [PubMed] [Google Scholar]
- 11.Chanock S.J., Manolio T., Boehnke M., Boerwinkle E., Hunter D.J., Thomas G., Hirschhorn J.N., Abecasis G., Altshuler D., Bailey-Wilson J.E., NCI-NHGRI Working Group on Replication in Association Studies Replicating genotype-phenotype associations. Nature. 2007;447:655–660. doi: 10.1038/447655a. [DOI] [PubMed] [Google Scholar]
- 12.Thun M.J., DeLancey J.O., Center M.M., Jemal A., Ward E.M. The global burden of cancer: priorities for prevention. Carcinogenesis. 2010;31:100–110. doi: 10.1093/carcin/bgp263. [DOI] [PMC free article] [PubMed] [Google Scholar]
- 13.Mathers C.D., Loncar D. Projections of global mortality and burden of disease from 2002 to 2030. PLoS Med. 2006;3:e442. doi: 10.1371/journal.pmed.0030442. [DOI] [PMC free article] [PubMed] [Google Scholar]
- 14.Benowitz N.L. Clinical pharmacology of nicotine: implications for understanding, preventing, and treating tobacco addiction. Clin. Pharmacol. Ther. 2008;83:531–541. doi: 10.1038/clpt.2008.3. [DOI] [PubMed] [Google Scholar]
- 15.Hughes J.R., Keely J., Naud S. Shape of the relapse curve and long-term abstinence among untreated smokers. Addiction. 2004;99:29–38. doi: 10.1111/j.1360-0443.2004.00540.x. [DOI] [PubMed] [Google Scholar]
- 16.Furniss C.S., Marsit C.J., Houseman E.A., Eddy K., Kelsey K.T. Line region hypomethylation is associated with lifestyle and differs by human papillomavirus status in head and neck squamous cell carcinomas. Cancer Epidemiol. Biomarkers Prev. 2008;17:966–971. doi: 10.1158/1055-9965.EPI-07-2775. [DOI] [PMC free article] [PubMed] [Google Scholar]
- 17.Smith I.M., Mydlarz W.K., Mithani S.K., Califano J.A. DNA global hypomethylation in squamous cell head and neck cancer associated with smoking, alcohol consumption and stage. Int. J. Cancer. 2007;121:1724–1728. doi: 10.1002/ijc.22889. [DOI] [PubMed] [Google Scholar]
- 18.Enokida H., Shiina H., Urakami S., Terashima M., Ogishima T., Li L.C., Kawahara M., Nakagawa M., Kane C.J., Carroll P.R. Smoking influences aberrant CpG hypermethylation of multiple genes in human prostate carcinoma. Cancer. 2006;106:79–86. doi: 10.1002/cncr.21577. [DOI] [PubMed] [Google Scholar]
- 19.Marsit C.J., Houseman E.A., Schned A.R., Karagas M.R., Kelsey K.T. Promoter hypermethylation is associated with current smoking, age, gender and survival in bladder cancer. Carcinogenesis. 2007;28:1745–1751. doi: 10.1093/carcin/bgm116. [DOI] [PubMed] [Google Scholar]
- 20.Wu J.Y., Wang J., Lai J.C., Cheng Y.W., Yeh K.T., Wu T.C., Chen C.Y., Lee H. Association of O6-methylguanine-DNA methyltransferase (MGMT) promoter methylation with p53 mutation occurrence in non-small cell lung cancer with different histology, gender, and smoking status. Ann. Surg. Oncol. 2008;15:3272–3277. doi: 10.1245/s10434-008-0078-9. [DOI] [PubMed] [Google Scholar]
- 21.Zöchbauer-Müller S., Lam S., Toyooka S., Virmani A.K., Toyooka K.O., Seidl S., Minna J.D., Gazdar A.F. Aberrant methylation of multiple genes in the upper aerodigestive tract epithelium of heavy smokers. Int. J. Cancer. 2003;107:612–616. doi: 10.1002/ijc.11458. [DOI] [PubMed] [Google Scholar]
- 22.Satta R., Maloku E., Zhubi A., Pibiri F., Hajos M., Costa E., Guidotti A. Nicotine decreases DNA methyltransferase 1 expression and glutamic acid decarboxylase 67 promoter methylation in GABAergic interneurons. Proc. Natl. Acad. Sci. USA. 2008;105:16356–16361. doi: 10.1073/pnas.0808699105. [DOI] [PMC free article] [PubMed] [Google Scholar]
- 23.Raum E., Rothenbacher D., Löw M., Stegmaier C., Ziegler H., Brenner H. Changes of cardiovascular risk factors and their implications in subsequent birth cohorts of older adults in Germany: a life course approach. Eur. J. Cardiovasc. Prev. Rehabil. 2007;14:809–814. doi: 10.1097/HJR.0b013e3282eeb308. [DOI] [PubMed] [Google Scholar]
- 24.Rebagliato M. Validation of self reported smoking. J. Epidemiol. Community Health. 2002;56:163–164. doi: 10.1136/jech.56.3.163. [DOI] [PMC free article] [PubMed] [Google Scholar]
- 25.Steemers F.J., Chang W., Lee G., Barker D.L., Shen R., Gunderson K.L. Whole-genome genotyping with the single-base extension assay. Nat. Methods. 2006;3:31–33. doi: 10.1038/nmeth842. [DOI] [PubMed] [Google Scholar]
- 26.Bork S., Pfister S., Witt H., Horn P., Korn B., Ho A.D., Wagner W. DNA methylation pattern changes upon long-term culture and aging of human mesenchymal stromal cells. Aging Cell. 2010;9:54–63. doi: 10.1111/j.1474-9726.2009.00535.x. [DOI] [PMC free article] [PubMed] [Google Scholar]
- 27.Pearson T.A., Manolio T.A. How to interpret a genome-wide association study. JAMA. 2008;299:1335–1344. doi: 10.1001/jama.299.11.1335. [DOI] [PubMed] [Google Scholar]
- 28.Stram D.O., Lee J.W. Variance components testing in the longitudinal mixed effects model. Biometrics. 1994;50:1171–1177. [PubMed] [Google Scholar]
- 29.Leger A.J., Covic L., Kuliopulos A. Protease-activated receptors in cardiovascular diseases. Circulation. 2006;114:1070–1077. doi: 10.1161/CIRCULATIONAHA.105.574830. [DOI] [PubMed] [Google Scholar]
- 30.Wu C.C., Teng C.M. Comparison of the effects of PAR1 antagonists, PAR4 antagonists, and their combinations on thrombin-induced human platelet activation. Eur. J. Pharmacol. 2006;546:142–147. doi: 10.1016/j.ejphar.2006.07.004. [DOI] [PubMed] [Google Scholar]
- 31.Rahman M.M., Laher I. Structural and functional alteration of blood vessels caused by cigarette smoking: an overview of molecular mechanisms. Curr. Vasc. Pharmacol. 2007;5:276–292. doi: 10.2174/157016107782023406. [DOI] [PubMed] [Google Scholar]
- 32.Leone A. Smoking, haemostatic factors, and cardiovascular risk. Curr. Pharm. Des. 2007;13:1661–1667. doi: 10.2174/138161207780831347. [DOI] [PubMed] [Google Scholar]
- 33.Morita H., Ikeda H., Haramaki N., Eguchi H., Imaizumi T. Only two-week smoking cessation improves platelet aggregability and intraplatelet redox imbalance of long-term smokers. J. Am. Coll. Cardiol. 2005;45:589–594. doi: 10.1016/j.jacc.2004.10.061. [DOI] [PubMed] [Google Scholar]
- 34.Teschendorff A.E., Menon U., Gentry-Maharaj A., Ramus S.J., Gayther S.A., Apostolidou S., Jones A., Lechner M., Beck S., Jacobs I.J., Widschwendter M. An epigenetic signature in peripheral blood predicts active ovarian cancer. PLoS ONE. 2009;4:e8274. doi: 10.1371/journal.pone.0008274. [DOI] [PMC free article] [PubMed] [Google Scholar]
- 35.Kanduri M., Cahill N., Göransson H., Enström C., Ryan F., Isaksson A., Rosenquist R. Differential genome-wide array-based methylation profiles in prognostic subsets of chronic lymphocytic leukemia. Blood. 2010;115:296–305. doi: 10.1182/blood-2009-07-232868. [DOI] [PubMed] [Google Scholar]
- 36.Mill J., Tang T., Kaminsky Z., Khare T., Yazdanpanah S., Bouchard L., Jia P., Assadzadeh A., Flanagan J., Schumacher A. Epigenomic profiling reveals DNA-methylation changes associated with major psychosis. Am. J. Hum. Genet. 2008;82:696–711. doi: 10.1016/j.ajhg.2008.01.008. [DOI] [PMC free article] [PubMed] [Google Scholar]
- 37.Widschwendter M., Apostolidou S., Raum E., Rothenbacher D., Fiegl H., Menon U., Stegmaier C., Jacobs I.J., Brenner H. Epigenotyping in peripheral blood cell DNA and breast cancer risk: a proof of principle study. PLoS ONE. 2008;3:e2656. doi: 10.1371/journal.pone.0002656. [DOI] [PMC free article] [PubMed] [Google Scholar]
- 38.Irizarry R.A., Ladd-Acosta C., Wen B., Wu Z., Montano C., Onyango P., Cui H., Gabo K., Rongione M., Webster M. The human colon cancer methylome shows similar hypo- and hypermethylation at conserved tissue-specific CpG island shores. Nat. Genet. 2009;41:178–186. doi: 10.1038/ng.298. [DOI] [PMC free article] [PubMed] [Google Scholar]
Associated Data
This section collects any data citations, data availability statements, or supplementary materials included in this article.