

Abstract
The contribution of balanced chromosomal rearrangements to complex disorders remains unclear because they are not detected routinely by genome-wide microarrays and clinical localization is imprecise. Failure to consider these events bypasses a potentially powerful complement to single nucleotide polymorphism and copy-number association approaches to complex disorders, where much of the heritability remains unexplained. To capitalize on this genetic resource, we have applied optimized sequencing and analysis strategies to test whether these potentially high-impact variants can be mapped at reasonable cost and throughput. By using a whole-genome multiplexing strategy, rearrangement breakpoints could be delineated at a fraction of the cost of standard sequencing. For rearrangements already mapped regionally by karyotyping and fluorescence in situ hybridization, a targeted approach enabled capture and sequencing of multiple breakpoints simultaneously. Importantly, this strategy permitted capture and unique alignment of up to 97% of repeat-masked sequences in the targeted regions. Genome-wide analyses estimate that only 3.7% of bases should be routinely omitted from genomic DNA capture experiments. Illustrating the power of these approaches, the rearrangement breakpoints were rapidly defined to base pair resolution and revealed unexpected sequence complexity, such as co-occurrence of inversion and translocation as an underlying feature of karyotypically balanced alterations. These findings have implications ranging from genome annotation to de novo assemblies and could enable sequencing screens for structural variations at a cost comparable to that of microarrays in standard clinical practice.
Introduction
The primary role of balanced chromosomal rearrangements in disease has been recognized since studies of leukemia more than 30 years ago.1 However, because such rearrangements might not result in large gains or losses of genetic material at the breakpoint, they are usually undetected either by microarray-based genome-wide surveys of genetic variation commonly used in association studies of complex diseases, where much of the heritability remains unexplained, or by diagnostic dosage arrays often used only to assess DNA copy-number changes in the clinical setting. Balanced translocations and inversions are typically identified by low-resolution methods such as karyotyping, but further delineation has been historically limited because of the requirement for labor intensive fluorescence in situ hybridization (FISH), long-range PCR, and Southern blot analysis. Consequently, interpretation of a rearrangement's clinical impact is most often based upon a broad chromosome region, insensitive to the specific gene(s) disrupted, or dysregulated and neglecting the sequence complexity that might underlie these rearrangements. We therefore tested whether innovative high-throughput DNA sequencing strategies could permit precise definition of the molecular changes in subjects with balanced chromosomal rearrangements as a prelude to wide introduction of this approach to define pathogenetic mechanisms in complex neurodevelopmental disorders.
Next-generation paired-end sequencing, which yields millions of paired short reads from the ends of fragments of predetermined size, has been applied to genome-wide detection of structural variation in several recent studies2,3 but has proven to be both expensive and analytically challenging. One study applied paired-end sequencing of 200–400 bp genomic fragments3 to detect numerous somatically acquired rearrangements in cancer cells. The other study identified constitutional structural variations in two individuals by increasing the genomic coverage per read by using a large-fragment jumping library (where fragment ends were separated by 10 kb in the genomic DNA).2 Three other studies have specifically targeted known constitutional translocations and used DNA from a flow-sorted derivative chromosome and/or a large-fragment jumping library.4–6 However, the general accessibility and efficiency of such approaches continue to suffer from both technical and analytical challenges because the capacity to flow sort derivative chromosomes is limited, and the unique properties of jumping libraries have made accurate alignment of sequences problematic and inefficient. For example, in sequencing a translocation in a Wilms tumor patient, Slade et al.6 generated more than 50 million reads, presumably requiring several lanes of an Illumina GAII flow cell at the time of analysis, but were able to map uniquely only 11.6% of reads by using MAQ.7 Similarly, an effort to map two rearrangements with the ABI SOLiD platform generated more than 33 million reads for each but uniquely mapped only 18.7% and 23.4% of these, respectively.8 We therefore reasoned that a robust pipeline of high-throughput methods for library preparation, sequencing, and efficient analysis might enable routine detection of chromosomal rearrangements as well as other types of structural variation breakpoint junctions at a fraction of the cost and effort that has been traditionally required. We have tested and compared our strategies against prior approaches by using a set of 12 individuals with karyotypically balanced chromosome alterations, only one of which (used as a control) has a breakpoint previously defined at the DNA level. We found that such structural variations can be identified precisely and routinely by sequencing at comparable cost to the microarray methods currently used in clinical genetic diagnostic settings for dosage analysis.
Subjects, Material, and Methods
We utilized a range of sequencing methods, from standard insert whole-genome paired end to targeted genomic capture, to identify rapidly balanced rearrangement breakpoint junctions to base pair resolution. Figure 1 provides an overview of the experiments performed.
Figure 1.
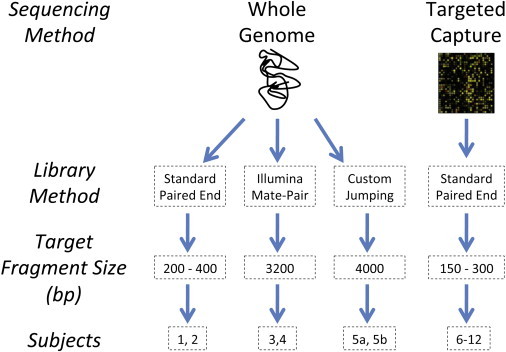
Flow Diagram of Sequencing Approaches
The flow diagram provides an overview of each of the four sequencing approaches taken, the library preparation method, targeted fragment size, and each subject sequenced under a given approach. In sum, we applied three different whole-genome approaches and a CapBP approach to identify balanced rearrangement breakpoints from paired-end sequencing.
Subjects
All subjects had apparently balanced translocations or inversions detected by karyotype analysis and were obtained from several sources, including the Developmental Genome Anatomy Project and the Autism Consortium of Boston. This study was approved by the Institutional Review Board of Partners HealthCare, and all subjects provided informed consent. Subjects for these analyses represent a subset of cases from a larger study intended to characterize the contribution of chromosomal rearrangements to neurodevelopmental disorders. A detailed analysis of the functional impact of these chromosomal rearrangements and the associated phenotypic characteristics will be described at the completion of that ongoing study for the entire cohort being investigated by these techniques. In the testing of potential methodological advances reported herein, we have selected specific cases from each experimental design to illustrate application of these methods to actual human datasets, as well as to provide cost and efficiency comparisons to assess the potential utility of these approaches for detection of structural variation breakpoints in patient populations in both research and clinical settings.
Molecular Methods
Paired-End Sequencing
The DNA library for subject 1 was created by using Illumina Paired-End library preparation kits according to the manufacturer's instructions and for subject 2 by using the NEBNext DNA Sample Prep Master Mix Set 1 (New England Biolabs) for library preparation and Illumina Oligos for adaptor ligation. The use of off the shelf reagents combined with Illumina oligos resulted in approximately 4-fold decrease in library costs (see Table 1). Further reductions can be realized by using custom designed oligos.9 In all experiments described, final libraries were quantified by Pico-Green (Quant-iT, Invitrogen), Agilent Bioanalyzer DNA 1000 kit (Agilent Technologies), and Quantitative PCR (qPCR) analysis with iQ SYBR Green Supermix (Bio-Rad Laboratories). qPCR was performed with primers targeting the Illumina adaptor oligos and an Illumina PhiX sample serially diluted for a standard curve, thereby quantifying only DNA fragments containing properly ligated adaptor oligos required for sequencing. Subject 1 was analyzed on eight lanes of an Illumina GAIIx and subject 2 sequenced on one lane of an Illumina HiSeq 2000. Paired-end 76 cycle sequencing was performed for both subjects.
Table 1.
Estimated Coverage and Cost per Method
| Method | Run | Readsa(Millions) | Cycles | Average Coverage | Library Cost | Seq Cost | Cost per Sample | Standardized Cost per 10x Coverage | Projected Cost per 10× Coverage with HiSeqb |
|---|---|---|---|---|---|---|---|---|---|
| Paired End | GAII | 207.2 | 2×76 | 10.2× | $350 | $20,800 | $21,150 | $20,544 | — |
| Paired End | HiSeq | 96.6 | 2×76 | 4.7× | $90 | $3,280 | $3,370 | $7,069 | $7,069 |
| Ill_Mate-Pairc | GAII | 11.7 | 2×76 | 7.2×d | $350 | $2,600 | $2,950 | $4,231 | $714e |
| Custom_Jump | GAII | 35.1 | 2×40 | 40.7×d | $188 | $1,860 | $2,048 | $645 | $361f |
| Custom_Pool | GAII | 9.0 | 2×40 | 9.3×d | $188 | $620 | $808 | $855 | $361f |
| CapBP | GAII | 16.9 | 2×76 | 42.6× | $660g | $433 | $1,093 | $762 | $680 |
Costs provided based on estimates from core facilities in the Boston area at the time the analysis was conducted. Costs are per sample and limited to library preparation and sequencing, not quantification and validation users might perform. Calculations should be adjusted based on anticipated unique high-quality reads, alignment success, and desired coverage of event of interest. For large insert libraries, cost and coverage are calculated based on the proportion of jumping and nonjumping fragments per design and average insert size for each fragment type. The following abbreviations are used: Ill, Illumina; Custom_Jump, custom barcoded jumping libraries with EcoP15I restriction based on ABI mate-pair sequencing (Applied Biosystems); Pool, a jumping library pooled in a 1:3 dilution; GAII, Illumina GAIIx (Illumina); HiSeq, HiSeq 2000 (Illumina); CapBP, capture of breakpoint sequencing.
Reads obtained for each experiment are highly correlated with sequencing chemistry and hardware upgrades at the time the experiment was run.
Calculation to achieve 10× coverage is based on hypothetical multiplexing that could be performed with 100M unique HiSeq 2000 paired-end reads with similar alignment results as those presented here.
Data for Illumina libraries based on average of datasets from subjects 3 and 4.
Average coverage of inserts spanning read pairs.
Additional modifications required as current protocol does not use multiplexed adapters as sold.
For standardization, costs reflect 40 cycle paired-end sequencing. Barcoded adapters could be combined with 25 cycle paired-end sequencing to further reduce costs.
Library cost for CapBP includes cost of one Agilent 244k array per subject.
Large-Insert Jumping Libraries
Illumina Mate-Pair Sequencing. Libraries with inserts of various sizes ranging from 2 to 12 kb were tested. These experiments used the Illumina Mate-Pair sample prep kit (Illumina) A transition from v1 to v2 of the kits occurred during the course of these experiments. Library creation followed the manufacturer's instructions, and centered around 3–4 kb inserts in these experiments (Illumina). Libraries were quantified as above and run on a single lane of an Illumina GAIIx.
Custom Barcoded Jumping Libraries. This protocol was conceptually based on methods used in the mate-pair library preparation for SOLiD sequencing (Applied Biosystems). Complete reagent lists, protocols, and reaction conditions are provided in the Supplemental Data, available online. In brief, we sheared 20 μg of DNA and size selected to 3.5–4.5 kb. A cap adaptor containing an EcoP15I recognition site and an AC overhang was ligated to the fragment ends. Circularization was carried out by using an internal adaptor containing a GT overhang, a biotinylated thymine, and a six base oligo barcode. Circularized DNA was digested and fragments retained by binding the biotinylated internal adaptor to streptavidin beads. Illumina adapters were ligated and fragments underwent 10–12 cycles of PCR directly on the beads. Samples were quantified as above and paired-end 40 cycle Illumina sequencing performed on an Illumina GAIIx, generating reads containing 25 or 27 bases of genomic DNA, the restriction-fragment recognition site, overhang, and six or four bases from the barcode. Presence of the EcoP15I recognition site and barcode provided certainty regarding the nature of the inserts (i.e., if the fragment spanned the circularization junction). We estimated the impact of obtaining 25 and 27 bp paired-end sequencing compared to 76 bp paired-end data by analyzing the mappability of all possible 24 bp paired-end fragments across the genome compared to 75 bp paired-end fragments by using the CRG alignability track data available in the University of California Santa Cruz (UCSC) genome browser. We found that with 75 bp paired-end reads and 4 kb inserts, 1.29% of the genome is not covered by a mappable insert, whereas 2.74% is not covered with 24 bp end reads and the same 4 kb insert.
Targeted Capture of Breakpoints
Six subjects known by previous cytogenetic analysis to have an apparently balanced chromosomal rearrangement that had already narrowed at least one breakpoint to less than 1 Mb were simultaneously assayed along with a positive control for whom the breakpoint sequence was precisely known. See Table S1 for region and capture statistics.
We designed custom 244k Sure Select microarray chips from Agilent (Agilent), tiling 60-mer probes at 1–3 base spacing across the region of interest. In the positive control, subject 6 (DGAP012),10 the breakpoint sequence was known to be a reciprocal translocation between chromosomes 11 and 19 with a total loss of 11 bases from chromosome 11. As a proof of concept, we targeted probes specifically to a 66 kb region spanning chromosome 19 to determine whether we could capture the chromosome 11 breakpoint sequences without chromosome 11 probes. We then applied the methodology to six experimental subjects. Cytogenetic analyses previously narrowed the breakpoint regions on both derivative chromosomes in three subjects (subjects 8, 9, and 11). For subjects 7, 10, and 12, previous work narrowed one chromosomal breakpoint. Rather than perform additional cytogenetic analysis, we chose to target the known chromosomal region in all three subjects and regions of less than 300 kb on the unanalyzed chromosome for subjects 7 and 12 that might have included the breakpoint sequence but would otherwise serve as control capture regions. For subject 10, we chose to use all probe coverage for only the known breakpoint region as no information was available on the second breakpoint. Probes were designed across the entire region irrespective of repeat-masking algorithms. See Supplemental Data for complete description of library preparation and hybridization processing. According to quality control and quantification procedures, all samples were brought to equimolar concentration and pooled together in a single tube without indexing. Sequencing was performed by using paired-end 40 cycle (screen) and 76 cycle (experiment) modules.
Bioinformatics
We first established a standardized pipeline for routine detection of balanced rearrangements in all cases, and then developed custom programs to identify reads suggestive of specific genomic events that would not be detected in our standard analyses. See Supplemental Data for complete details. We refer to read pairs in which the insert between reads crosses a rearrangement breakpoint as gap reads and read pairs in which one of the read pairs sequences across the breakpoint as split reads. In all analyses, sequencing reads were analyzed by using multiple publicly available alignment methods and custom scripts, each tailored to the specific experiment, including MAQ,7 BWA,11 Arachne,12 Novoalign (Novocraft), and SSAHA2.13 After data filtering, BAM files were processed by a C++ program, Bamstat, developed to tabulate mapping statistics and output lists of anomalous read pairs (defined as having ends that map to two different chromosomes, having an abnormal insert size, or unexpected strand orientations). Anomalous pairs were clustered by their mapped location with readPairCluster, which performs a single-linkage clustering of paired-end reads if corresponding ends map within a specified distance (e.g., less than 10 kb) of each other.
All reads that could not be aligned by the above methods underwent two types of secondary alignments to identify either gap reads in repetitive regions or split reads crossing rearrangement breakpoints. First, we accounted for rearrangements in repetitive regions by aligning unaligned reads with SSAHA2,13 generating all possible local alignments in the genome, and then filtered for those multiply aligned read ends that were from a fragment whose opposite end read was anchored by a single unique alignment (e.g., where one of the two ends could be unambiguously placed). Next, we identified all fragments where one or both paired-reads failed to align and developed a program in a newly constructed C++0x bioinformatics framework (M. Borowsky and T.K. Ohsumi, unpublished) to search for split reads. The program aligned the first N bases and last M bases of each end read independently, thus creating four distinct alignments per read pair, outputting uniquely aligned reads, then adding a single base (N+1 and M+1) to each end of all remaining reads. This procedure was continued iteratively until one or both pieces of each read aligned; then the four fragments of a given read pair were rejoined. In theory, any single read that crossed a junction point on one end should be confirmed by a paired end in which at least a portion of the read predictably aligned to a precise expected location within the size of the insert, accommodating for any gain or loss of DNA. The program exhaustively aligns fragment ends but is computationally expensive.
Pileup data over repeat-masked elements was based on the UCSC genome browser tables. The UCSC RepeatMasker track was downloaded for the NCBI36/hg18 build of the human genome. An R script searched through the table and correlated it to pileup data of single end reads in the targeted regions. Pileup statistics were calculated by using samtools 0.1.8 on alignments generated by the BWA software.11,14 For each base in a given repeat-masked element (e.g., Long Interspersed Nuclear Element [LINE], Short Interspersed Nuclear Element [SINE], etc.), the script recorded the number of reads with MapQ score ≥ 20 that piled up over that base. The unmappable targeted region for subject 8 was not included in the statistics. Graphs were generated with the R statistical software package.
The Genome Mappability Surveyor (GMS) was designed to establish a theoretical upper bound on the number of bases in a genomic region that can be uniquely aligned to the reference genome, alerting the user if a region is unmappable because of highly repetitive or duplicated sequence. See Supplemental Data for complete details. It harnesses the CRG Alignability tracks from the UCSC genome browser for mappability statistics, recording how many k-mers in a region map uniquely (allowing up to two mismatches over read-length k) to their position in the genome. The k-mer mappability section of the program's output shows the number of k-mers (fragments of the specified read-length) in the region that can be uniquely aligned to the reference genome. For each base in the region, the k-mer is the sequence fragment that includes the base and the k − 1 bases to its right. If a uniquely mappable read lies within k bases upstream of the base, then the base is “covered” by the mappability of the adjacent k-mer. The software can also determine the mappability of a region by using a paired-end library. The mappability statistics included in this paper refer to the mappable percentage of sequenced and placed contigs in GRCh37/hg19, excluding runs of DNA where the reference sequencing is unknown. The GMS, as well as all programs and scripts developed in these experiments, is freely available for download (see Web Resources).
Results
We first performed whole-genome standard paired-end sequencing and Illumina Mate-Pair sequencing of large inserts, that is, jumping libraries, as a baseline for comparison to assess the efficiency and cost of identifying chromosomal breakpoints by using current approaches. Depending upon the prior information available for each subject, we developed different but related strategies to detect rearrangement breakpoints and tested these in comparison with the standard whole-genome approaches already available. Given the rapidly growing capacity of next-generation sequencing, the analysis date for each experiment is provided. Table 1 provides cost estimates and standardized coverage comparisons across all approaches.
Whole-Genome Paired-End Sequencing
We analyzed two subjects whose reported karyotypes were 46,XY,t(9;16)(q22;p11) (subject 1) and 46,XY,t(3;6)(q26.2;q16.2) (subject 2). The first was analyzed in the summer of 2009 with Illumina GAIIx technology, whereas the latter was studied one year later (August, 2010) on an Illumina HiSeq 2000.
For subject 1, sequencing eight lanes generated 207.2 million read pairs. On average across lanes, 91% of reads were aligned, yielding approximately 10.2× physical coverage of all nucleotides. Reads supporting a translocation event were identified by isolating reads straddling a translocation breakpoint (referred to here as gap read pairs) or reads crossing the breakpoint (split reads). The translocation was well covered by 20 read pairs, including 12 gap read pairs and eight split reads, enabling base pair resolution of the rearrangement (Figure 2). The sequencing karyotype was revised (changes are bold in the nomenclature) to 46,XY,t(9;16)(q22.33;p12.1).
Figure 2.
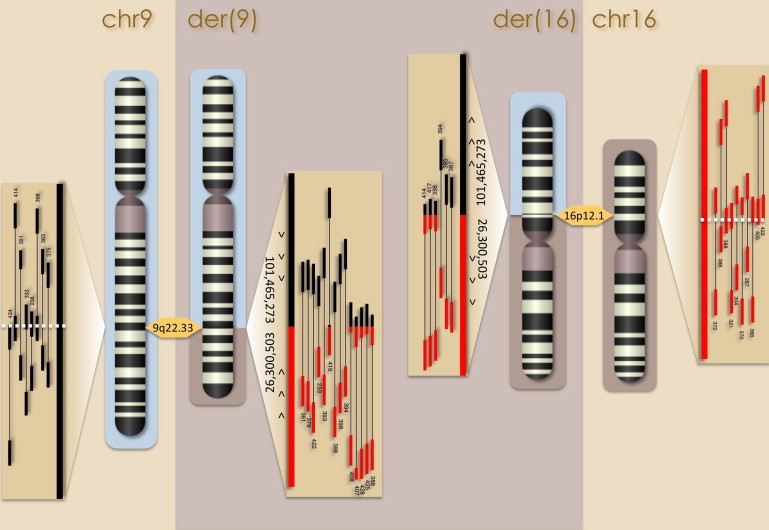
Translocation Sequencing Results for Subject 1
Sequencing eight lanes generated 207.2 million read pairs, yielding 10.2× physical coverage of all nucleotides after alignment of 91% of reads. Translocation breakpoints for each derivative chromosome were resolved to base pair resolution with 20 supporting read pairs, including 12 gap reads straddling the translocation breakpoint and 8 split reads crossing the translocation breakpoint sequence.
A single lane of HiSeq 2000 generated 96.6 million read pairs for subject 2, of which 93.3% were uniquely aligned yielding 4.7× base coverage. The rate of chimeric pairs, that is, end-reads mapping to two different chromosomes, was low and ranged from 0.03%–0.54% between lanes of standard libraries. Translocation breakpoints were resolved from five reads. The sequencing karyotype was revised to 46,XY,t(3;6)(q26.32;q16.3).
These analyses confirmed the feasibility of using standard paired-end sequencing to detect genomic rearrangements and, importantly, revealed the need for revision of the assignments of chromosomal breakpoints relative to the standard karyotyping assignments. Over the course of a year, the cost of the strategy decreased substantially from over $20,000 because of advances in sequencing hardware but was still relatively costly at over $7,000 to achieve 10× base coverage (Table 1).
Large-Insert Jumping Libraries
We sought to increase genome coverage of the insert between gap reads by creating large-insert jumping libraries. For these libraries, DNA fragments of predefined size are circularized around a linker and then sheared to produce fragments in which the linker is flanked by the genomic DNA from the ends of the original fragment, in reverse orientation to each other relative to the genome.2 We tested Illumina Mate-Pair sequencing on two individuals by using a targeted insert size of 3.2–3.8 kb. In the spring of 2009, we attempted to map a pericentric inversion of chromosome 5, 46,XX,inv(5)(p12q13.1) (subject 3) and an apparently balanced reciprocal translocation 46,XY,t(6;9)(q16.2;q13) (subject 4) on a single lane of an Illumina GAIIx.
Sequencing for subject 3 generated 10,244,887 reads and 90.3% of all pairs were uniquely aligned with a 1.3% of all pairs being chimeric. As expected, we observed a bimodal distribution of insert sizes with 22.2% of mapped reads representing 250–500 bp linear nonjump fragments (so called inward facing reads) (Figure 3). The presence of contamination by these nonjump fragments is a common problem in the Illumina Mate-Pair protocol that significantly decreases genomic coverage. The chromosome 5 inversion was detected by five independent gap read pairs in a same strand orientation separated by more than 10 megabases (Mb). The revised karyotype, 46,XX,inv(5)(p14.2q14.3), differed substantially from the cytogenetic interpretation and would have required extensive follow-up to localize by traditional methods (Table 2) (Figure S1). Given the large discrepancy, we performed FISH analysis for this case in addition to the standard PCR and Sanger sequencing validation, confirming the sequencing results.
Figure 3.
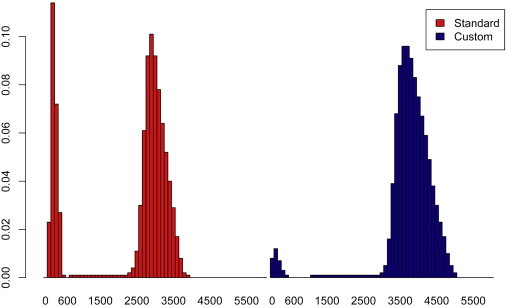
Insert Size Distributions for Large Insert Library Methods
The distribution of insert sizes for subject 3 (left panel in red), created by using the published Illumina Mate-Pair kit with initial fragments size selected at approximately 3 kb. The figure shows a bimodal distribution typical of this technique, representing fragments that cross the circularization junction (outward facing reads) and fragments of contiguous DNA that were biotinylated and retained but do not cross the circularization junction (inward facing reads). In this subject, 77.8% of all reads were outward facing. For subject 4 (not shown) only 45.4% of all aligned pairs were separated by large inserts. The proportion of outward facing reads can vary substantially based on a number of factors, including DNA quality. The insert size distribution for subject 5a (right panel in blue), created by our custom method based on the mate-pair method for SOLiD sequencing (Applied Biosystems) with modifications including insertion of a 6 base subject specific barcode. The method resulted in 99.3% of all aligned read pairs being separated by large inserts for this subject.
Table 2.
Revised Karyotypes from Whole-Genome Sequencing
| Subject ID | Clinical Interpretation | Revised Karyotype from Sequencing | Diagnosis |
|---|---|---|---|
| 1 | 46,XY,t(9;16)(q22;p11) | 46,XY,t(9;16)(q22.33;p12.1) | Autism spectrum disorder |
| 2 | 46,XY,t(3;6)(q26.2;q16.2) | 46,XY,t(3;6)(q26.32;q16.3) | Autism spectrum disorder |
| 3a | 46,XX,inv(5)(p12q13.1) | 46,XX,inv(5)(p14.2q14.3) | Global developmental delay, hypotonia, seizures |
| 4 | 46,XY,t(6;9)(q16.2;q13) | 46,XY,inv(6)(q16.1q16.1)t(6;9)(q16.1;q21.3) | Autism spectrum disorder |
| 5a, b | 46,XY,t(3;18)(q13.3;q21.3) | 46,XY,t(3;18)(q13.32;q21.2) | Global developmental delay, multiple congenital anomalies |
Karyotype analyses for each subject included in whole-genome sequencing. Karyotyping was performed at various sites, including referring clinics. In all subjects, a revision to the clinical interpretation was required after sequencing. Subjects included in the CapBP experiment were required to have cytogenetic analyses that previously localized the breakpoint to less than one megabase, so further revision was not necessary.
Subject is DGAP218, see Developmental Genome Anatomy Project (Web Resources).
Sequencing for subject 4, 46,XY,t(6;9)(q16.2;q13), generated 13,214,065 read pairs. Just 45.4% of aligned read pairs were large inserts, and this library had the highest background chimera rate (3.38%). Still, we initially identified three closely mapping chimeric read pairs in the expected orientation for the derivative chromosome 6, der(6). Further scrutiny of chimeric pairs identified an intriguing cluster of four pairs that suggested an additional rearrangement; all four chromosome 9 reads clustered near the initial three read pairs, but the chromosome 6 ends clustered to a region 177 kb telomeric to the initial chromosome 6 reads. These were not identified initially because both ends were in an unexpected same strand orientation, indicative of an inversion at the breakpoint on the der(9). Junction fragments from both derivative chromosomes were PCR amplified and Sanger sequenced, confirming the canonical and inverted orientation of the der(6) and der(9), respectively. We amplified and sequenced the distal breakpoint for the inversion, as predicted from the sequencing reads, and confirmed the presence of a 177,352 base inversion event at the breakpoint. Neither the translocation nor the inversion was present in either parent, indicating that they both are de novo events that probably co-occurred. In addition to the unexpected complexity of the rearrangement, which underlines the need for comprehensive bioinformatics to analyze these events, the revised karyotype, 46,XY,inv(6)(q16.1q16.1)t(6;9)(q16.1;q21.3), was again substantially different from the reported clinical karyotype.
Despite the relatively low coverage, these experiments successfully mapped two rearrangements, each on a single lane of a GAIIx (Illumina), at a cost of roughly $3000 per breakpoint by using published methods. However, our overall experience with subjects 1–4 indicated two major areas for potential improvement to reduce the cost and increase the efficiency of breakpoint identification: (1) development of a standardized, robust bioinformatic analysis pipeline, and (2) reduction in contamination of jumping libraries with nonjump fragments. We therefore implemented a set of bioinformatic tools to search for split reads among pairs that initially failed alignment (see Subjects, Material, and Methods) and developed a jumping library strategy designed to retain only large insert fragments that can be unambiguously identified, maximizing genomic coverage and permitting multiplexing in sequence analysis.
Custom Barcoded Jumping Libraries
The notable contamination of large-insert jumping libraries with short insert nonjump fragments significantly reduces coverage of the library, decreasing its effectiveness for application to chromosomal rearrangements and also complicating its use in de novo assembly efforts. The custom jumping library protocol developed for these studies (see Subjects, Material, and Methods), which results in a predictable sequence at the 3′ end of each sequence read, was tested with subjects 5a and 5b, identical twins with a clinical karyotype of 46,XY,t(3;18)(q13.3;q21.3). A large-insert jumping library from subject 5a was sequenced individually to determine the efficiency of the method, and then an equivalent library from subject 5b was pooled with DNA from an unrelated individual in a 1:3 dilution to test the capacity for multiplex analysis of multiple subjects in a single flow cell lane. Paired-end 40 cycle sequencing was performed in the summer of 2010.
Sequencing for subject 5a generated 35,077,831 reads. After identifying the restriction site and barcode, our pipeline aligned 96.4% of reads (1.49% chimeric pairs). Only 0.7% of all properly paired reads were from nonjump fragments, producing an average insert of 4,035 bases or an estimated physical genomic coverage of 40.9× (Figure 3). The translocation event was easily isolated as 32 gap reads were found containing inserts crossing the breakpoint. In the pooled experiment, the dilution performed as expected with 35.6% (8,978,984 pairs) of all reads containing the barcode for subject 5b. We again found that 99.4% of mapped pairs were separated by large inserts, resulting in 9.25× physical coverage of the genome from the 1:3 dilution. The translocation was detected with 14 supporting reads (sequencing karyotype 46,XY,t(3;18)(q13.32;q21.2)).
This custom jumping library method, in combination with the optimized analytical pipeline, allows translocations to be detected individually or in pools of individuals, resulting in costs less than the targeted $1000 per breakpoint with the Illumina GAIIx platform. We anticipate further reductions in conjunction with yet higher multiplexing potential based on the current throughput of the HiSeq 2000, which would yield a cost per breakpoint on the order of $500 or less (Table 1). It should also be noted that the use of barcoded adapters enables multiplexing with paired-end 25 cycle modules, further reducing sequencing costs.
Capture of Breakpoints
To enable high-throughput detection of structural variations for the many available clinical and research cases in which initial karyotypic analysis has been followed up by FISH mapping to narrow the region of the breakpoint, we designed and tested a targeted DNA capture strategy. This approach requires the capture and sequencing of an unknown junction fragment from a contiguous target region and is therefore potentially complicated by the presence of repetitive elements, which are often eliminated in the probe design phase of both solid phase and in-solution capture experiments.15–17 This is an important consideration because repetitive sequences can mediate chromosomal rearrangements. However, on the basis of our “mappability” calculations (see below), we hypothesized that a significant proportion of regions identified as repeats could be successfully captured, sequenced, and uniquely aligned to the genome. To test this method, we first analyzed one chromosomal region in a positive control with a precisely known translocation breakpoint previously published (DGAP012)10 (subject 6: 46,XY,t(11;19)(p11.2;p13.3)). We then simultaneously analyzed six subjects with at least one chromosome breakpoint regionally mapped (<1 Mb) by previous FISH analysis (subjects 7–12, Table S1). Samples were sequenced together on a single lane of a GAIIx in the spring of 2010.
For the proof-of-principle experiment, we designed a custom tiled solid phase capture array (Agilent Technologies) covering 66 kb of chromosome 19 from the region of the DGAP012 breakpoint. We tiled all bases in this region, ignoring repeat-masking algorithms, but included no probes from the chromosome 11 breakpoint region. We used the array to capture genomic DNA from DGAP012 and then PCR amplified and Sanger sequenced the t(11;19) junction fragments, indicating that these were retained because of the chromosome 19 capture probes. On the basis of these results, we applied the same array capture method to subjects 7–12. Two chromosomal target regions were captured for each of five subjects, though FISH mapping had narrowed the breakpoint region unambiguously for just three of these subjects (see Subjects, Material, and Methods); only one region was captured for subject 10. Captured libraries from all seven subjects were pooled at equimolar concentration without indexing for an initial quality test by single-end 40 cycle sequencing, which revealed good coverage for all targeted chromosome regions but one (subject 8, see below). The test also yielded two split reads that crossed the translocation breakpoint for the positive control (subject 6), directly confirming that junction fragments can be successfully captured and sequenced.
We next performed paired-end 76 bp sequencing of the six experimental subjects, omitting the positive control (subject 6), on a single lane of an Illumina GAIIx. The average targeted region was 440.3 kb per sample. All regions except chromosome 5 of subject 8 were included in subsequent analyses. For subject 8, reads were successfully captured and aligned to the genome, but the targeted 86.9 kb 5q13 region was part of a large, complex block of segmental duplication known to mediate chromosome rearrangements (including the SMA4 gene). This prevented unique mapping of most bases in the region. In sum, 93.6% of all bases in all other regions mapped to the reference. Full coverage statistics are provided in Table S1. Given the average size of the captured fragments (∼180–200 bp), generating 152 bp of sequence (paired-end 76 bp reads) for each fragment results in very small inserts between read ends. We therefore anticipated that analysis of split reads crossing the breakpoint would provide the greatest yield. Upon filtering reads through our analytical pipeline, we successfully identified multiple split reads crossing translocation breakpoints from captured DNA in four of the experimental cases (subjects 8–11), as we had in the positive control (subject 6). Sufficient reads (6 to 36) were obtained to map the breakpoints of both derivative chromosomes to single base resolution for subjects 9–11. Subject 10 had the highest number of supporting reads, suggesting no capture performance decrement from targeting only one chromosome for this subject. In subject 8, despite the complex nature of the chromosome 5 repeat, we precisely identified the junction fragment sequence and localized the chromosome 7 breakpoint. Subsequent Sanger sequencing indicates that the chromosome 5 region can be unambiguously placed by the presence of two SNPs peculiar to only one of the five repeats from the reference genome. Breakpoints were not identified in two cases (subjects 7 and 12), where only one breakpoint was effectively targeted. Subsequent whole-genome analysis has identified breakpoints for both subjects in regions not targeted on the array, confirming that the breakpoint had been misplaced by the FISH experiments.
General Implications for Targeted Capture and Genomic DNA Sequencing
The success of the targeted capture of breakpoints (CapBP) method for identifying regionally mapped translocations via tiling arrays that include repetitive sequences has wider implications for other types of genomic studies that utilize DNA capture. Consequently, we specifically addressed a series of questions raised by this approach. (1) Can repetitive DNA identified by RepeatMasker18 be captured and uniquely mapped in the human genome? (2) What are the sequence characteristics that predict successful capture and alignment of repeat-masked DNA? (3) What proportion of bases that do not uniquely align in targeted regions by single end alignment, and by extension in the genome as a whole, can be recovered through paired-end alignment? (4) Can this be predicted in advance by surveying the “capturability” and “mappability” of repeat sequences in the genome? (5) What proportion of genomic events theoretically can be detected by having a large insert between ends of a jumping library of varying sizes?
The experimental regions used for CapBP had a combined target size of 2,528,280 bases, 50.05% (37.0% to 60.2% by region) of which were flagged as repetitive by RepeatMasker18 (Figure 4A). The largest fraction of repeat-masked DNA was LINE elements (24.17% of targeted bases), then SINEs (12.60%) and long terminal repeat elements (LTRs) (9.0%). All other repetitive elements individually comprised less than 5% of the total bases. In our capture experiments, on average 97% of unmasked bases and 86.8% of repeat-masked bases were covered by uniquely aligned reads, and over 90% of repeat-masked bases covered by unique reads in seven of the ten regions were evaluated (Figure 3). The highest fraction of uniquely aligned repeat-masked bases was in LTRs (98.7%), which aligned slightly better than unmasked DNA (96.8%). LINE elements were lowest, but still aligned uniquely at an average of 79.8% (Figure 4C). Median read depth for unmasked DNA was 43×, whereas read depth for masked DNA ranged from 9× (LINE) and 14× (SINE) to 46× (LTR) (Figure S2).
Figure 4.
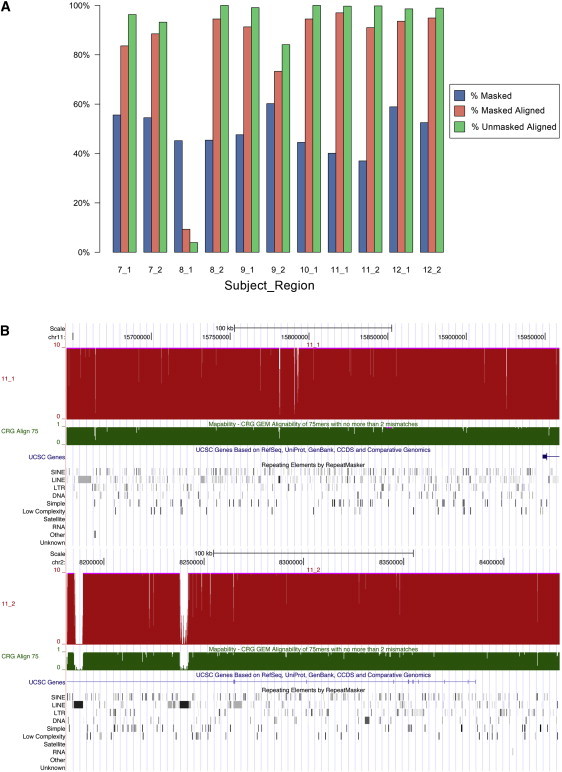
Coverage of Targeted Regions in CapBP
(A) Overview of coverage for the targeted capture experiment in each of the regions. For all regions, the percentage masked represents the percentage of bases annotated as repeat sequence in the Agilent Sure Select pipeline based on RepeatMasker;18 percentage masked aligned is the percentage of those repeat-masked sequences we were able to align uniquely, and percentage unmasked aligned is the percentage of bases not denoted as repeat masked that were uniquely covered by sequencing reads.
(B) Representative coverage for one of the samples provided in the UCSC browser (subject 11, regions 1 and 2). See Figure S2 for complete details of all subjects.
Overall, our analyses predict that the vast majority of bases in a given region can be captured and uniquely aligned, but that regions heavily composed of LINEs might show a decrement in capture alignment performance. Therefore, a general “mappability” score (i.e., the alignability of a given k-mer in the genome) could be a more useful predictor of capture success than RepeatMasker (see Figure 4B for the example of subject 11). Consequently, we developed a web-based tool, Genome Mappability Surveyor (GMS), which establishes a theoretical upper bound on the number of bases in a genomic region that can be uniquely aligned to the reference genome. We predicted that only 3% and 1.5% of all targeted bases in our experiment would theoretically be impossible to align uniquely with single-end and paired-end 76 bp sequencing, respectively, suggesting an upper bound of 98.5% aligned bases in a perfectly efficient paired-end capture experiment. By contrast, 50% of bases in our targeted regions would have been eliminated at the probe design stage had we omitted repeat-masked DNA. Empirically, we observed that 91.8% of all bases could be covered by a uniquely aligned read in our capture and sequencing experiments, results that are comparable to our mappability predictions for the entire human genome (defined here as placed contigs in GRCH37/hg19), for which we predict that 96.3% can be covered by a uniquely aligned read, and a lower bound of about 90.9% on chromosome 9 was predicted (Figure 4D).
The predicted mappability of the genome is further increased in paired-end sequencing by the use of jumping libraries because the ability to place reads is slightly increased by having a paired read at a greater distance than a standard insert library (96.9%, 98.3%, 98.2% mappability at 1 kb, 10 kb, and 30 kb inserts, respectively, with 75 bp paired-end reads). Of greater import for the detection of genomic rearrangements, the paired-end sequencing of jumping fragments is predicted to have a greater overall potential for localizing rearrangement breakpoints (from 97.33% of all bases covered by 1 kb jumping inserts to 99.43% of bases covered by 10 kb jumping inserts [Figure 4E]) than is the standard paired-end sequencing of small genomic fragments (96.3% of all bases covered). Increasing insert sizes to 30 kb by using alternative strategies, such as fosmids, can theoretically yield 99.79% insert coverage of all bases despite the 3% unmappable calculations above.
Discussion
Balanced chromosome rearrangements represent both clinical diagnostic quandaries and experimental opportunities. Clinical interpretation of an abnormal karyotype for the subject's family most often involves an uncertain prognosis, as there is little that can be predicted from the rough regional localization of an apparently balanced karyotypic breakpoint. However, as such rearrangements can be associated with significant phenotypic abnormalities, these “experiments of nature” can potentially offer a unique window into the role of the disrupted genes in human development and disease. Our findings indicate that, with optimization of library preparation and streamlined bioinformatic analysis, delineation of balanced chromosome rearrangements to base-pair resolution is feasible at a reasonable cost and throughput to address both of these issues.
In these experiments, both the multiplexed whole-genome and CapBP methods resulted in the identification and sequencing of breakpoints for approximately $1100 and $800 per subject with an Illumina GAIIx, a cost certainly applicable to high-priority research subjects. As highlighted in Table 1, on the basis of both the specifications of the newer HiSeq 2000 analyzer and our own experience with this technology, we expect that the cost per subject for 10× or higher coverage can be dramatically reduced to less than $500 per sample. This is cost competitive with microarray analyses currently recommended in clinical practice19,20 but with the sensitivity to uncover chromosomal rearrangements that might account for clinical features from otherwise normal microarray findings.
The potential of this technology for improving the molecular diagnostic information available to clinical geneticists is also evident in our findings. The relatively low resolution of karyotyping results in an assignment of a breakpoint to a chromosome band or subband that often proves to be misplaced upon molecular analysis. Indeed, for all of the subjects whose breakpoints were defined by whole-genome sequencing, the result was a reassignment of the breakpoint by subband or, in the case of subject 3, to entirely different chromosomal bands. In addition, sequence analysis might reveal relevant complexity unsuspected from karyotyping or subsequent FISH mapping studies. Although FISH or microarray analysis can sometimes identify genomic deletions that are not evident from the apparently balanced karyotype, our discovery in subject 4 of a coincident inversion that disrupts additional genetic sequences in a balanced manner both at the translocation breakpoint and a distance of almost 200 kb from the breakpoint indicates that molecular definition of the rearrangement could reveal multiple genetic effects of clinical diagnostic relevance. Consequently, accurate clinical interpretation of such apparently balanced karyotypic abnormalities will require both a delineation of the nature of the molecular rearrangement(s) involved and a cumulative annotation of the genome with respect to disruption of human genes from a variety of genetic studies.
Detailed research analysis of subjects with apparently balanced chromosome abnormalities and the specifically associated phenotypes (or lack thereof) that they display are invaluable contributions to annotation of the human genome. Our findings increase the accessibility of this uniquely informative population to genetic study and indicate that systematic mapping of gene disruptions in humans to uncover genes important to development and disease, as well as to identify those genes for which functional hemizygosity produces no deleterious consequences, is feasible in a cost effective manner. Either the whole-genome approach of jumping libraries or the CapBP strategy for regionally localized breakpoints can be effective in this regard. Further scrutiny of the capture data suggests significant complexity for some cases. One of the targeted regions for subject 8 was a complex repeat that was impossible to localize by direct sequence alignment, yet was successfully interpreted through careful bioinformatic analysis. For the two subjects for whom the junction fragment was not identified, a subsequent aCGH analysis revealed large deletions on both chromosomes 2 and 6 near the putative breakpoints for subject 12, and whole-genome sequencing has subsequently determined the actual translocation breakpoints for both subjects 7 and 12, revealing that in each case the breakpoint had been misplaced by FISH and was actually outside of the region targeted for capture. Accounting for complexity such as this can be difficult, suggesting that the whole-genome jumping library approach currently represents the most effective strategy. However, as sequencing capacity and capture methods continue to improve, it is conceivable that direct chromosome arm-level capture from the initial karyotype could soon become an effective standardized method for rapid breakpoint identification.
Significantly, the CapBP analyses reveal two important general findings of relevance for future genomics experiments. First, they show that nontargeted DNA can be captured by using tiled probes over a span of DNA. This has implications for the precise identification not only of balanced rearrangements but also of structural variations of all classes, as well as for identification of insertion sites of foreign elements such as viruses and transposons, or the insertion sites of exogenous genes in transgenic animals or transfected cells. A comparison with previous analyses to capture structural variations in population-based samples suggests that generating high read depth and paired-end sequencing, even of shorter reads, is preferable to single-end long reads at a lower depth.21 A review of Table 1 suggests that as multiplexing increases, the cost of the capture step per individual is higher than the sequencing itself. Recent analyses reveal that multiplexing at the capture level is feasible and could significantly reduce the overall cost of the method.22 Second, the CapBP experiments show that even small 60-mer solid phase capture probes can bind to a range of different DNA fragments, including those often excluded as repetitive sequence elements, and that these can be uniquely mapped to the genome. In subsequent experiments, we have implemented a further improvement in the CapBP strategy by capturing larger DNA fragments with higher specificity with Agilent in-solution 120-mer RNA baits (Agilent) (M. Talkowski, unpublished data). In our targeted regions, up to 97% of sequences traditionally excluded because of repeat-masking algorithms could be captured and uniquely aligned. Our genomic analysis indicates that approximately 96% of the annotated genome is theoretically mappable either by direct paired-end alignment or by anchoring one of the paired ends to a unique genomic position, enabling unambiguous mapping of the opposite end. Moreover, we find that jumping libraries can survey over 99% of the genome with a mappable large insert (Figure 5E), highlighting the potential of such libraries to aid in de novo assemblies of some repetitive regions or close gaps in current assemblies. The use of even larger inserts, such as 10–50 kb, could further aid in this effort. Thus, the CapBP studies indicate that the commonly applied limitation of DNA capture technology to the ∼50% of the genome comprised of unique sequences is an unnecessary constraint that can hinder the comprehensive discovery and analysis of genetic mutations and genomic rearrangements in human disease.
Figure 5.
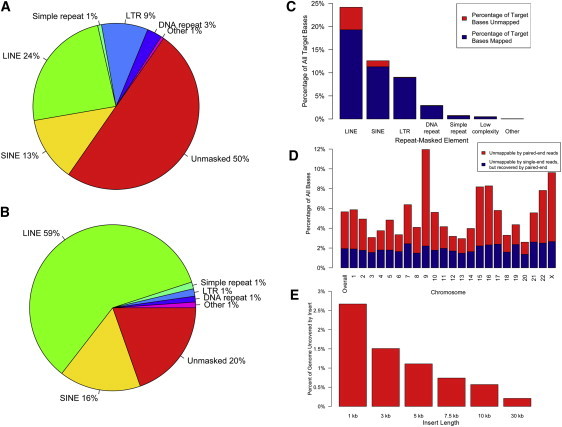
Theoretical and Empirical Coverage of Genomic Regions
Analysis was performed to predict capture success in a given region. (A) provides representation of the sequence composition across all targeted regions in the CapBP experiment and (B) shows the composition of all bases that could not be uniquely aligned, indicating that capture and unique alignment was most challenging for LINE and SINE elements.
In (C) the fraction of all captured bases is represented on the y axis for each type of repetitive element and blue shading indicates the proportion of bases that were uniquely aligned for each type.
(D) A theoretical prediction of capture performance across each chromosome based on uniquely aligning all possible 75mers with two errors or less. Blue bars indicate the proportion of unaligned bases that could be recovered by a paired-end strategy in which one of the two ends could be uniquely aligned, allowing unambiguous placement of the read pair.
(E) Theoretical proportion of all bases in the genome that would not be covered by either unique alignment of paired-end 75 cycle sequenced bases or the insert between paired reads if large insert sequencing was performed with varying insert sizes.
The genomic analyses above suggest that both the capture methods and jumping libraries are capable of accessing a very high proportion of the genome for mapping chromosomal rearrangements. Still, these methods are limited to detection within regions of the genome that permit unique alignment, either directly (a unique sequence read) or indirectly (by physical connection to a unique sequence read). For example, rearrangement mechanisms mediated by large blocks of segmental duplication are likely to be missed by any sequencing techniques that depend on short end reads, and this remains a fertile area for further study. The analysis of Subject 8, in which a translocation within a complex repetitive region of chromosome 5 was localized by anchoring reads to the unique region of chromosome 7 at the translocation junction point and by using SNPs to place the breakpoint within the correct repeat on chromosome 5, is an illustration of how careful bioinformatics can access some rearrangements in regions that do not initially yield unique alignment. Innovative alignment and mapping algorithms are in development by a number of researchers to improve localization within such regions, but alternative sequencing strategies are likely to be required to localize such events routinely.
The methods presented here were aided by the availability of prior cytogenetic information. Sequencing in clinical practice would require the blind calling of such events without prior knowledge of participating chromosomes or the use of complementary technology. As an illustration of the discovery capacity of whole-genome sequencing, we scrutinized the translocation in subject 5, which was identified by 32 supporting reads against a background chimera rate of 1.49%. We clustered all chimeric reads where paired-ends aligned within at least three standard deviations of the average insert size (up to ∼6,500 bp) and found 1,395 such clusters across the genome with a median cluster size of two reads. There were seven clusters with more than 32 reads, suggesting that the true event was within the top 99.93% of all possible events. Of note, all clusters with more than 32 reads included repetitive sequences in which the read location for one of the two ends was repeated many times, rather than the true event in which all 32 read pairs mapped to distinct genomic positions on both ends, indicating that an additional layer of filtering would isolate only the true event. These analyses suggest that with adequate read depth, chromosomal rearrangements are readily detectable in a research setting and will be yet more accessible with improved and emerging technology; however, substantial improvements in statistical modeling and uniform calling algorithms will be required before such methods can be made routine in the molecular diagnostic laboratory.
In conclusion, our test of an optimized jumping library protocol, a targeted DNA capture protocol, and a standardized analysis pipeline determined that genomic rearrangements and structural variations can be sequenced and mapped to base pair resolution in a more cost-efficient, high-throughput manner than existing strategies. Our studies revealed sequence complexity underlying karyotypically balanced chromosome rearrangements, which indicates that routine molecular definition of such cytogenetically detected events will have both research and clinical ramifications. Our findings will enable future studies of rearrangement mechanism and disease association with greater resolution than has previously been available in genomics research.
Acknowledgments
We thank Tammy Gillis, Mary Anne Anderson, and Diane Lucente at the Center for Human Genetic Research of Massachusetts General Hospital (MGH) and the Genome Sequencing Platform at the Broad Institute for technical assistance. We also thank Oleg Iartchouk, Madelyn Light, Peter Rossetti, and colleagues at the Partners Center for Personalized Genomic Medicine for contributing the HiSeq 2000 data and Dennis Gurgul of Partners Research Computing at Massachusetts General Hospital for assistance with computational resources. This work was funded by grants GM061354 and HD065286 from the National Institutes of Health and by the Simons Foundation Autism Research Initiative and Autism Speaks. M.E.T. was supported by an National Institute of Mental Health National Research Service Award (F32MH087123) and an MGH Executive Committee on Research Fund for Medical Discovery. C.E. was supported by a Canadian Institutes of Health Research Bisby Fellowship.
Supplemental Data
Web Resources
The URLs for data presented herein are as follows:
Bamstat and readPaircluster, http://mappingtools.chgr.org/
Centre for Genomic Regulation GEM, http://gemlibrary.sourceforge.net/
The Developmental Genome Anatomy Project, http://www.dgap.harvard.edu
FastX_clipper, http://hannonlab.cshl.edu/fastx_toolkit
Genome Mappability Surveyor, http://surveyor.chgr.org/
RepeatMasker, http://www.repeatmasker.org
Split read aligner and split read joiner, http://molbio.mgh.harvard.edu/dept-bioinfo-downloads.php
UCSC Genome browser, http://genome.ucsc.edu/cgi-bin/hgGateway
References
- 1.Rowley J.D. Chromosome abnormalities in leukemia. Haematol. Blood Transfus. 1979;23:43–52. doi: 10.1007/978-3-642-67057-2_5. [DOI] [PubMed] [Google Scholar]
- 2.Korbel J.O., Urban A.E., Affourtit J.P., Godwin B., Grubert F., Simons J.F., Kim P.M., Palejev D., Carriero N.J., Du L. Paired-end mapping reveals extensive structural variation in the human genome. Science. 2007;318:420–426. doi: 10.1126/science.1149504. [DOI] [PMC free article] [PubMed] [Google Scholar]
- 3.Campbell P.J., Stephens P.J., Pleasance E.D., O'Meara S., Li H., Santarius T., Stebbings L.A., Leroy C., Edkins S., Hardy C. Identification of somatically acquired rearrangements in cancer using genome-wide massively parallel paired-end sequencing. Nat. Genet. 2008;40:722–729. doi: 10.1038/ng.128. [DOI] [PMC free article] [PubMed] [Google Scholar]
- 4.Chen W., Kalscheuer V., Tzschach A., Menzel C., Ullmann R., Schulz M.H., Erdogan F., Li N., Kijas Z., Arkesteijn G. Mapping translocation breakpoints by next-generation sequencing. Genome Res. 2008;18:1143–1149. doi: 10.1101/gr.076166.108. [DOI] [PMC free article] [PubMed] [Google Scholar]
- 5.Lee H., O'Connor B.D., Merriman B., Funari V.A., Homer N., Chen Z., Cohn D.H., Nelson S.F. Improving the efficiency of genomic loci capture using oligonucleotide arrays for high throughput resequencing. BMC Genomics. 2009;10:646. doi: 10.1186/1471-2164-10-646. [DOI] [PMC free article] [PubMed] [Google Scholar]
- 6.Slade I., Stephens P., Douglas J., Barker K., Stebbings L., Abbaszadeh F., Pritchard-Jones K., Cole R., Pizer B., Stiller C., FACT collaboration Constitutional translocation breakpoint mapping by genome-wide paired-end sequencing identifies HACE1 as a putative Wilms tumour susceptibility gene. J. Med. Genet. 2010;47:342–347. doi: 10.1136/jmg.2009.072983. [DOI] [PubMed] [Google Scholar]
- 7.Li H., Ruan J., Durbin R. Mapping short DNA sequencing reads and calling variants using mapping quality scores. Genome Res. 2008;18:1851–1858. doi: 10.1101/gr.078212.108. [DOI] [PMC free article] [PubMed] [Google Scholar]
- 8.Chen W., Ullmann R., Langnick C., Menzel C., Wotschofsky Z., Hu H., Döring A., Hu Y., Kang H., Tzschach A. Breakpoint analysis of balanced chromosome rearrangements by next-generation paired-end sequencing. Eur. J. Hum. Genet. 2010;18:539–543. doi: 10.1038/ejhg.2009.211. [DOI] [PMC free article] [PubMed] [Google Scholar]
- 9.Bentley D.R., Balasubramanian S., Swerdlow H.P., Smith G.P., Milton J., Brown C.G., Hall K.P., Evers D.J., Barnes C.L., Bignell H.R. Accurate whole human genome sequencing using reversible terminator chemistry. Nature. 2008;456:53–59. doi: 10.1038/nature07517. [DOI] [PMC free article] [PubMed] [Google Scholar]
- 10.Higgins A.W., Alkuraya F.S., Bosco A.F., Brown K.K., Bruns G.A., Donovan D.J., Eisenman R., Fan Y., Farra C.G., Ferguson H.L. Characterization of apparently balanced chromosomal rearrangements from the developmental genome anatomy project. Am. J. Hum. Genet. 2008;82:712–722. doi: 10.1016/j.ajhg.2008.01.011. [DOI] [PMC free article] [PubMed] [Google Scholar]
- 11.Li H., Durbin R. Fast and accurate short read alignment with Burrows-Wheeler transform. Bioinformatics. 2009;25:1754–1760. doi: 10.1093/bioinformatics/btp324. [DOI] [PMC free article] [PubMed] [Google Scholar]
- 12.Batzoglou S., Jaffe D.B., Stanley K., Butler J., Gnerre S., Mauceli E., Berger B., Mesirov J.P., Lander E.S. ARACHNE: A whole-genome shotgun assembler. Genome Res. 2002;12:177–189. doi: 10.1101/gr.208902. [DOI] [PMC free article] [PubMed] [Google Scholar]
- 13.Ning Z., Cox A.J., Mullikin J.C. SSAHA: A fast search method for large DNA databases. Genome Res. 2001;11:1725–1729. doi: 10.1101/gr.194201. [DOI] [PMC free article] [PubMed] [Google Scholar]
- 14.Li H., Handsaker B., Wysoker A., Fennell T., Ruan J., Homer N., Marth G., Abecasis G., Durbin R., 1000 Genome Project Data Processing Subgroup The Sequence Alignment/Map format and SAMtools. Bioinformatics. 2009;25:2078–2079. doi: 10.1093/bioinformatics/btp352. [DOI] [PMC free article] [PubMed] [Google Scholar]
- 15.Gnirke A., Melnikov A., Maguire J., Rogov P., LeProust E.M., Brockman W., Fennell T., Giannoukos G., Fisher S., Russ C. Solution hybrid selection with ultra-long oligonucleotides for massively parallel targeted sequencing. Nat. Biotechnol. 2009;27:182–189. doi: 10.1038/nbt.1523. [DOI] [PMC free article] [PubMed] [Google Scholar]
- 16.Mamanova L., Coffey A.J., Scott C.E., Kozarewa I., Turner E.H., Kumar A., Howard E., Shendure J., Turner D.J. Target-enrichment strategies for next-generation sequencing. Nat. Methods. 2010;7:111–118. doi: 10.1038/nmeth.1419. [DOI] [PubMed] [Google Scholar]
- 17.Teer J.K., Bonnycastle L.L., Chines P.S., Hansen N.F., Aoyama N., Swift A.J., Abaan H.O., Albert T.J., Margulies E.H., Green E.D., NISC Comparative Sequencing Program Systematic comparison of three genomic enrichment methods for massively parallel DNA sequencing. Genome Res. 2010;20:1420–1431. doi: 10.1101/gr.106716.110. [DOI] [PMC free article] [PubMed] [Google Scholar]
- 18.Jurka J. Repbase update: A database and an electronic journal of repetitive elements. Trends Genet. 2000;16:418–420. doi: 10.1016/s0168-9525(00)02093-x. [DOI] [PubMed] [Google Scholar]
- 19.Miller D.T., Adam M.P., Aradhya S., Biesecker L.G., Brothman A.R., Carter N.P., Church D.M., Crolla J.A., Eichler E.E., Epstein C.J. Consensus statement: Chromosomal microarray is a first-tier clinical diagnostic test for individuals with developmental disabilities or congenital anomalies. Am. J. Hum. Genet. 2010;86:749–764. doi: 10.1016/j.ajhg.2010.04.006. [DOI] [PMC free article] [PubMed] [Google Scholar]
- 20.Shen Y., Dies K.A., Holm I.A., Bridgemohan C., Sobeih M.M., Caronna E.B., Miller K.J., Frazier J.A., Silverstein I., Picker J., Autism Consortium Clinical Genetics/DNA Diagnostics Collaboration Clinical genetic testing for patients with autism spectrum disorders. Pediatrics. 2010;125:e727–e735. doi: 10.1542/peds.2009-1684. [DOI] [PMC free article] [PubMed] [Google Scholar]
- 21.Conrad D.F., Bird C., Blackburne B., Lindsay S., Mamanova L., Lee C., Turner D.J., Hurles M.E. Mutation spectrum revealed by breakpoint sequencing of human germline CNVs. Nat. Genet. 2010;42:385–391. doi: 10.1038/ng.564. [DOI] [PMC free article] [PubMed] [Google Scholar]
- 22.Nijman I.J., Mokry M., van Boxtel R., Toonen P., de Bruijn E., Cuppen E. Mutation discovery by targeted genomic enrichment of multiplexed barcoded samples. Nat. Methods. 2010;7:913–915. doi: 10.1038/nmeth.1516. [DOI] [PubMed] [Google Scholar]
Associated Data
This section collects any data citations, data availability statements, or supplementary materials included in this article.