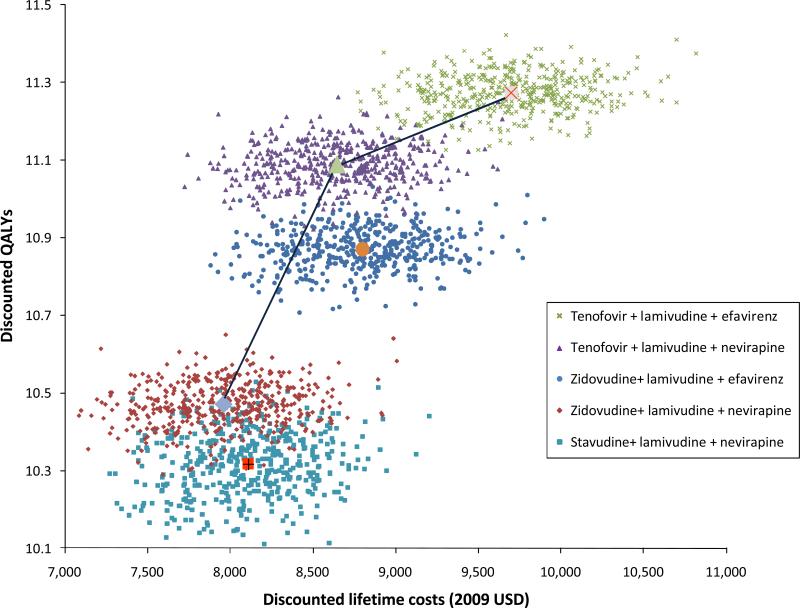
Figure 3. Results of a Probabilistic Sensitivity Analysis.
This presents the results of repeated simulations allowing for simultaneous uncertainty in all model parameters. The small markers represent the results of individual simulations, while the large central markers represent the results from the primary analysis. The figure shows the dominance of zidovudine/lamivudine/nevirapine over stavudine/lamivudine/nevirapine is less certain than the other comparative results.

