Abstract
Background
We evaluated whether cardiac troponin T (cTnT) measured with a new highly sensitive assay was associated with incident coronary heart disease (CHD), mortality, and hospitalization for heart failure (HF) in a general population of participants in the Atherosclerosis Risk in Communities (ARIC) Study.
Methods and Results
Associations between increasing cTnT levels and CHD, mortality, and HF hospitalization were evaluated using Cox proportional-hazards models adjusted for traditional CHD risk factors, kidney function, high-sensitivity C-reactive protein (hs-CRP), and N-terminal pro–B-type natriuretic peptide (NT-proBNP) in 9,698 participants aged 54–74 years who at baseline were free from CHD and stroke (and HF in the HF analysis). Measurable cTnT levels (≥0.003 μg/L) were detected in 66.5% of individuals. In fully adjusted models, compared with participants with undetectable levels, those with cTnT levels in the highest category (≥0.014 μg/L, 7.4% of the ARIC population) had significantly increased risk for CHD (hazard ratio [HR] 2.29, 95% confidence interval [CI] 1.81–2.89), fatal CHD (HR 7.59, 95% CI 3.78–15.25), total mortality (HR 3.96, 95% CI 3.21–4.88), and HF (HR 5.95, 95% CI 4.47–7.92). Even minimally elevated cTnT (≥0.003 μg/L) was associated with increased risk for mortality and HF (p<0.05). Adding cTnT to traditional risk factors improved risk prediction parameters; the improvements were similar to those with NT-proBNP and better than that with the addition of hs-CRP.
Conclusions
cTnT detectable with a highly sensitive assay was associated with incident CHD, mortality, and HF in individuals from a general population without known CHD/stroke.
Keywords: coronary disease, heart failure, risk factors, troponin
Cardiac troponin T (cTnT) and troponin I are the biomarkers recommended for diagnosis of a myocardial infarction (MI) and in the setting of an acute coronary syndrome.1 Cardiac troponin, which is released in response to cardiomyocyte necrosis, has been independently associated with adverse outcomes following acute coronary syndrome,2 in patients with chronic heart failure (HF),3 and in the general population although cTnT levels are detectable in only a small fraction of the general population using current assays.4–8
A precommercial highly sensitive cTnT assay (hs-cTnT) can detect 10-fold lower concentrations than currently available 4th-generation assays. Using this assay, cTnT levels below the detection range of standard assays were independently associated with adverse cardiovascular events in patients with HF9 or stable coronary heart disease (CHD).10 The clinical significance of detectable cTnT using the new assay in the general population is not known.
We determined prevalence of measurable cTnT with the new assay; evaluated associations of cTnT with CHD, death, and HF; and determined whether cTnT improves risk prediction for these outcomes in participants without cardiovascular disease (CVD) (n=9,698) in the Atherosclerosis Risk in Communities (ARIC) Study. Further, we performed limited comparisons between cTnT, N-terminal pro–B-type natriuretic peptide (NT-proBNP), and high-sensitivity C-reactive protein (hs-CRP) with respect to risk prediction.
METHODS
More detailed Methods are described in the Supplementary Material. cTnT levels were measured with a novel precommercial highly sensitive assay (Elecsys Troponin T [Roche Diagnostics, Indianapolis, IN]). The lower limit of detection of the novel assay is 0.003 μg/L. The lower limit of detection of the currently available clinically used assay is 0.01 μg/L, which corresponds to 0.03 μg/L with the high-sensitivity assay (i.e., the new assay has 10-fold increased detection).10 Outcomes assessed were incident CHD events (fatal CHD, definite or probable MI, coronary revascularization), all-cause mortality, and hospitalization for HF (ICD-9 code 428).
Statistical Methods
The distribution and percentile of cTnT were determined from all ARIC participants with measurements, including those with prevalent CVD, to reflect more accurately the general population. All other analyses were performed only in participants without CVD (HF analyses also excluded those with prevalent HF; also see Supplementary Material).
We modeled cTnT as both a categorical and a continuous variable. For the categorical analyses, the 33.5% with undetectable levels were the reference group (Group 1). The remaining 66.5% were split into approximate thirds: cTnT levels 0.003–0.005 μg/L (Group 2), 0.006–0.008 μg/L (Group 3), and higher levels divided at approximately the 90th percentile of the ARIC population (Group 4: 0.009–0.013 μg/L; Group 5: ≥0.014 μg/L), which incidentally corresponded to the 99th percentile value specified by the manufacturer. Because of confounding by age, gender, and race, we present age-, gender-, and race-adjusted survival curves by cTnT level; adjustments were stratified by the 5 cTnT categories to fit product-limit survival functions for each age/gender/race combination and applying the method of predicted marginals11 to obtain adjusted survival curves. Age-, gender-, and race-adjusted events rates were estimated by Poisson regression. Associations between cTnT categories and outcomes were determined with Cox proportional-hazards models. The basic model (model 1) adjusted for age, gender, and race. Model 2 adjusted for components of the ARIC CHD Risk Score (ACRS): all components of model 1, total cholesterol, high-density lipoprotein cholesterol (HDL-C), systolic blood pressure, antihypertensive medication use, smoking status, and presence of diabetes (fasting blood glucose >126 mg/dL or antidiabetic medication use).12 Coefficients for ACRS components were derived specifically for this dataset. Model 3 adjusted for ACRS plus hs-CRP, NT-proBNP, and estimated glomerular filtration rate (eGFR). We also analyzed associations between cTnT and outcomes using a continuous piecewise linear model, which demonstrated a better fit for incident CHD than polynomial or log-transformed models. In continuous models, undetectable levels were assigned a level of 0.0015 μg/L (half the lower limit of detection, as suggested by D’Angelo et al13).
To analyze the incremental value of cTnT in risk prediction, areas under the receiver operating characteristic curve (AUC), net reclassification improvement (NRI), clinical NRI (NRI in the intermediate-risk group), and integrated discrimination improvement (IDI) were calculated for the overall study population and by gender for 10-year follow-up. Bootstrapping was performed to furnish 95% confidence intervals (CIs) for the differences between models. Model calibration was assessed by Grønnesby–Borgan goodness-of-fit test. The base model for CHD risk prediction was ACRS alone; the extended model added cTnT as a continuous variable using the piecewise linear model described above. Although no risk prediction models for total mortality and HF hospitalizations are validated in ARIC, we added body mass index (BMI), left ventricular hypertrophy (LVH), and creatinine to ACRS as the base model for prediction of mortality and HF hospitalization as these additional variables were associated with mortality and HF in other studies.14,15 We created similar risk categories (as for CHD risk prediction) to estimate NRI and clinical NRI. Finally, we added hs-CRP and NT-proBNP to the risk prediction models for CHD, mortality, and HF to compare cTnT with these other markers.
RESULTS
cTnT was detectable in 6,440 individuals (66.5%) and ≥0.014 μg/L in 715 individuals (7.4%). The 99th percentile for cTnT in the entire ARIC population was 0.03 μg/L (corresponding to the lower limit of detection of the current, clinically used assay) and 0.027 μg/L in participants without CVD. Thus, <1% of the ARIC population had cTnT levels that would have been detected by the currently used assay. Detectable cTnT levels ranged from 0.003 μg/L to 0.340 μg/L. The distribution of cTnT by gender is shown in Figure 1. cTnT was detectable in 83% of men, compared with ~55% of women; 13% of men and 3% of women were in the highest cTnT group. Log-transformed cTnT levels correlated with log-transformed NT-proBNP levels; after excluding individuals with undetectable cTnT and NT-proBNP levels, Pearson’s correlation coefficients were 0.22, 0.32, and 0.25 for the overall group, men, and women, respectively (p<0.0001 for all).
Figure 1.
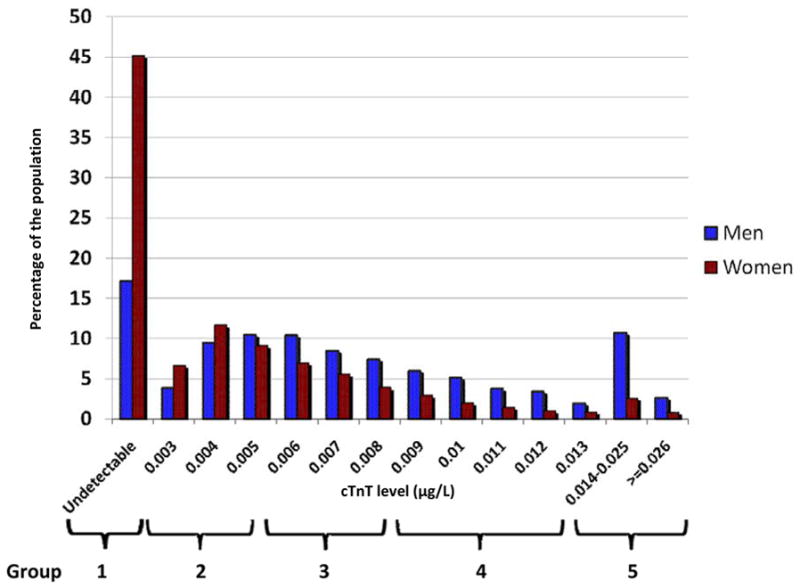
Histogram showing gender-specific distribution of cardiac troponin T (cTnT) assay in the Atherosclerosis Risk in Communities (ARIC) sample.
Table 1 shows baseline demographic characteristics by cTnT category. Individuals with higher cTnT levels were older; were more likely to be male, hypertensive, and diabetic; were less likely to be current smokers; had lower eGFR, total cholesterol, and HDL-C; and had higher triglyceride, hs-CRP, and NT-proBNP levels.
Table 1.
Adjusted baseline characteristics*
| Troponin T Group | ||||||
|---|---|---|---|---|---|---|
| Group 1 (<0.003 μg/L) (n=3258) | Group 2 (0.003 μg/L to ≤0.005 μg/L) (n=2500) | Group 3 (0.006 μg/L to ≤0.008 μg/L) (n=1971) | Group 4 (0.009 μg/L to ≤0.013 μg/L) (n=1254) | Group 5 ≥0.014 μg/L (n=715) | P | |
| Demographic | ||||||
| • Age, yrs | 60.7 | 62.4 | 63.6 | 64.9 | 65.2 | <0.0001 |
| • Race, % white | 78.2 | 80.7 | 78.2 | 76.6 | 70.4 | <0.0001 |
| • Gender, % male | 20.9 | 37.7 | 52.8 | 63.6 | 73.7 | <0.0001 |
| • BMI, kg/m2 | 27.8 | 28.6 | 29.4 | 30.0 | 30.4 | <0.0001 |
| Medical History | ||||||
| • Hypertension, % | 38.7 | 42. | 48.2 | 53.6 | 61.9 | <0.0001 |
| • Current smoking, % | 22.0 | 13.0 | 10.0 | 10.0 | 11.2 | <0.0001 |
| • Former smoking, % | 40.5 | 42.2 | 42.6 | 43.8 | 43.7 | 0.297 |
| • Diabetes mellitus, % | 9.8 | 12.4 | 17.3 | 21.1 | 35.4 | <0.0001 |
| • Systolic blood pressure, mm Hg | 125.2 | 126.6 | 128.1 | 130.5 | 130.8 | <0.0001 |
| • Diastolic blood pressure, mm Hg | 70.7 | 71.1 | 71.5 | 71.9 | 70.9 | 0.0088 |
| Laboratory Data | ||||||
| • Total cholesterol, mg/dL | 203.6 | 202.1 | 201.1 | 200.6 | 197.3 | 0.0027 |
| • HDL-C, mg/dL | 51.8 | 51.0 | 50.2 | 49.6 | 48.7 | <0.0001 |
| • Triglycerides, mg/dL | 137.8 | 139.1 | 142.8 | 149.5 | 157.1 | 0.0002 |
| • eGFR, mL/min† | 86.6 | 85.6 | 84.0 | 82.5 | 76.8 | <0.0001 |
| • Mean hs-CRP, mg/L‡ | 4.2 | 4.2 | 4.3 | 4.5 | 6.9 | <0.0001 |
| • Mean NT-proBNP, pg/mL§ | 70.1 | 92.4 | 112.4 | 149.9 | 530.7 | <0.0001 |
| Medications | ||||||
| • Aspirin, % | 53.9 | 53.8 | 53.3 | 54.9 | 57.9 | 0.310 |
| • Antihypertensives, % | 27.8 | 30.8 | 37.0 | 41.3 | 50.6 | <0.0001 |
| • Statins, % | 8.8 | 8.2 | 7.9 | 9.9 | 10.4 | 0.143 |
| LVH, %|| | 1.8 | 2.0 | 3.3 | 4.2 | 8.2 | <0.0001 |
Adjusted for age, gender, and race
eGFR calculated with the Chronic Kidney Disease Epidemiology Collaboration formula
Unadjusted median hs-CRP (mg/L): Group 1, 2.68; Group 2, 2.30; Group 3, 2.14; Group 4, 2.10; Group 5, 2.74; p<0.0001
Unadjusted median NT-proBNP (pg/mL): Group 1, 59.00; Group 2, 61.65; Group 3, 61.60 Group 4, 71.30; Group 5, 98.00; p<0.0001
LVH calculated by electrocardiographic Cornell Criteria
Associations of Troponin Levels with CHD, Mortality, and HF Hospitalization
All hazard ratios (HRs) presented for associations between cTnT and outcomes used the undetectable cTnT group as the referent. Relationships between cTnT and each outcome were not statistically different across time periods (<1 year, 1–3 years, >3 years); therefore, the proportional-hazards assumption was not rejected. Age-, gender-, and race-adjusted event rates are presented in Supplemental Table 1. Overall, event rates increased with increasing cTnT levels, except CHD in men, for which the increase was apparent only in the highest cTnT category.
CHD
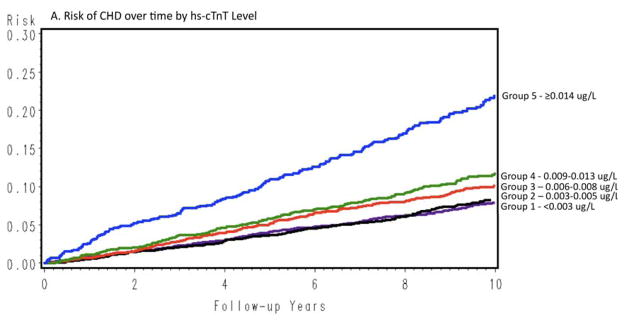
cTnT values in the highest category were associated with incident CHD events (n=983 [117 CHD deaths, 454 definite or probable MIs, and 916 definite or probable MIs or coronary revascularizations]; mean follow-up 9.4 years) in the overall cohort (Table 2), as well as in men and women (Supplemental Tables 2 and 3) considered separately. Associations of cTnT with fatal CHD (HR 7.59, 95% CI 3.78–15.25 for Group 5) were consistently stronger than associations with MI+revascularization (data not presented).
Table 2.
Cox proportional-hazards models for associations between troponin T and outcomes for overall cohort
| HR (95% CI) | |||||
|---|---|---|---|---|---|
| Group 1 (<0.003 μg/L) | Group 2 (0.003 μg/L to ≤0.005 μg/L) | Group 3 (0.006 μg/L to ≤0.008 μg/L) | Group 4 (0.009 μg/L to ≤0.013 μg/L) | Group 5 ≥0.014 μg/L | |
| ALL CHD | |||||
| (n=3258, events=214) | (n=2500, events=205) | (n=1971, events=221) | (n=1254, events=171) | (n=715, events=172) | |
| Model 1 | Reference | 1.06 (0.88, 1.29) | 1.33 (1.09, 1.62) | 1.50 (1.21, 1.86) | 2.97 (2.38, 3.71) |
| Model 2 | Reference | 1.08 (0.89, 1.31) | 1.31 (1.07, 1.59) | 1.37 (1.10, 1.71) | 2.46 (1.96, 3.08) |
| Model 3 | Reference | 1.07 (0.88, 1.30) | 1.29 (1.06, 1.58) | 1.34 (1.07, 1.67) | 2.29 (1.81, 2.89) |
| HARD CHD (FATAL CHD + MI) | |||||
| (n=3258, events=118) | (n=2500, events =104) | (n=1971, events=107) | (n=1254, events=81) | (n=715, events=117) | |
| Model 1 | Reference | 1.02 (0.78, 1.33) | 1.22 (0.93, 1.60) | 1.34 (0.99, 1.82) | 3.74 (2.81, 4.99) |
| Model 2 | Reference | 1.06 (0.81, 1.39) | 1.26 (0.96, 1.67) | 1.31 (0.96, 1.78) | 3.28 (2.44, 4.42) |
| Model 3 | Reference | 1.05 (0.80, 1.38) | 1.23 (0.93, 1.62) | 1.23 (0.90, 1.68) | 2.84 (2.09. 3.86) |
| ALL-CAUSE MORTALITY | |||||
| (n=3258, events=217) | (n=2500, events=246) | (n=1971, events=248) | (n=1254, events=234) | (n=715, events=265) | |
| Model 1 | Reference | 1.27 (1.05, 1.52) | 1.45 (1.20, 1.76) | 1.94 (1.59, 2.37) | 4.34 (3.55, 5.29) |
| Model 2 | Reference | 1.39 (1.15, 1.67) | 1.64 (1.35, 1.98) | 2.13 (1.74, 2.60) | 4.43 (3.61, 5.44) |
| Model 3 | Reference | 1.37 (1.14, 1.65) | 1.60 (1.32, 1.94) | 2.05 (1.68, 2.51) | 3.96 (3.21, 4.88) |
| HF HOSPITALIZATION | |||||
| (n=3158, events=105) | (n=2413, events=124) | (n=1877, events=147) | (n=1188, events=130) | (n=640, events=159) | |
| Model 1 | Reference | 1.45 (1.12, 1.88) | 2.21 (1.71, 2.86) | 3.07 (2.34, 4.04) | 8.61 (6.57, 11.28) |
| Model 2 | Reference | 1.51 (1.16, 1.96) | 2.24 (1.73, 2.90) | 2.84 (2.16, 3.74) | 7.00 (5.29, 9.25) |
| Model 3 | Reference | 1.48 (1.14, 1.92) | 2.17 (1.67, 2.81) | 2.68 (2.03, 3.53) | 5.95 (4.47, 7.92 |
Model 1: adjusted for age, gender, and race
Model 2: adjusted for ARIC CHD Risk Score (Model 1 + total cholesterol, HDL-C, systolic blood pressure, antihypertensive medication use, smoking status, and presence of diabetes defined as fasting blood glucose >126 mg/dL or antidiabetic medication use
Model 3: Model 2 + eGFR + hs-CRP + NT-proBNP
All-cause mortality
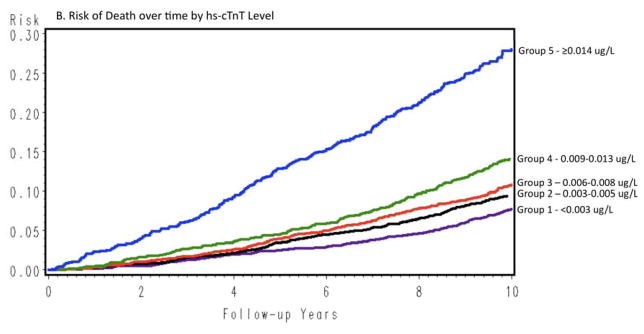
Measurable cTnT had a graded association with death (n=1,210; mean follow-up 9.9 years; Figure 2B) that persisted even in the fully adjusted model (HR 1.37, 95% CI 1.14–1.65 in Group 2; HR 3.96, 95% CI 3.21–4.88 in Group 5 [Table 2]). Associations between cTnT and mortality remained significant when men and women were evaluated separately (Supplemental Tables 2 and 3).
Figure 2.
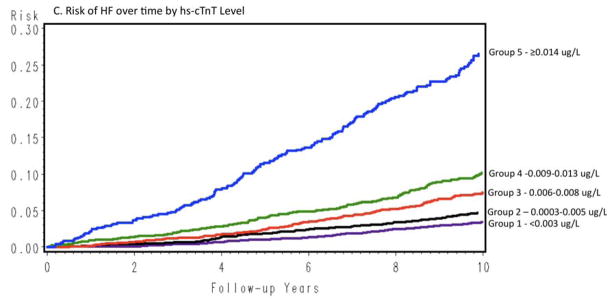
Age-, race-, and gender-adjusted survival curves assessing the time to event across cTnT categories.
HF Hospitalization
Over a mean follow-up of 9.7 years, 668 HF hospitalizations occurred; ~3% (n=105) of individuals with undetectable cTnT had HF events compared with 25% (n=159) of individuals in the highest cTnT group. Detectable cTnT was associated with HF hospitalization even in the fully adjusted model; for the lowest and highest detectable cTnT categories, HRs were 1.48 (95% CI 1.14–1.92) and 5.95 (95% CI 4.47–7.92), respectively. Associations between cTnT and HF hospitalization remained significant at all detectable cTnT levels for men, while in women the association was significant at levels ≥0.006 μg/L (Supplemental Tables 2 and 3).
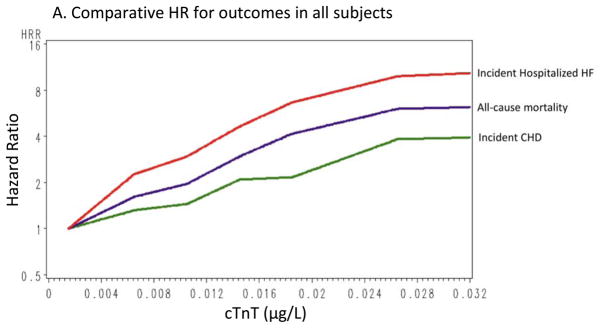
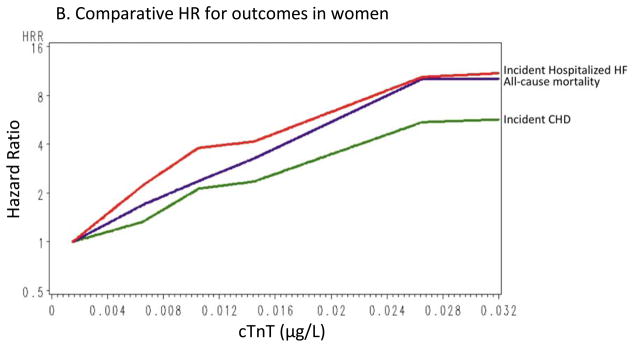
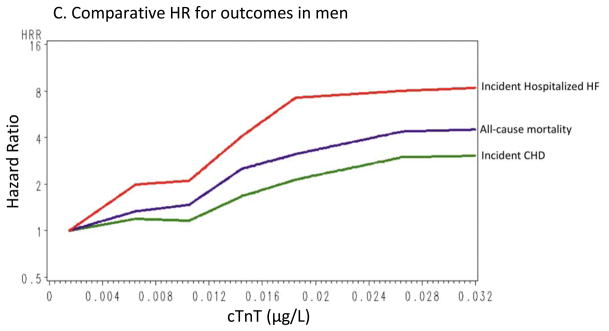
Figure 2 shows cumulative incidence curves adjusted for age, gender, and race, and Figure 3 shows the continuous hazards functions, adjusted for ACRS components (model 2), of cTnT with total CHD events, all-cause mortality, and HF hospitalization. Overall, associations between cTnT and events were strongest for HF hospitalization, intermediate for all-cause mortality, and least robust for total CHD.
Figure 3.
Continuous hazard functions of cTnT with total coronary heart disease, all-cause mortality, and heart failure hospitalizations for the overall group (A), in women (B), and in men (C), adjusted for age, race, gender (in the overall analyses), and traditional risk factors (total cholesterol, high-density lipoprotein cholesterol [HDL-C], systolic blood pressure, use of antihypertensive medications, smoking status, and presence of diabetes or the use of antidiabetic medications).
Troponin T and Risk Prediction
Adding cTnT to ACRS reclassified 17.9% (n=1737) of the overall population for CHD risk prediction: 10.8% to lower risk and 7.1% to higher risk (Supplemental Table 4). For all CHD and hard CHD, adding cTnT (as a continuous variable) to an ACRS-based model significantly improved the AUC adjusted for optimism, NRI, clinical NRI, and IDI in the overall population and in women; in men, all parameters except for NRI for all CHD were significantly improved (Table 3). Improvements in statistical parameters for hard CHD prediction were generally better than for all CHD. Calibration of the models assessed by the Grønnesby–Borgan test indicated improved model fit with the addition of cTnT for hard CHD in the overall group and for all CHD in women. For mortality and HF hospitalization, adding cTnT to the base model (ACRS+BMI+LVH+creatinine) improved the AUC, NRI, clinical NRI, and IDI in all groups, and in general the improvements were greater in magnitude than for all CHD (no statistical comparisons performed). The receiver operator characteristics curves for the various outcomes are provided in the supplement (Supplemental Figure 1). In limited exploratory analyses, addition of either cTnT or NT-proBNP appeared to be superior to adding hs-CRP for improving risk prediction for all outcomes (Supplemental Tables 5–7).
Table 3.
Metrics for improvement in risk prediction with addition of cardiac troponin T (cTnT)
| Overall | Women | Men | ||||
|---|---|---|---|---|---|---|
| Base model | Base model + cTnT | Base model | Base model + cTnT | Base model | Base model + cTnT | |
| HARD CHD (FATAL CHD + MI)* | ||||||
| Adjusted AUC (95% CI) | 0.710 (0.691, 0.732) | 0.724 (0.708, 0.747) | 0.692 (0.667, 0.725) | 0.718 (0.695, 0.753) | 0.688 (0.663, 0.720) | 0.701 (0.679, 0.735) |
| Difference in AUC (95% CI) | 0.014 (0.008, 0.024) | 0.027 (0.014, 0.046) | 0.013 (0.004, 0.028) | |||
| G-B statistic | 7.02 (p=0.64) | 6.78 (p=0.66) | 12.55 (p=0.18) | 12.72 (p=0.18) | 8.51 (p=0.48) | 12.83 (p=0.17) |
| IDI (95% CI) | 0.032 (0.021, 0.048) | 0.043 (0.026, 0.071) | 0.028 (0.015, 0.052) | |||
| NRI (95% CI) | 10.1% (3.8%, 15.9%) | 19.2% (6.7%, 25.2%) | 7.2% (1.6%, 19.1%) | |||
| NRI in intermediate-risk group (95% CI) | 22.4% (13.7%, 33.4%) | 42.0% (20.5%, 57.1%) | 15.2% (6.9%, 29.0%) | |||
| ALL CHD* | ||||||
| Adjusted AUC (95% CI) | 0.715 (0.702, 0.733) | 0.724 (0.711, 0.742) | 0.691 (0.670, 0.719) | 0.704 (0.684, 0.730) | 0.660 (0.643, 0.684) | 0.673 (0.656, 0.699) |
| Difference in AUC (95% CI) | 0.009 (0.005, 0.015) | 0.012 (0.004, 0.024) | 0.013 (0.005, 0.024) | |||
| G-B statistic | 14.24 (p=0.11) | 19.87 (p=0.02) | 17.88 (p=0.04) | 6.49 (p=0.69) | 9.74 (p=0.37) | 14.79 (p=0.10) |
| IDI (95% CI) | 0.021 (0.014, 0.032) | 0.025 (0.014, 0.040) | 0.021 (0.012, 0.037) | |||
| NRI (95% CI) | 4.5% (0.4%, 8.8%) | 6.9% (1.1%, 17.1 %) | 2.0% (−0.5%, 9.6%) | |||
| NRI in intermediate-risk group (95% CI) | 11.7% (6.9%, 17.9%) | 19.8% (9.9%, 32.1%) | 6.9% (2.8%, 14.3%) | |||
| TOTAL MORTALITY† | ||||||
| Adjusted AUC (95% CI) | 0.719 | 0.740 | 0.692 | 0.715 | 0.712 | 0.733 |
| Difference in AUC (95% CI) | 0.021 (0.014, 0.028) | 0.024 (0.014, 0.034) | 0.021 (0.013, 0.031) | |||
| G-B statistic | 11.8 (p=0.23) | 8.8 (p=0.46) | 12.6 (p=0.18) | 8.0 (p=0.53) | 15.9 (p=0.07) | 4.1 (p=0.91) |
| IDI (95% CI) | 0.037 (0.027, 0.047) | 0.035 (0.022, 0.050) | 0.037 (0.025, 0.052) | |||
| NRI (95% CI) | 10.7% (4.3%, 13.1%) | 10.0% (4.2%, 16.9%) | 6.1% (1.4%, 13.0%) | |||
| NRI in intermediate-risk group (95% CI) | 21.4% (14.4%, 25.9%) | 21.0% (13.0%, 29.4%) | 18.5% (9.9%, 26.3%) | |||
| HF HOSPITALIZATION† | ||||||
| Adjusted AUC (95% CI) | 0.749 | 0.777 | 0.741 | 0.769 | 0.736 | 0.772 |
| Difference in AUC (95% CI) | 0.028 (0.019, 0.037) | 0.028 (0.019, 0.042) | 0.036 (0.022, 0.053) | |||
| G-B statistic | 11.5 (p=0.24) | 10.4 (p=0.32) | 10.1 (p=0.34) | 9.1 (p=0.42) | 9.2 (P=0.42) | 2.3 (P=0.99) |
| IDI (95% CI) | 0.044 (0.032, 0.058) | 0.038 (0.023, 0.055) | 0.057 (0.036, 0.085) | |||
| NRI (95% CI) | 15.4% (8.4%, 20.6%) | 16.7% (6.4%, 22.4%) | 15.9% (8.0%, 27%) | |||
| NRI in intermediate-risk group (95% CI) | 30.9% (22.1%, 40.0)% | 31.2% (18.0%, 43.6%) | 30.7% (20.1%, 49.5%) | |||
AUC = area under the receiver operating characteristic curve; G-B statistic = Grønnesby – Borgan goodness-of-fit statistic; IDI = integrated discrimination improvement; NRI = net reclassification improvement
Base model for CHD: model based on ARIC Coronary Risk Score (age, gender, race, total cholesterol, HDL-C, systolic blood pressure, use of antihypertensive medications, smoking status, and presence of diabetes defined as fasting blood glucose >126 mg/dL or use of antidiabetic medications).
Base model for total mortality and HF: ARIC Coronary Risk Score + BMI + presence of LVH on ECG + serum creatinine.
DISCUSSION
In our analysis, cTnT measured with a new high-sensitivity assay had strong associations with CHD, mortality, and HF in a general population of middle-aged to older adults without CVD. The new assay detected cTnT in 66.5% of these individuals, the vast majority of whom had levels that would have been undetectable by the currently available, clinically used 4th-generation assay. Only 65 individuals (<1% of the ARIC population) had cTnT levels ≥0.03 μg/L (i.e., detectable using the currently used assay), consistent with reported detectable levels in <1% of the general population5 and 4.1% of the elderly population.6
Prior studies using this hs-cTnT assay have reported associations with adverse cardiovascular outcomes in individuals with chronic HF9 and stable CHD,10 and we now extend the findings to a general population aged 54–74 years. Among the outcomes tested, associations were strong with fatal CHD, all-cause mortality, and HF hospitalization. Of the CHD outcomes, the association with fatal CHD was strongest, and associations with nonfatal CHD events, including MI and revascularization, were weaker. However, relatively few fatal CHD events occurred; hence, when all CHD events were considered together, the association was weaker than with all-cause mortality and HF. Metrics of risk prediction, including AUC, NRI, and IDI, were also more robust for mortality and HF than for CHD (Table 3). In exploratory analyses, improvements in risk prediction for CHD, mortality, and HF when cTnT was added to risk prediction models were similar to those provided by NT-proBNP and larger than those for hs-CRP. In summary, our findings suggest that cTnT may be an important marker in the prediction of hard CHD, mortality, and HF.
Our results are concordant with those of 2 other population studies, the Cardiovascular Health Study (CHS)16 and the Dallas Heart Study (DHS),17 which were published after submission of this report; all 3 studies used the same assay. The ARIC results are most similar to those of CHS (average age ~10 years older than ARIC), in which 66% of participants had detectable cTnT with the new assay.16 Although overall only 25% of DHS participants had detectable levels, >50% were aged <50 years; 56% of participants aged 60–65 had detectable levels.17 All 3 studies found strong associations with mortality. The younger age and greater number of ARIC participants may have contributed to the larger NRI for mortality and HF than in CHS. The prevalence of detectable cTnT with the high-sensitivity assay is clearly distinct from the “sensitive” troponin I assay used by Blankenberg et al., which detected levels in <2% of population cohorts.8
The weaker association observed with nonfatal CHD events seems counter to findings in patients with acute coronary syndromes, in whom elevated cTnT level is a strong marker for risk for future MI.18,19 However, small elevations in cTnT had no association with short-term risk for MI in asymptomatic individuals with stable CHD10; this, taken together with our findings, suggests that the risk from low detectable cTnT levels in asymptomatic subjects may be mediated through mechanisms other than or in addition to atherothrombosis. These mechanisms, which are not fully understood, may result from troponin release from cardiac myocytes due to asymptomatic ischemia, coronary microvascular dysfunction, apoptosis, or subclinical cardiac structural or functional abnormalities. Troponin I levels measured with a highly sensitive assay increased with reversible ischemia detected by nuclear perfusion imaging,20 supporting the notion that subclinical ischemia could induce troponin release. However, in another study that used the hs-cTnT assay, cTnT levels did not change with exercise- or pharmacological stress–induced ischemia,21 again suggesting that factors other than ischemia contribute significantly to the risk associated with cTnT. Coronary microvascular dysfunction, which occurs in hypertension, diabetes, and LVH, is another potential cause for elevated circulating troponin levels22 and may mediate, in part, the associations observed with HF events. Troponin is eliminated from the circulation via renal clearance; therefore, as glomerular filtration declines, troponin levels may increase. While this was true in ARIC, the associations with outcomes remained strong even after adjustment for eGFR. Therefore, the mechanisms underlying elevated troponin levels may be several, and it is unclear which mechanisms are related to the outcomes observed in our study.
Clinical and Therapeutic Implications
The strength of the associations between cTnT and the various outcomes has several potential implications. First, troponin levels above 99th percentile values have been recommended for diagnosis of MI.1 The 99th percentile value for cTnT in our study (0.03 μg/L) was far higher than that published by the manufacturer (0.014 μg/L), and 7% of the ARIC population had levels ≥0.014 μg/L. Januzzi et al.23 reported (using the manufacturer-determined 99th percentile cutpoint) that the high-sensitivity assay had a lower positive predictive value (38%) than the conventional assay (67–72%), suggesting that false positives were higher with the high-sensitivity assay. If the 99th percentile identified in a population study such as ARIC were used, the estimated predictive value may be different. The diagnostic criteria may need to be revised to include both absolute cTnT level and rise and fall in cTnT level when the high-sensitivity assay is used.24 Conversely, undetectable cTnT with the new assay may have superior negative predictive value, which will need further study.
cTnT modestly improves CHD risk prediction, and therapies such as statin and/or aspirin could hypothetically be considered for individuals reclassified as higher risk with cTnT. However, although statins reduce CHD events in patients with traditional risk factors such as hypertension,25 statins have not shown benefit in some high-risk populations such as patients with HF26 or end-stage renal disease.27 Furthermore, a recent study in individuals with diabetes suggested that cTnT levels did not change significantly with either intensive or standard risk factor management.28
The stronger association of cTnT with death and HF than with CHD suggests that this biomarker predicts structural heart disease events to a greater extent than atherosclerotic events. Therefore, strategies aimed to prevent CHD may have smaller effects than strategies aimed to prevent progression of structural heart disease. As HF prevalence and incidence continue to increase, markers such as cTnT may conceivably identify high-risk individuals and allow early initiation of preventive strategies. Better understanding of the adverse mechanisms/process(es) that cTnT marks or mediates may be useful in targeting therapies, but ultimately clinical trials will be needed to examine if risk can be modified.
Limitations
Validated mortality and HF risk prediction models have not yet been developed in ARIC; therefore, we added BMI, creatinine, and LVH to the ACRS for use as the base model. However, AUCs were greater for both mortality (0.719) and HF (0.749) than for all CHD (0.715). We do not know if cTnT would have added to risk prediction with the addition of other biomarkers or clinical variables including echocardiography (which was not available) to the ACRS.
Conclusion
cTnT measured with a novel highly sensitive cTnT assay was detectable in the majority of middle-aged individuals without prevalent CVD. Even slight elevations were strongly associated with death, especially CHD death, and HF hospitalization. Although there was an association between cTnT and MI, it was less pronounced than that for the other endpoints assessed. Whether the risk for CHD, mortality, and HF hospitalization associated with measurable cTnT in individuals without prior CVD is modifiable is unknown and requires further study.
Supplementary Material
Acknowledgments
The Atherosclerosis Risk in Communities Study is carried out as a collaborative study supported by National Heart, Lung, and Blood Institute contracts N01-HC-55015, N01-HC-55016, N01-HC-55018, N01-HC-55019, N01-HC-55020, N01-HC-55021, and N01-HC-55022. The authors thank the staff and participants of the ARIC study for their important contributions. The authors also acknowledge Kerrie C. Jara for editorial assistance and Dr. A. Richey Sharrett for his critical comments and feedback on the manuscript.
Funding Sources
Dr. Astors and Coresh are supported by the National Institute of Diabetes and Digestive and Kidney Diseases (1 R01 DK076770-01). Dr. Nambi is supported by a National Heart, Lung, and Blood Institute grant (5K23HL096893-02). Dr. Virani is supported by a Department of Veterans Affairs Health Services Research and Development Services (HSR&D) Career Development Award (CDA 09-028).
Roche provided reagents and loan of an instrument to conduct the highly sensitive cTnT and NT-proBNP assays. Siemens Healthcare Diagnostics provided reagents and loan of an instrument to conduct the hs-CRP assay. Roche and Siemens had no role in design, analysis, or manuscript preparation.
Footnotes
Disclosures
Dr. Nambi is on the advisory board for Roche. Dr. de Lemos has received grant support from Roche and consulting income from Tethys Biomedical and Johnson and Johnson. Drs. Hoogeveen and Ballantyne have received grant support from Roche Diagnostics (and NIH). The other authors declare no commercial conflicts of interest (but receive NIH grant funding).
References
- 1.Thygesen K, Alpert JS, White HD on behalf of the Joint ESC/ACCF/AHA/WHF Task Force for the Redefinition of Myocardial Infarction. Universal definition of myocardial infarction. Circulation. 2007;116:2634–2653. doi: 10.1161/CIRCULATIONAHA.107.187397. [DOI] [PubMed] [Google Scholar]
- 2.Lindahl B, Venge P, Wallentin L for the FRISC Study Group. Relation between troponin T and the risk of subsequent cardiac events in unstable coronary artery disease. Circulation. 1996;93:1651–1657. doi: 10.1161/01.cir.93.9.1651. [DOI] [PubMed] [Google Scholar]
- 3.Missov E, Mair J. A novel biochemical approach to congestive heart failure: cardiac troponin T. Am Heart J. 1999;138:95–99. doi: 10.1016/s0002-8703(99)70252-8. [DOI] [PubMed] [Google Scholar]
- 4.Wang TJ, Gona P, Larson MG, Tofler GH, Levy D, Newton-Cheh C, Jacques PF, Rifai N, Selhub J, Robins SJ, Benjamin EJ, D’Agostino RB, Vasan RS. Multiple biomarkers for the prediction of first major cardiovascular events and death. N Engl J Med. 2006;355:2631–2639. doi: 10.1056/NEJMoa055373. [DOI] [PubMed] [Google Scholar]
- 5.Wallace TW, Abdullah SM, Drazner MH, Das SR, Khera A, McGuire DK, Wians F, Sabatine MS, Morrow DA, de Lemos JA. Prevalence and determinants of troponin T elevation in the general population. Circulation. 2006;113:1958–1965. doi: 10.1161/CIRCULATIONAHA.105.609974. [DOI] [PubMed] [Google Scholar]
- 6.Daniels LB, Laughlin GA, Clopton P, Maisel AS, Barrett-Connor E. Minimally elevated cardiac troponin T and elevated N-terminal pro-B-type natriuretic peptide predict mortality in older adults: results from the Rancho Bernardo Study. J Am Coll Cardiol. 2008;52:450–459. doi: 10.1016/j.jacc.2008.04.033. [DOI] [PMC free article] [PubMed] [Google Scholar]
- 7.Zethelius B, Berglund L, Sundstrom J, Ingelsson E, Basu S, Larsson A, Venge P, Arnlov J. Use of multiple biomarkers to improve the prediction of death from cardiovascular causes. N Engl J Med. 2008;358:2107–2116. doi: 10.1056/NEJMoa0707064. [DOI] [PubMed] [Google Scholar]
- 8.Blankenberg S, Zeller T, Saarela O, Havulinna AS, Kee F, Tunstall-Pedoe H, Kuulasmaa K, Yarnell J, Schnabel RB, Wild PS, Munzel TF, Lackner KJ, Tiret L, Evans A, Salomaa V for the MORGAM project. Contribution of 30 biomarkers to 10-year cardiovascular risk estimation in 2 population cohorts: the MONICA, Risk, Genetics, Archiving, and Monograph (MORGAM) biomarker project. Circulation. 2010;121:2388–2397. doi: 10.1161/CIRCULATIONAHA.109.901413. [DOI] [PubMed] [Google Scholar]
- 9.Latini R, Masson S, Anand IS, Missov E, Carlson M, Vago T, Angelici L, Barlera S, Parrinello G, Maggioni AP, Tognoni G, Cohn JN for the Val-HeFT Investigators. Prognostic value of very low plasma concentrations of troponin T in patients with stable chronic heart failure. Circulation. 2007;116:1242–1249. doi: 10.1161/CIRCULATIONAHA.106.655076. [DOI] [PubMed] [Google Scholar]
- 10.Omland T, de Lemos JA, Sabatine MS, Christophi CA, Rice MM, Jablonski KA, Tjora S, Domanski MJ, Gersh BJ, Rouleau JL, Pfeffer MA, Braunwald E for the Prevention of Events with Angiotensin Converting Enzyme Inhibition (PEACE) Trial Investigators. A sensitive cardiac troponin T assay in stable coronary artery disease. N Engl J Med. 2009;361:2538–2547. doi: 10.1056/NEJMoa0805299. [DOI] [PMC free article] [PubMed] [Google Scholar]
- 11.Research Triangle Institute; Release 9.0. SUDAAN Language Manual. Research Triangle Park, NC: Research Triangle Institute; 2004. [Google Scholar]
- 12.Chambless LE, Folsom AR, Sharrett AR, Sorlie P, Couper D, Szklo M, Nieto FJ. Coronary heart disease risk prediction in the Atherosclerosis Risk in Communities (ARIC) study. J Clin Epidemiol. 2003;56:880–890. doi: 10.1016/s0895-4356(03)00055-6. [DOI] [PubMed] [Google Scholar]
- 13.D’Angelo G, Weissfeld L. An index approach for the Cox model with left censored covariates. Stat Med. 2008;27:4502–4514. doi: 10.1002/sim.3285. [DOI] [PubMed] [Google Scholar]
- 14.Butler J, Kalogeropoulos A, Georgiopoulou V, Belue R, Rodondi N, Garcia M, Bauer DC, Satterfield S, Smith AL, Vaccarino V, Newman AB, Harris TB, Wilson PW, Kritchevsky SB. Incident heart failure prediction in the elderly: the Health ABC heart failure score. Circ Heart Fail. 2008;1:125–133. doi: 10.1161/CIRCHEARTFAILURE.108.768457. [DOI] [PMC free article] [PubMed] [Google Scholar]
- 15.Smith JG, Newton-Cheh C, Almgren P, Struck J, Morgenthaler NG, Bergmann A, Platonov PG, Hedblad B, Engstrom G, Wang TJ, Melander O. Assessment of conventional cardiovascular risk factors and multiple biomarkers for the prediction of incident heart failure and atrial fibrillation. J Am Coll Cardiol. 2010;56:1712–1719. doi: 10.1016/j.jacc.2010.05.049. [DOI] [PMC free article] [PubMed] [Google Scholar]
- 16.Defilippi CR, de Lemos JA, Christenson RH, Gottdiener JS, Kop WJ, Zhan M, Seliger SL. Association of serial measures of cardiac troponin T using a sensitive assay with incident heart failure and cardiovascular mortality in older adults. JAMA. 2010;304:2494–2502. doi: 10.1001/jama.2010.1708. [DOI] [PMC free article] [PubMed] [Google Scholar]
- 17.de Lemos JA, Drazner MH, Omland T, Ayers CR, Khera A, Rohatgi A, Hashim I, Berry JD, Das SR, Morrow DA, McGuire DK. Association of troponin T detected with a highly sensitive assay and cardiac structure and mortality risk in the general population. JAMA. 2010;304:2503–2512. doi: 10.1001/jama.2010.1768. [DOI] [PMC free article] [PubMed] [Google Scholar]
- 18.Lindahl B, Diderholm E, Lagerqvist B, Venge P, Wallentin L the FRISC II Investigators. Mechanisms behind the prognostic value of troponin T in unstable coronary artery disease: a FRISC II substudy. J Am Coll Cardiol. 2001;38:979–986. doi: 10.1016/s0735-1097(01)01501-7. [DOI] [PubMed] [Google Scholar]
- 19.Ottani F, Galvani M, Nicolini FA, Ferrini D, Pozzati A, Di Pasquale G, Jaffe AS. Elevated cardiac troponin levels predict the risk of adverse outcome in patients with acute coronary syndromes. Am Heart J. 2000;140:917–927. doi: 10.1067/mhj.2000.111107. [DOI] [PubMed] [Google Scholar]
- 20.Sabatine MS, Morrow DA, de Lemos JA, Jarolim P, Braunwald E. Detection of acute changes in circulating troponin in the setting of transient stress test-induced myocardial ischaemia using an ultrasensitive assay: results from TIMI 35. Eur Heart J. 2009;30:162–169. doi: 10.1093/eurheartj/ehn504. [DOI] [PMC free article] [PubMed] [Google Scholar]
- 21.Kurz K, Giannitsis E, Zehelein J, Katus HA. Highly sensitive cardiac troponin T values remain constant after brief exercise- or pharmacologic-induced reversible myocardial ischemia. Clin Chem. 2008;54:1234–1238. doi: 10.1373/clinchem.2007.097865. [DOI] [PubMed] [Google Scholar]
- 22.Camici PG, Crea F. Coronary microvascular dysfunction. N Engl J Med. 2007;356:830–840. doi: 10.1056/NEJMra061889. [DOI] [PubMed] [Google Scholar]
- 23.Januzzi JL, Jr, Bamberg F, Lee H, Truong QA, Nichols JH, Karakas M, Mohammed AA, Schlett CL, Nagurney JT, Hoffmann U, Koenig W. High-sensitivity troponin T concentrations in acute chest pain patients evaluated with cardiac computed tomography. Circulation. 2010;121:1227–1234. doi: 10.1161/CIRCULATIONAHA.109.893826. [DOI] [PMC free article] [PubMed] [Google Scholar]
- 24.Keller T, Zeller T, Peetz D, Tzikas S, Roth A, Czyz E, Bickel C, Baldus S, Warnholtz A, Frohlich M, Sinning CR, Eleftheriadis MS, Wild PS, Schnabel RB, Lubos E, Jachmann N, Genth-Zotz S, Post F, Nicaud V, Tiret L, Lackner KJ, Munzel TF, Blankenberg S. Sensitive troponin I assay in early diagnosis of acute myocardial infarction. N Engl J Med. 2009;361:868–877. doi: 10.1056/NEJMoa0903515. [DOI] [PubMed] [Google Scholar]
- 25.Sever PS, Dahlof B, Poulter NR, Wedel H, Beevers G, Caulfield M, Collins R, Kjeldsen SE, Kristinsson A, McInnes GT, Mehlsen J, Nieminen M, O’Brien E, Ostergren J for the ASCOT Investigators. Prevention of coronary and stroke events with atorvastatin in hypertensive patients who have average or lower-than-average cholesterol concentrations, in the Anglo-Scandinavian Cardiac Outcomes Trial--Lipid Lowering Arm (ASCOT-LLA): a multicentre randomised controlled trial. Lancet. 2003;361:1149–1158. doi: 10.1016/S0140-6736(03)12948-0. [DOI] [PubMed] [Google Scholar]
- 26.Tang WH, Francis GS. Statin treatment for patients with heart failure. Nat Rev Cardiol. 2010;7:249–255. doi: 10.1038/nrcardio.2010.29. [DOI] [PubMed] [Google Scholar]
- 27.Karumanchi SA, Thadhani R. Kidney complications: why don’t statins always work? Nat Med. 2010;16:38–40. doi: 10.1038/nm0110-38. [DOI] [PubMed] [Google Scholar]
- 28.Hallen J, Johansen OE, Birkeland KI, Gullestad L, Aakhus S, Endresen K, Tjora S, Jaffe AS, Atar D. Determinants and prognostic implications of cardiac troponin T measured by a sensitive assay in type 2 diabetes mellitus. Cardiovasc Diabetol. 2010;9:52. doi: 10.1186/1475-2840-9-52. [DOI] [PMC free article] [PubMed] [Google Scholar]
Associated Data
This section collects any data citations, data availability statements, or supplementary materials included in this article.


