

Abstract
Phosphodiesterase-2 (PDE2) is a key enzyme catalyzing hydrolysis of both cyclic adenosine monophosphate (cAMP) and cyclic guanosine monophosphate (cGMP) that serve as intracellular second messengers. PDE2 has been recognized as an attractive drug target, and selective inhibitors of PDE2 are expected to be promising candidates for the memory enhancer, anti-depressant, and anxiolytic agent. In the present study, we examined the detailed binding structures and free energies for PDE2 interacting with a promising series of inhibitors, i.e. benzo[1,4]diazepin-2-one derivatives, by carrying out molecular docking, molecular dynamics (MD) simulations, binding free energy calculations, and binding energy decompositions. The computational results provide valuable insights into the detailed enzyme-inhibitor binding modes including important intermolecular interactions, e.g. the π-π stacking interactions with the common benzo[1,4]diazepin-2-one scaffold of the inhibitors, hydrogen bonding and hydrophobic interactions with the substituents on the benzo[1,4]diazepin-2-one scaffold. Future rational design of new, more potent inhibitors of PDE2 should carefully account for all of these favorable intermolecular interactions. By use of the MD-simulated binding structures, the calculated binding free energies are in good agreement with the experimental activity data for all of the examined benzo[1,4]diazepin-2-one derivatives. The enzyme-inhibitor binding modes determined and the agreement between the calculated and experimental results are expected to be valuable for future rational design of more potent inhibitors of PDE2.
Introduction
Cyclic nucleotide phosphodiesterases (PDEs) are important regulators of cellular functions and signal transduction in various tissues, mediated by the intracellular second messengers cyclic adenosine monophosphate (cAMP) and cyclic guanosine monophosphate (cGMP).1–4 Through catalytic hydrolysis of 3′, 5′-cyclic nucleotides to the physiologically inactive 5′-nucleoside monophosphates, intracellular concentrations of cyclic nucleotides and consequent biological responses are tightly controlled by both the rate of their synthesis via adenylyl and guanylyl cyclases and the rate of their hydrolysis via PDEs.2, 5 Inhibiting an individual PDE specifically maintains the response to a particular stimulus in certain biological (pathological) conditions and, thus, PDEs have been considered as important therapeutic targets.5–9
A total of 21 mammalian PDE genes have been cloned and classified into 11 families (PDE1 to PDE11).10 Each gene product may have multiple splice variants and there are more than 100 specific, structurally related isoenzymes in total. The PDE families are distinguished by their substrate specificity. PDE5, PDE6, and PDE9 are specific for cGMP. PDE4, PDE7, and PDE8 are cAMP-specific. PDE1 to PDE3, PDE10, and PDE11 hydrolyze both substrates.11 PDE2 is cGMP-simulated and metabolizes both cGMP and cAMP, although its affinity for cGMP is slightly higher than that for cAMP.12
PDE2 is expressed in a wide variety of tissues and cell types, such as heart, liver, adrenal gland, and platelets13–14 and is thought to be involved in regulating many different intracellular processes. In contrast to other PDE isoenzyme families, PDE2 is encoded by a single gene (PDE2A) and three PDE2A variants have been cloned from three different species. Sequence alignment reveals that the three isoforms are highly homologous except at the extreme N-terminal, suggesting alternative N-terminal exon usage during splicing.
The crystal structure of the PDE2A catalytic active site enzyme has been reported.15 Endogenous substrate cAMP/cGMP binds to the catalytic pocket consisting of a purine-binding site, where the hydrolysis reaction takes place. Notably, there is invariant conserved residue, Gln859 in PDE2A (pdb code: 3ITU), forming hydrogen bonds with the purine ring of the substrate at the apex of the purine-binding site.16–19 The free rotation of Gln859 in PDE2 make it possible to form hydrogen bonds with the exocyclic amino group of cAMP and the exocyclic carbonyl oxygen of cGMP, which determined the selectivity for both cAMP and cGMP. The active site is formed at the junction of the helices by residues that are highly conserved among all the PDEs. There are divalent metal ions (Zn2+ and Mg2+) in the bottom of the substrate binding pocket. The metal ions are coordinated by residues located on each of the three different domains. The metal binding site that binds zinc has two histidine and two aspartic acid residues that are absolutely conserved among all PDEs studied to date. These residues form part of the signature recognition sequence for cyclic nucleotide PDEs.
Computational studies on PDEs have also been reported in literature.20–27 For example, molecular dynamics (MD) simulations and hybrid quantum mechanics/molecular mechanics (QM/MM) calculations have been employed to characterize the bridging ligand between the two metal ions and other structural problems in the PDE active site.20, 23, 28–29 Zagrovic et al. have employed thermodynamic integration to study the binding affinities of several inhibitors towards PDE5.26, 30
PDE2-selective inhibitors have been used as a tool to successfully probe PDE2 functions. In particular, potential therapeutic values of PDE2 inhibitors have been investigated using animal behavioral models.31–32 The first PDE2-specific inhibitor reported was EHNA (erythro-9-(2-hydroxy-3-nonyl) adenine) with an IC50 value of ~1 μM and at least 50-fold selectivity over other PDEs.33 Then, more potent, PDE2-selective inhibitors have been developed;34–35,36 one of the promising PDE2 inhibitors (i.e. benzo[1,4]diazepin-2-one derivatives36) has been advanced to clinical trials as an anti-depressant.
To reasonably model PDE2A binding with inhibitors, one first needs to determine a 3D structure of the enzyme. However, the available X-ray crystal structure of the human PDE2A catalytic domain was solved in an unbound state (apo form) without a meaningful ligand in the binding pocket15 and molecular docking studies could not be realized by using the available X-ray crystal structure.37 In order to establish a solid structural base for future rational design of more potent PDE2A inhibitors as potential therapeutic agents, we recently reported a reasonable 3D model of PDE2A representing the enzyme structure in a bound state through computational modeling using the high-resolution X-ray crystal structure of PDE5 as a template.37 This 3D model of PDE2A in the bound state provides a structural base for studying the microscopic binding of PDE2 with its inhibitors and for understanding the structure-activity correlation in the present work.
We are particularly interested in the structure-activity correlation for the benzo[1,4]diazepin-2-one derivatives36 as one of these compounds has been tested in clinical trials. Specifically, in this present work, we docked various representative benzo[1,4]diazepin-2-one derivatives into the above-mentioned 3D model of PDE2A in a bound state. Molecular docking was followed by molecular dynamics (MD) simulations and binding free energy calculations to refine the binding structures and to understand the structure-activity correlation of the PDE2A inhibitors. A detailed analysis of the determined binding structures and binding free energies provides valuable insights into the structure-activity correlation that may guide future rational design of novel, more potent PDE2A inhibitors.
Material and Methods
Molecular docking
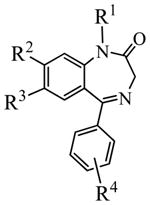
The PDE2A inhibitors examined in the present study are benzo[1,4]diazepin-2-one derivatives.36 Their molecular structures and IC50 values are collected in Table 1. The partial atomic charges used for these inhibitors were the electrostatic potential (ESP)-fitted atomic charges, i.e. the ESP charges, that fit to the electrostatic potential at points selected according to the Merz-Singh-Kollman scheme38–39 following the calculations at ab initio HF/6-31G* level using the Gaussian03 program.40
Table 1.
Molecular structures and PDE2A inhibitory activity of 11 representative benzo[1,4]diazepin-2-one derivatives examined in this study
 | |||||
|---|---|---|---|---|---|
| Compound | R1 | R2 | R3 | R4 | IC50 (μM) |
| 1 | CH3 | OCH3 | (2,6-DiMeO)Ph | 4-OCH3 | 0.0060 |
| 2 | CH3 | H | (2,6-DiMeO)Ph | 4-OCH3 | 0.017 |
| 3 | CH3 | OCH3 | (2,6-DiMeO)Ph | 3-CONH2 | 0.020 |
| 4 | CH3 | H | (2,6-DiMeO)Ph | 3-CONH2 | 0.030 |
| 5 | CH3 | OCH3 | Ph | 3-CONH2 | 0.050 |
| 6 | CH3 | OCH3 | 4-ClPh | 3-CONH2 | 0.12 |
| 7 | CH3 | OCH3 | Ph | 3-CH2OCH3 | 0.30 |
| 8 | CH3 | H | (2,6-DiMeO)Ph | 3-CH3 | 0.50 |
| 9 | CH3 | H | (2,6-DiMeO)Ph | 3-CN | 0.60 |
| 10 | CH3 | H | Ph | 3-CONH2 | 1.1 |
| 11 | CH3 | H | Ph | 3-CN | 2.2 |
Molecular docking was carried out by using FRED (OpenEye Scientific Software).41 The FRED strategy is to exhaustively dock/score all possible positions of each ligand in the binding site. Its docking algorithm is based on an exhaustive search for the possible binding modes, including rigid rotations and translations of each conformer of the ligand. The rigid docking roughly consists of two steps, i.e. shape fitting and optimization. During the shape fitting, the ligand was placed into a 0.5 Å-resolution grid box encompassing all active-site atoms (including hydrogen atoms) using a smooth Gaussian potential.42 A series of two optimization filters were then processed, consisting of rigid-body optimization and optimization of the ligand pose in the dihedral angle space. The ligand poses were clustered, and the most populated cluster (i.e. the one with the largest number of neighbors) was identified as the most favored cluster of poses of the ligand in the active site. The most favored pose ensemble was then filtered to reject poses that do not have sufficient shape complimentarily to the protein’s active site followed by rejection of poses that do not have at least one heavy atom making hydrogen bond with Gln859 side chain and van der Waals (vdW) interaction with Phe830 side chain. The top-ranked poses were optimized by carrying out rigid optimization and refined with the Merck Molecular Force Field (MMFF) implemented in the OpenEye Scientific Software.41 In the optimization process, four scoring functions are available: Gaussian shape scoring,42 ChemScore,43 PLP,44 and ScreenScore.45 Preliminary docking trials led us to select the consensus score for the optimization filters.
We have further refined these PDE2A-ligand binding structures with energy minimization and continued for 100-ps MD simulations (prior to the more extensive MD simulation described below) at T = 298.15 K by using Amber9 program.46 During the energy minimization and MD simulation, only the ligand and side chains of residues in the binding pocket were kept free to move. The nonbonded interaction cutoff and the dielectric constant were set up to group based (20 Å cutoff distance) and distance dependent (ε = 4r),47–49 respectively, to mimic the solvent environment. The MD simulation for the purpose of molecular docking was performed using a time step of 1 fs.
The docked structures were examined, and the best pose for each ligand was selected based on the following criteria: the interaction energy (sum of the electrostatic and vdW interaction energies) of the PDE2A-ligand complex, hydrogen bonds formed between Gln859 side chain and the amide group of the ligand, and/or interaction with Phe830 side chain. Finally, the ligand conformation with the lowest interaction energy was subjected to energy minimizations and MD simulations on the explicitly solvated protein-ligand complexes (see below for the MD simulations) that can better account for the solvent effects on the protein-ligand binding.
Molecular dynamics simulation procedure
All MD simulations were carried out using the Amber9 package and the parm99 force field. The missing force field parameters for the ligands were taken from the General Amber Force Field (GAFF) implemented in Amber9 program. The initial geometry of each PDE2A-ligand structure was neutralized by adding appropriate sodium counterions and was solvated in a rectangular box of TIP3P water molecules50 with a minimum solute-wall distance of 10 Å.
Prior to the MD simulations, the protein-ligand complex was kept fixed with a constraint of 500 kcal mol−1 Å−2, and we first energy-minimized the positions of the water molecules. Then, the entire solvated system was fully energy-minimized without any constraint. The MD simulation was performed by using the Sander module of Amber9 program46 in a way similar to what we did for other protein-ligand systems.51 The MD simulation was run by using the energy-minimized structure as the starting structure, and the Particle Mesh Ewald (PME) algorithm was used for dealing with long-range interactions.52 Each of the solvated systems was carefully equilibrated before a sufficiently long MD simulation in room temperature. Constant-volume was carried out for 50 ps, during which the temperature was raised from 10 to 298.15 K. Then, a long production run of constant-pressure MD was carried out at 298.15 K. The MD simulations were performed with a periodic boundary condition in the NPT ensemble at T = 298.15 K with Berendsen temperature coupling53 and constant pressure (P = 1 atm) with the isotropic molecule-based scaling. The time step of the simulation was 2.0 fs with a cutoff of 12 Å for the nonbonded interactions, and SHAKE algorithm was employed to keep all bonds involving hydrogen atoms rigid.54
As we did in our previous work,37 the first 100 ps of MD simulations on the PDE2A-ligand complexes were performed without any constraint, whereas a harmonic constraint of 50 kcal mol−1 Å−2 was applied on the α-carbon atoms during the last ~1.4 ns MD simulations. We used the constraint on the α-carbon atoms for a couple of reasons. First, the MD simulation on the free PDE2A structure (see below for the results) revealed that the positions of the α-carbon atoms in the simulated free protein were very stable during the simulation process. In addition, it has been demonstrated37 that using certain constraint on α-carbon atoms of proteins can help to decrease the unnecessary fluctuations of the binding free energies calculated using different snapshots (see below for the binding free energy calculations). The atomic coordinates of the simulated complex were saved every 1 ps.
Binding free energy calculation
The obtained stable MD trajectory for each PDE2A-ligand complex was used to estimate the binding free energy (ΔGbind) by using the Sietraj program.55 The program calculates the solvated interactions energies (SIE) using five terms and three parameters that were fitted to reproduce the binding free energies of a data set of 99 ligand protein complexes by Naim et al.55 The Sietraj is a substitute of molecular mechanism/Poisson-Boltzmann surface area (MM/PBSA) method.56 The SIE method has been used for the protein-small molecule ligands and protein-protein complex and give absolute binding affinity predictions in excellent agreement with experiment data.57–58 The SIE calculates the intermolecular coulomb and van der Waals interaction energies in the bound state, and the electrostatic contribution for solvation free energy to the binding is the difference of reaction field energy between the bound and free states of the enzyme. According to the SIE approach, the reaction field (RF) energy is determined by solving the Poisson equation with the boundary element method,59 and the atomic radii used in the RF calculation are scaled up with a scaling factor of 1.1. The internal dielectric constant of 2.25 and a solvent dielectric constant of 78.5 were used. The package calculates the binding free energy ΔGbind by using formulate following empirical equation:
| (1) |
In Eq.(1), ECoul and EvdW are for the intermolecular coulomb (electrostatic term) and van der Waals interaction energies, respectively, in the bound state. ΔGRF is the contribution from the electrostatic part of the solvation, determined by the reaction field (RF) calculations. ΔGnp is the contribution from the nonpolar solvation, which proportional to the solvent accessible surface area (ΔSA) according to Eq.(2).
| (2) |
In Eqs.(1) and (2), α,γ, and C are empirical parameters. The standard parameter values (α = 0.104758, γ = 0.012894 kcal/mol.Å2, and C = −2.89 kcal mol−1) available in the Sietraj program were used in the present study. In addition, we also examined whether the SIE results can be improved further by refining these parameters for the PDE2A inhibitors (see below for the discussion).
For each MD-simulated PDE2A-ligand complex, we calculated the ΔGbind values for 100 snapshots of the MD trajectory (one snapshot for each 2 ps during the last 200 ps of the stable trajectory). The final ΔGbind value was determined to be the average of the ΔGbind values calculated for the 100 snapshots.
Binding energy decomposition
For the purpose of binding energy decomposition, we also estimated the binding energies by using molecular mechanism/Generalized Born surface area (MM/GBSA) method implemented in Amber9 program56, 60–61 We used the MM/GBSA, rather than MM/PBSA, for binding energy decomposition because no algorithm was available for binding energy decomposition within the MM/PBSA calculations. Our MM/GBSA calculation for each snapshot was carried out in the same way as in other protein-ligand systems.61–63 Briefly, the MM/GBSA method can be conceptually summarized by the following equations:
| (3) |
| (4) |
| (5) |
| (6) |
ΔGcomplex, ΔGprotein, and ΔGlig are the free energy changes of the complex, protein, and ligand, respectively. Each free energy change from Eq.(3) was calculated by summing the gas phase internal energy (Egas), the solvation free energy (Gsol), and the entropy term (−TS) in Eq.(4). Egas is the standard force field energy, including the internal energy as well as the non-covalent van der Waals and electrostatic energies (Eq.(5)). The solvation free energy, Gsol, was calculated using the GB/SA model, which decomposes the solvation free energy into the sum of the electrostatic component (GGB) and non-polar component (Gnp) (Eq.(6)).
The electrostatic component GGB was calculated by using Hawkins, Cramer, and Truhlar’s pairwise, generalized Born model64–65 implemented in the Amber9 program. Linear combinations of pairwise overlaps (LCPO) method was used to calculate the solvent accessible surface area (ΔSA) and evaluate the ΔGnp value with γ = 0.005 kcal/molÅ−2 and β= 0.00 kcal/mol,47
| (7) |
Since the calculation of the entropic contribution (−TΔS) requires several approximations and provides only a rough estimate, especially in the case of a simulation in which only a small portion of the protein moves, we calculated only the binding energy neglecting the entropic contribution for the purpose of binding energy decomposition.
Results and Discussion
Binding structures
The binding modes of 11 representative benzo[1,4]diazepin-2-one derivatives have been studied by performing molecular docking. The structures of these 11 inhibitors of PDE2A were selected because they present an adequate structural variability and cover a large inhibitory activity ranging from 2.2 μM (the least active) to 6 nM (the most active one). Molecular docking revealed that all of these inhibitors bind with PDE2A in a similar mode; the superposition of the docked binding structures for the 11 inhibitors can be seen in Supporting Information (Figure S1). The subsequent MD simulations indicate that the docked binding structures were dynamically stable. The MD-simulated most favorable PDE2A-inhibitor binding structures, along with the stable MD trajectories, for compounds 1 and 3 are depicted in Figures 1 and 2. The stable MD trajectories obtained for compounds 2 and 4 to 11 are provided as Supporting Information (Figures S2 to S10).
Figure 1.
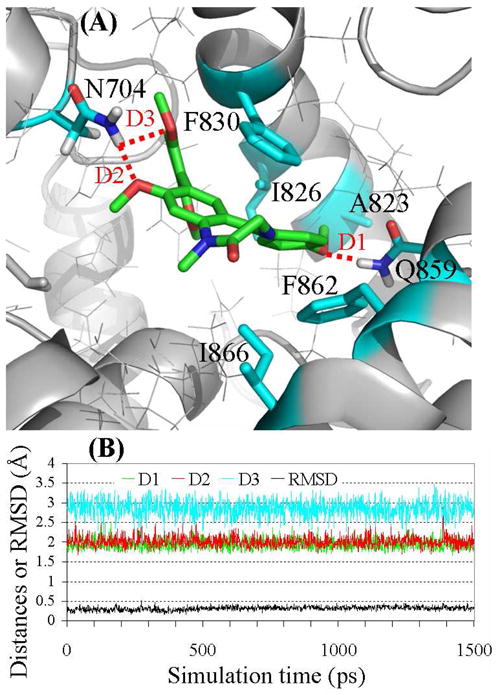
(A) Ribbon diagram for the binding mode of the MD-simulated structure of compound 1 in the active site pocket of PDE2A. The intermolecular hydrogen bonds are highlighted in dashed red line. (B) Plots of the MD-simulated internuclear distances and RMSD for atomic positions of the ligand versus the simulation time for PDE2A binding with compound 1. Trace D1 represents the internuclear distance between the oxygen of the methoxy group (R4) and a hydrogen atom of the amine group in Gln859 side chain. Trace D2 represents the internuclear distance between the oxygen of the methoxy group (R2) and a hydrogen atom of the amine group in Asn704 side chain. Trace D3 refers to the simulated partial hydrogen bond between the oxygen of a methoxy group in R3 and a hydrogen atom of the amine group in Asn704 side chain, with the H···O distance ranging from 1.96 to 3.47 Å (average: ~2.85 Å).
Figure 2.

(A) Ribbon diagram for the binding mode of the MD-simulated structure of compound 3 in the active site pocket of PDE2A. The intermolecular hydrogen bonds are highlighted in dashed red line. (B) Plots of MD-simulated internuclear distances and RMSD for atomic positions of the ligand versus the simulation time for PDE2A binding with compound 3. Traces D1 and D2 represent the H···O distances associated with a pair of hydrogen bonds (N-H···O) between the amide group in R4 and the amide group of Gln859 side chain. Trace D3 refers to the internuclear distance between the oxygen of the methoxy group (R2) and the hydrogen of the amine group of Asn704 side chain.
The MD-simulated binding structures revealed that each of the PDE2 inhibitors (1 to 11) was stabilized in a cavity formed by Phe830, Phe862, Ile826, Ile866, Gln859, Asn704, Leu809, Leu770, Leu858, His656, and Tyr655 residues. Notably, the common scaffold (i.e. benzo[1,4]diazepin-2-one) of all inhibitors (1 to 11) was parallel to the phenyl rings of Phe830 and Phe862 and forms π-π stacking interactions. Favorable hydrogen bonds between PDE2A and functional groups R2, R3, and R4 have been identified for some of these inhibitors. Notably, when R2 is a methoxy group (compounds 1, 3, and 5 to 7), the oxygen atom in R2 forms a hydrogen bond with the amine group of Asn704 side chain. The same amine group of Asn704 side chain may also have a loose hydrogen bond with the oxygen atom in one of the methoxy groups in R3 when R3 = (2,6-DiMeO)Ph. Particularly, in the simulated binding structure with 9, the simulated H···O distances ranged from 1.82 to 3.21 Å (average: ~2.33 Å) and < 2.50 Å for ~83% snapshots. The partial hydrogen bonds were also observed in the simulated binding structures with compounds 1 and 4, but not with compounds 2, 3, and 8. Concerning the hydrogen bonding with R4, compounds 1 and 2 have a methoxy group as R4. The oxygen atom of the methoxy group (R4) forms a hydrogen bond with the amine group of Gln859 side chain, while the methyl group in R4 is stabilized in a hydrophobic pocket surround by Ile826, Ala823, and Tyr827 residues, as depicted in Figure 1. R4 has an amide group in compounds 3 to 6 and 10, and the amide group forms two hydrogen bonds with the amide group of Gln859 side chain, as depicted in Figure 2. In compound 7, R4 = CH2OCH3 in which the oxygen atom forms a hydrogen bond with the amine group of Gln859 side chain. In compounds 9 and 11, R4 is C≡N in which the nitrogen atom has a loose hydrogen bond with the amine group of Gln859 side chain.
Binding free energies
The binding free energies calculated for the 11 compounds with PDE2A are summarized in Table 2 in comparison with the corresponding binding free energies derived from the experimental data.36 A survey of the data listed in Table 2 reveals that the binding free energies (ΔGbindSIE) calculated by using the SIE method are all in good agreement with the corresponding experimental binding free energies (ΔGbindexp), whereas the binding free energies (ΔGbindGBSA) calculated by using the MM/GBSA method neglecting the entropic contribution are all much lower than the corresponding ΔGbindexp values.
Table 2.
Calculated binding free energies in comparison with available experimental data (all in kcal/mol)
| Compound | Nonpolar contributiona |
Polar contributiona |
MMa | ΔGbindSIEa | ΔGbindGBSAb | ΔGbindexpc | ||
|---|---|---|---|---|---|---|---|---|
| vdW | np | Coul | RF | |||||
| 1 | −59.5 | −9.2 | −9.4 | 5.6 | −68.9 | −10.5 (−11.6) | −43.8 (−11.4) | −11.4 |
| 2 | −55.8 | −8.6 | −8.7 | 5.8 | −64.5 | −9.9 (−10.9) | −42.5 (−10.6) | −10.8 |
| 3 | −53.6 | −8.9 | −9.2 | 5.86 | −62.8 | −9.8 (−10.7) | −41.6 (−10.1) | −10.7 |
| 4 | −53.9 | −8.8 | −7.4 | 5.94 | −61.3 | −9.6 (−10.5) | −40.8 (−9.6) | −10.5 |
| 5 | −52.7 | −8.0 | −6.0 | 6.01 | −58.8 | −9.3 (−10.0) | −41.8 (−10.2) | −10.2 |
| 6 | −48.2 | −8.4 | −5.1 | 5.8 | −53.3 | −8.8 (−9.5) | −41.1 (−9.8) | −9.7 |
| 7 | −45.6 | −8.3 | −6.1 | 7.61 | −51.7 | −8.4 (−9.0) | −41.5 (−10.0) | −9.1 |
| 8 | −45.6 | −8.9 | −2.2 | 6.78 | −47.8 | −8.1 (−8.7) | −40.5 (−9.4) | −8.8 |
| 9 | −44.9 | −8.9 | −4.7 | 8.71 | −49.6 | −8.1 (−8.7) | −39.4 (−8.8) | −8.7 |
| 10 | −42.4 | −7.6 | −4.2 | 6.05 | −46.6 | −7.9 (−8.5) | −39.1 (−8.6) | −8.3 |
| 11 | −39.8 | −8.0 | −2.1 | 4.8 | −41.9 | −7.6 (−8.1) | −37.3 (−7.6) | −7.9 |
Results calculated with the SIE method using the standard parameters. The values in parentheses are the corresponding binding free energies calculated using the new parameter values refined in the present work. The listed individual contributions are intermolecular van der Waals interactions (vdW), intermolecular coulomb interactions (Coul), molecular mechanical energy (MM), change in nonpolar solvation energy (np), and change in reaction field energy (RF).
Directly calculated binding energies with MM/GBSA method neglecting the entropic contribution. The values in parentheses are the binding free energies calculated by using Eq.(8).
Binding free energies derived from the experimental IC50 values in ref. 36
As seen in Table 2 and Figure 3A, the ΔGbindSIE values are all qualitatively consistent with the ΔGbindexp values in terms of relative binding free energies for different inhibitors. Quantitatively, the average unsigned deviation between the experimental ΔGbindexp values and the ΔGbindSIE values calculated by using the standard parameters is ~0.7 kcal/mol. The correlation between the ΔGbindexp and ΔGbindSIE values is excellent, with a correlation coefficient (R) of 0.993 and RMSD of 0.13 kcal/mol.
Figure 3.

(A) Correlation between the experimental binding free energy (ΔGbindexp) and the binding free energy (ΔGbindSIE) calculated with the standard parameter values for the 11 inhibitors. (B) Binding energy contributions from key residues of PDE2A estimated from the binding energy decomposition.
In addition, we also examined the SIE parameters for the PDE2A inhibitors and the calculated results can be improved further by refining the parameter values for these 11 inhibitors involved in this study. The least-squares fitting for these 11 inhibitors led to a new set of the SIE parameter values, i.e. α = 0.123627, γ = 0.0177895 kcal/mol.Å2, and C = −2.15 kcal mol−1. The ΔGbindSIE values obtained from the use of the refined parameter values are also listed in Table 2 for comparison. As seen in Table 2, the ΔGbindSIE values calculated by using the refined SIE parameter values are in excellent agreement with the corresponding ΔGbindexp values, with an average deviation of only ~0.1 kcal/mol.
Concerning the binding free energies (ΔGbindGBSA) calculated by using the MM/GBSA method, the large deviations of the directly calculated ΔGbindGBSA values from the corresponding experimental values (ΔGbindexp) can also be corrected by using an empirical linear correlation relationship. Based on the ΔGbindGBSA and ΔGbindexp values in Table 2, we obtained
| (8) |
with a correlation coefficient (R) of 0.893 and RMSD of 0.50 kcal/mol. In Eq.(8), ΔGbindGBSA(calc.) is the directly calculated ΔGbindGBSA value, and ΔGbindGBSA(corrected) is the ΔGbindGBSA value corrected by using the empirical correction. The corrected ΔGbindGBSA values are also listed in Table 2. As seen in Table 2, the corrected ΔGbindGBSA values are also in good agreement with the corresponding experimental data.
Unless explicitly indicated otherwise, the overall binding free energies mentioned in the discussion below will always refer to the directly calculated ΔGbindSIE values, whereas the binding energy decomposition will always be based on the MM/GBSA calculations.
Factors affecting the binding free energy
In order to analyze the individual contributions to the binding free energies for these 11 compounds, the individual polar (Coul and RF) and nonpolar (vdW and np) contributions calculated by using the SIE method are also listed in Table 2. It can be seen from the Table 2 that the primary contribution (~85%) to ΔGbindSIE comes from the nonpolar interaction, particularly the vdW term, for all of the 11 compounds. The favorable nonpolar free energy terms are consistent with the structural feature of various hydrophobic residues of PDE2A found at the interface with the bound inhibitors. As observed in the PDE2A-ligand binding, the common benzo[1,4]diazepin-2-one scaffold structure of the inhibitors is lodged in the hydrophobic pocket surrounded by the side chains of Ile826, Ile866, Phe830, and Phe862 residues, causing a high degree of surface complementarities.
Further, in order to explain which residues generate significant intermolecular interaction contributions to the binding with the ligands and explore which type of substituent of the ligands can significantly improve the binding affinity with PDE2A, the decomposition of the electrostatic interaction energy, vdW energy, and solvation free energy for five representative compounds (1 to 4 and 10) were analyzed and the results are depicted in Figure 3B. The numerical data are provided as Supporting Information (Table S1). Our binding energy decomposition was based on the MM/GBSA method, because the MM/GBSA results can naturally be used for the energy decomposition and because our recently reported studies66 on other protein-ligand binding systems demonstrated that the MM/GBSA based binding energy decomposition led to satisfactory results in comparison with the corresponding experimental data. The per-atom contributions were summed over all atoms of each residue to obtain the contribution of each residue to the total binding free energy.67 Thus, the contributions from individual functional groups were calculated at the atomic level using the MM/GBSA method.68
Figure 3B shows that the side chains of Phe830, Phe862, Ile826, Gln859, Ile866, and Asn704 residues have the largest contributions to the binding energy, suggesting that these residues play an important role in the binding interaction. The binding energy decomposition highlights the contributions from the network of π-π interactions, such as sandwich-like stacking structure between the common benzo[1,4]diazepin-2-one scaffold of the ligands and the side chains of Phe830 and Phe862 residues. These residues have the largest contributions and have almost equal binding energy contributions for all of the PDE2A-ligand binding complexes examined. The binding energy contributions from Phe830 and Phe862 residues are ~4.0 and ~3.0 kcal/mol (in average), respectively, and primarily through the vdW energy term (Table S1 in the Supporting Information).
According to the MD-simulated structures of PDE2A-ligand complexes, the phenyl ring bonded with R4 is stabilized by a dipole-quadrupole interaction with Ile826 side chain, while R1 is involved in hydrophobic interaction with Ile866 side chain. The observed large energy contributions associated with these hydrophobic residues suggest that the protein-ligand binding is favored when R1 is a hydrophobic functional group.
In addition, it is essential for future rational design of more potent PDE2 inhibitors to examine which types of substituents of the ligand (i.e. the identities of R1 to R4) can more favorably enhance the binding affinity through a detailed comparison between some representative inhibitors with different types of substituents. It appears that the amide of Asn704 and Gln859 side chains play an important role in maintaining the ligand binding into the PDE2A active site, which is indicated by the energy decomposition results depicted in Figure 3B and can be seen from the analysis below.
Comparison between compounds 1 and 2
The only difference in structure between these two compounds exists in R2, which is a methoxy group in compound 1 and a hydrogen atom in compound 2. The binding free energy calculated for 1 with PDE2A is lower than that for 2 by ~0.6 kcal/mol due to the methoxy group substitution (Table 2). It can be seen from the PDE2A-ligand complex in Figure 4 that the residue nearest to R2 is Asn704. Thus, the enhancement of the binding free energy for 1 compared to 2 can be described by the presence of a stable hydrogen bond between the oxygen atom of the methoxy group and amine group of Asn704 side chain (Figure 4A), with an average H···O distance of ~1.99 Ǻ. This favorable hydrogen bonding interaction is supported by the binding energy decomposition per residues (Figure 3B), showing that the Asn704 residue contributes ~−1.9 kcal/mol to the total binding energy for 1 and only ~−0.2 kcal/mol for 2 (Table S1 in the Supporting Information). The difference of ~1.7 kcal/mol in favor of 1 primarily coming from electrostatic interaction term is consistent with the hydrogen bond analysis.
Figure 4.

Stick view of the binding modes of compounds 1 (A), 2 (B), 4 (C), and 10 (D) with PDE2A. The intermolecular hydrogen bonds are indicated in dashed purple line with the average distances (Å).
Comparison between compounds 1 and 3
The structural difference between compounds 1 and 3 exists only in R4. Based on the simulated binding structures (see Figure 5), the amide group of Gln859 side chain forms a pair of hydrogen bonds with the amide group of 3, whereas the same group of Gln859 side chain forms only one hydrogen bond with the methoxy group of 1. However, the hydrogen bond with the methoxy group of 1 is shorter, with an average H···O distance of ~1.93 Ǻ. The hydrogen bonds with the amide group of 3 are all longer, with average H···O distances of ~2.05 and ~2.16 Ǻ. Based on the average H···O distances alone, it was unclear whether the two weaker hydrogen bonds with the amide group of 3 should be more favorable than the single hydrogen bond with the methoxy group of 1. The calculated overall binding free energies for compounds 1 and 3 reveal that, as R4, the amide group (in 3) should be less favorable than the methoxy group (in 1) by ~0.7 kcal/mol, which is consistent with the experimental data as seen in Table 2.
Figure 5.

Stick view of the binding modes of compounds 1 (A) and 3 (B) with PDE2A. The intermolecular hydrogen bonds are indicated in dashed purple line with the average distances (Å). The hydrophobic cavity surrounded by Ile826, Ala823, and Tyr827 side chains around the methoxy or amide group (R4) is displayed with the vdW surface.
To better understand the difference in the binding affinity with PDE2A between these two compounds, we analyzed the data from the binding energy decomposition. The binding energy contribution of Gln859 residue mainly comes from the favorable electrostatic interaction and unfavorable polar solvation terms (Table S1 in the Supporting Information). Thus, the contribution of the electrostatic interaction energy to the binding for 1 is higher than that for 3 by ~0.5 kcal/mol, while the magnitude of polar solvation term for 1 is lower than that for 3 by ~0.7 kcal/mol, suggesting that the desolvation penalty for 3 is larger than that for 1. The unfavorable desolvation penalty outweighs the favorable electrostatic interaction for 3 compared to 1. Hence, 3 should have a lower binding affinity with PDE2A compared to 1. A closer look at the detailed binding structures reveals that R4 is located in a hydrophobic environment composed of Ile826, Ala823, and Tyr827 residues (Figure 5A), and the desolvation penalty for the methoxy group of 1 is lower than that for the amide group of 3 (Table S1 in the Supporting Information).
In addition, we also examined the relative magnitudes of the unfavorable desolvation penalty for compounds 2, 4, and 10 (Table S1 in the Supporting Information). The desolvation energy penalty (i.e. the contribution to the total binding energy) associated with by Gln859 residue is ~1.4, ~2.1, and ~2.1 kcal/mol for 2 (R4 = methoxy), 4 (R4 = amide), and 10 (R4 = amide), respectively. Thus, the calculated desolvation penalty for 1 or 2 with the methoxy group is always lower than that for 3, 4, or 10 with the amide group by about ~0.7 kcal/mol.
Comparison between compounds 4 and 10
The structural difference between these two compounds is the presence of 2,6-DiMeO groups on the phenyl ring of R3 in compound 4 (Figure 4C and D). The binding free energies calculated for 4 and 10 are ~−9.6 and ~−7.9 kcal/mol, respectively. According to the individual energy components of the binding free energies (Table 2), the primary favorable contributor to the ligand binding is the van der Waals interaction.
From energetic point of view, the relative binding free energy calculated for 4 compared to 10 decreases by ~1.7 kcal/mol due to the presence of the 2,6-DiMeO groups in R3. The corresponding difference between the experimental binding free energies is ~2.1 kcal/mol, which is qualitatively consistent with the computational results. As revealed in the MD-simulated binding structures, the oxygen atom in one of these two methoxy groups in compound 4 has a loose (partial) hydrogen bond with the amine group of Asn704 side chain; the simulated H···O distances ranged from 1.88 to 3.57 Å (average: ~2.66 Å) and < 2.50 Å for ~32% snapshots (Figure 4C). In addition, the methyl group of the other methoxy group in R3 has a favorable dipole-quadrupole interaction with the phenyl group of Tyr655 residue and this interaction has an extra contribution to the binding free energy for 4 compared to 10.
The binding energy decomposition also shows that Asn704 contributes favorably by ~−0.9 kcal/mol to the total binding energy for 4, whereas the energetic contribution of Asn704 is unfavorable (~0.3 kcal/mol) for 10 (Table S1 in the Supporting Information). Thus, both the geometrical and energetic results indicate that (2,6-DiMeO)Ph group as R3 is more favorable for the binding affinity with PDE2A.
Insights for future design of more potent inhibitors
The computational results discussed above have demonstrated some important, favorable interactions between PDE2A and its 11 representative inhibitors: (1) the π-π stacking interactions between the common benzo[1,4]diazepin-2-one scaffold of the inhibitors and the phenyl rings of Phe830 and Phe862; (2) the protein-ligand hydrogen bonding involving R2 (when R2 = methoxy), R3 (when R3 = (2,6-DiMeO)Ph), and R4 (when R4 = methoxy or amide); (3) the hydrophobic interactions with R1 and R4. It is remarkable to note that a same substituent (R4) can be involved in both the hydrogen bonding and hydrophobic interactions with the protein. It is essential for rational design of new, more potent inhibitors of PDE2A to carefully account for all of these favorable intermolecular interactions. For example, a potent inhibitor should at least maintain the essential π-π stacking interactions between the common benzo[1,4]diazepin-2-one scaffold of the inhibitors and the phenyl rings of Phe830 and Phe862 and have R2, R3, and R4 hydrogen-bonded with the key residues of PDE2A. Meanwhile, the hydrophobic interactions with R1 and R4 should be optimized while maintaining the favorable π-π stacking and hydrogen bonding interactions during the rational design process.
Specially, for the hydrogen bonding between a specific substituent (R2, R3, or R4) and PDE2A, multiple hydrogen bonds might not necessarily be more favorable than a single hydrogen bond for a couple of reasons. First of all, the overall strength of the multiple hydrogen bonds with a substituent might not necessarily be stronger than that of the single one. In addition, with the substituent change, one should also account for the possible change in the hydrophobic interactions associated with the change in hydrogen bonding interactions. The aforementioned structural and energetic results highlight the crucial contributions of the solvation energy term associated with the presence of hydrophobic residues around R4 (the methoxy or amide group) which hydrogen-bonds with the amide group of Gln859 side chain. It is fundamentally important to identify a more favorable functional group as R4 of the ligand in rational design of new, more potent inhibitors of PDE2A. The ideal substituent as R4 is expected to simultaneously have the strongest possible hydrogen bonding interaction with Gln859 side chain and favorable hydrophobic interactions with Ile826, Ala823, and Tyr827 residues.
Conclusion
The combined molecular docking, molecular dynamics (MD) simulations, binding free energy calculations, and binding energy decompositions provide valuable insights into the detailed binding of PDE2A with a promising series of inhibitors, i.e. benzo[1,4]diazepin-2-one derivatives. The MD-simulated enzyme-inhibitor binding structures have revealed important, favorable interactions between PDE2A and the inhibitors, including (1) the π-π stacking interactions between the common benzo[1,4]diazepin-2-one scaffold of the inhibitors and the phenyl rings of Phe830 and Phe862; (2) the protein-ligand hydrogen bonding involving R2, R3, and R4 of the inhibitors; and (3) the hydrophobic interactions with R1 and R4 of the inhibitors. It is remarkable to note that a same substituent (R4) can be involved in both the hydrogen bonding and hydrophobic interactions with PDE2A. It is essential for rational design of more potent inhibitors of PDE2A to carefully account for all of these favorable intermolecular interactions. Based on the MD-simulated enzyme-inhibitor binding structures, the calculated binding free energies are in good agreement with the experimental activity data for all benzo[1,4]diazepin-2-one derivatives examined in this study. The determined enzyme-inhibitor binding modes along with the agreement between the calculated and experimental results provide a solid base for future rational design of new, more potent inhibitors of PDE2A.
Supplementary Material
Acknowledgments
This work was supported in part by the NIH (grant RC1MH088480 to C.-G. Zhan). The work was carried out in Zhan’s laboratory for this project at the University of Kentucky, where Yang worked as an exchange graduate student from Beijing Normal University. The authors acknowledge the Center for Computational Sciences (CCS) at the University of Kentucky for supercomputing time on IBM X-series Cluster with 340 nodes or 1,360 processors.
Footnotes
Supporting Information Available: Figures and Table for the more detailed information about the simulated PDE2A-inhibitor binding structures and the results from the binding energy decomposition. This material is available free of charge via the Internet at http://pubs.acs.org.
References
- 1.Manganiello VC, Degerman E. Thrombosis and Haemostasis. 1999;82:407–411. [PubMed] [Google Scholar]
- 2.Fawcett L, Baxendale R, Stacey P, McGrouther C, Harrow I, Soderling S, Hetman J, Beavo JA, Phillips SC. PNAS. 2000;97:3702–3707. doi: 10.1073/pnas.050585197. [DOI] [PMC free article] [PubMed] [Google Scholar]
- 3.Beavo JA, Brunton LL. Nat Rev Mol Cell Biol. 2002;3:710–718. doi: 10.1038/nrm911. [DOI] [PubMed] [Google Scholar]
- 4.Laddha SS, Wadodkar SG, Meghal SK. Med Chem Res. 2009;18:268–276. [Google Scholar]
- 5.Bender AT, Beavo JA. Pharmacol Rev. 2006;58:488–520. doi: 10.1124/pr.58.3.5. [DOI] [PubMed] [Google Scholar]
- 6.Huang Z, Mancini JA. Curr Med Chem. 2006;13:3253–3262. doi: 10.2174/092986706778773040. [DOI] [PubMed] [Google Scholar]
- 7.Lugnier C. Pharmacology & therapeutics. 2006;109:366–398. doi: 10.1016/j.pharmthera.2005.07.003. [DOI] [PubMed] [Google Scholar]
- 8.Mennit FS, Faraci WS, Schmidt CJ. Nat Rev Drug Discov. 2006;5(8):660–670. doi: 10.1038/nrd2058. [DOI] [PubMed] [Google Scholar]
- 9.Ke H, Wang H. Curr Top Med Chem. 2007;7:391–403. doi: 10.2174/156802607779941242. [DOI] [PubMed] [Google Scholar]
- 10.Hofgen N, Stange H, Schindler R, Lankau H-J, Grunwald C, Langen B, Egerland U, Tremmel P, Pangalos MN, Marquis KL, Hage T, Harrison BL, Malamas MS, Brandon NJ, Kronbach T. Journal of Medicinal Chemistry. 2010;53:4399–4411. doi: 10.1021/jm1002793. [DOI] [PubMed] [Google Scholar]
- 11.Wang P, Wu P, Myers JG, Stamford A, Egan RW, Billah MM. Life Sciences. 2001;68:1977–1987. doi: 10.1016/s0024-3205(01)00989-4. [DOI] [PubMed] [Google Scholar]
- 12.Rosman GJ, Martins TJ, Sonnenburg WK, Beavo JA, Ferguson K, Loughney K. Gene. 1997;191:89–95. doi: 10.1016/s0378-1119(97)00046-2. [DOI] [PubMed] [Google Scholar]
- 13.Martins TJ, Mumby MC, Beavog JA. The Journal of Biological Chemistry. 1982;257:1973–1979. [PubMed] [Google Scholar]
- 14.Yamamoto T, Manganiello VC, Vaughan M. The Journal of Biological Chemistry. 1983;258:12526–12533. [PubMed] [Google Scholar]
- 15.Iffland A, Kohls D, Low S, Luan J, Zhang Y, Kothe M, Cao Q, Kamath AV, Ding YH, Ellenberger T. Biochemistry. 2005;44:8312–8325. doi: 10.1021/bi047313h. [DOI] [PubMed] [Google Scholar]
- 16.Xu RX, Hassell AM, Vanderwall D, Lambert MH, Holmes WD, Luther MA, Rocque WJ, Milburn MV, Zhao Y, Ke H, Nolte RT. Science. 2000;288:1822–1825. doi: 10.1126/science.288.5472.1822. [DOI] [PubMed] [Google Scholar]
- 17.Wang H, Liu Y, Hou J, Zheng M, Robinson H, Ke H. PNAS. 2007;104:5782–5787. doi: 10.1073/pnas.0700279104. [DOI] [PMC free article] [PubMed] [Google Scholar]
- 18.Wang H, Robinson H, Ke H. J Mol Biol. 2007;371:302–307. doi: 10.1016/j.jmb.2007.05.060. [DOI] [PMC free article] [PubMed] [Google Scholar]
- 19.Liu S, Mansour MN, Dillman KS, Perez JR, Danley DE, Aeed PA, Simons SP, LeMotte PK, Menniti FS. PNAS. 2008;105:13309–13314. doi: 10.1073/pnas.0708850105. [DOI] [PMC free article] [PubMed] [Google Scholar]
- 20.Zhan CG, Zheng F. J Am Chem Soc. 2001;123:2835–2838. doi: 10.1021/ja005529a. [DOI] [PubMed] [Google Scholar]
- 21.Salter EA, Wierzbicki A, Sperl G, Thompson WJ. International Journal of Quantum Chemistry. 2004;96:402–410. [Google Scholar]
- 22.Lawrenz ME, Salter EA, Wierzbicki A, Thompson WJ. International Journal of Quantum Chemistry. 2005;105:410–415. [Google Scholar]
- 23.Xiong Y, Lu HT, Li Y, Yang GF, Zhan CG. Biophysical Journal. 2006;91:1858–1867. doi: 10.1529/biophysj.106.086835. [DOI] [PMC free article] [PubMed] [Google Scholar]
- 24.O’brien KA, Salter EA, Wierzbicki A. International Journal of Quantum Chemistry. 2007;107:2197–2203. doi: 10.1002/qua.23020. [DOI] [PMC free article] [PubMed] [Google Scholar]
- 25.Salter EA, Wierzbicki A. J Phys Chem B. 2007;111:4547–4552. doi: 10.1021/jp066582+. [DOI] [PubMed] [Google Scholar]
- 26.Zagrovic B, van Gunsteren WF. J Chem Theory Comput. 2007;3:301–311. doi: 10.1021/ct600322d. [DOI] [PubMed] [Google Scholar]
- 27.Salter EA, O’brien KA, Edmunds RW, Wierzbicki A. International Journal of Quantum Chemistry. 2008;108:1189–1199. [Google Scholar]
- 28.Xiong Y, Lu HT, Zhan CG. Journal of Computational Chemistry. 2008;29:1259–1267. doi: 10.1002/jcc.20888. [DOI] [PubMed] [Google Scholar]
- 29.Lu HT, Goren AC, Zhan CG. J Phys Chem B. 2010;114:7022–7028. doi: 10.1021/jp911527y. [DOI] [PMC free article] [PubMed] [Google Scholar]
- 30.Yang GF, Lu HT, Xiong Y, Zhan CG. Bioorganic & Medicinal Chemistry. 2006;14:1462–1473. doi: 10.1016/j.bmc.2005.09.073. [DOI] [PubMed] [Google Scholar]
- 31.Masood A, Huang Y, Hajjhussein H, Xiao L, Li H, Wang W, Hamza A, Zhan CG, O’Donnell JM. The Journal of Pharmacology and Experimental Therapeutics. 2009;331:690–699. doi: 10.1124/jpet.109.156729. [DOI] [PMC free article] [PubMed] [Google Scholar]
- 32.Reneerkens OAH, Rutten K, Steinbusch HWM, Blokland A, Prickaerts J. Psychopharmacology. 2009;202:419–443. doi: 10.1007/s00213-008-1273-x. [DOI] [PMC free article] [PubMed] [Google Scholar]
- 33.Podzuweit T, Nennstiel P, Moller A. Cellular Signalling. 1995;7:733–738. doi: 10.1016/0898-6568(95)00042-n. [DOI] [PubMed] [Google Scholar]
- 34.Boess FG, Hendrix M, van der Staay FJ, Erb C, Schreiber R, Staveren Wv, Vente Jd, Prickaerts J, Blokland A, Koenig G. Neuropharmacology. 2004;47:1081–1092. doi: 10.1016/j.neuropharm.2004.07.040. [DOI] [PubMed] [Google Scholar]
- 35.Seybold J, Thomas D, Witzenrath M, Boral S, Hocke AC, Burger A, Hatzelmann A, Tenor H, Schudt C, Krull M, Schutte H, Hippenstiel S, Suttorp N. Blood. 2005;105:3569–3576. doi: 10.1182/blood-2004-07-2729. [DOI] [PubMed] [Google Scholar]
- 36.Abarghaz M, Biondi S, Duranton J, Limanton E, Mondadori C, Wagner P. Benzo1,4diazepin-2-one derivatives as phosphodiesterase PDE2 inhibitors, preparation and therapeutic thereof. 2005063723. WO. 2005
- 37.Hamza A, Zhan C-G. Journal of Physical Chemistry B. 2009;113(9):2896–2908. doi: 10.1021/jp8082612. [DOI] [PubMed] [Google Scholar]
- 38.Singh UC, Kollman PA. Journal of Computational Chemistry. 1984;5:129–145. [Google Scholar]
- 39.Besler BH, Merz KM, Kollman PA. Journal of Computational Chemistry. 1990;11:431–439. [Google Scholar]
- 40.Frisch MJ, Trucks GW, Schlegel HB, Scuseria GE, Robb MA, Cheeseman JR, Zakrzewski VG, Montgomery JA, Stratmann RE, Burant JC, Dapprich S, Millan JM, Daniels AD, Kudin KN, Strain MC, Farkas O, Tomasi J, Barone V, Cossi M, Cammi R, Mennucci B, Pomelli C, Adamo C, Clifford S, Ochterski J, Petersson GA, Ayala PY, Cui Q, Morokuma K, Malich DK, Rabuck AD, Raghavachari K, Foresman JB, Cioslowski J, Ortiz JV, Baboul AG, Stefanov BB, Liu G, Liashenko A, Piskorz P, Komaromi I, Gomperts R, Martin RL, Fox DJ, Keith T, Al-Laham MA, Peng CY, Nanayakkara A, Gonzales C, Challacombe M, Gill PMW, Johnson B, Chen W, Wong MW, Andreas JL, Head-Gordon M, Reploge ES, Pople JA. Gaussian 03, revision B-03. Gaussian, Inc; Pittsburgh, PA: 2003. [Google Scholar]
- 41.Fred, v. Fred. OpenEye Scientific Software, Inc. Santa Fe, NM, USA: 2007. http://www.eyesopen.com/ [Google Scholar]
- 42.McGann MR, Almond HR, Nicholls A, Grant JA, Brown FK. Biopolymers. 2003;68:76–90. doi: 10.1002/bip.10207. [DOI] [PubMed] [Google Scholar]
- 43.Eldridge MD, Murray CW, Auton TR, Paolini GV, Mee RP. Journal of Computer-Aided Molecular Design. 1997;11:425–445. doi: 10.1023/a:1007996124545. [DOI] [PubMed] [Google Scholar]
- 44.Gehlhaar DK, Verkhivker GM, Rejto PA, Sherman CJ, Fogel DB, Fogel LJ, Freer ST. Chemistry & Biology. 1995;2:317–324. doi: 10.1016/1074-5521(95)90050-0. [DOI] [PubMed] [Google Scholar]
- 45.Stahl M, Rarey M. J Med Chem. 2001;44:1035–1042. doi: 10.1021/jm0003992. [DOI] [PubMed] [Google Scholar]
- 46.Case DA, Darden TA, Cheatham TE, III, Simmerling CL, Wang JDR, Luo R, Merz KM, Pearlman DA, Crowley M, Walker RC, Zhang W, Wang B, Hayik S, Roitberg A, Seabra G, Wong KF, Paesani F, Wu X, Brozell S, Tsui V, Gohlke H, Yang L, Tan C, Mongan J, Hornak V, Cui G, Beroza P, Mathews DH, Schafmeister C, Ross WS, PA K. Amber 9. University of California; San Francisco, CA: 2006. [Google Scholar]
- 47.Harvey SC. Proteins. 1989;5:78–92. doi: 10.1002/prot.340050109. [DOI] [PubMed] [Google Scholar]
- 48.Guenot J, Kollman PA. Protein Science. 1992;1:1185–1205. doi: 10.1002/pro.5560010912. [DOI] [PMC free article] [PubMed] [Google Scholar]
- 49.Pearlman DA. AMBER 4.1. University of California; San Francisco, CA: 1995. [Google Scholar]
- 50.Jorgensen WI. J Am Chem Soc. 1981;103:335–340. [Google Scholar]
- 51.Pan Y, Gao D, Yang W, Cho H, Yang G, Tai HH, Zhan CG. Proc Natl Acad Sci USA. 2005;102:16656–16661. doi: 10.1073/pnas.0507332102. [DOI] [PMC free article] [PubMed] [Google Scholar]
- 52.Darden T, York D, Pedersen L. J Chem Phys. 1993;98:10089–10092. [Google Scholar]
- 53.Berendsen HJC, Postma JPM, van Gunsteren WF, DiNola A, Haak JR. J Chem Phys. 1984;81:3684–3690. [Google Scholar]
- 54.Ryckaert JP, Ciccotti G, Berendsen HJC. J Comput Phys. 1977;23:327–341. [Google Scholar]
- 55.Naim M, Bhat S, Rankin KN, Dennis S, Chowdhury SF, Siddiqi I, Drabik P, Sulea T, Bayly CI, Jakalian A, Purisima EO. J Chem Inf Model. 2007;47:122–133. doi: 10.1021/ci600406v. [DOI] [PubMed] [Google Scholar]
- 56.Kollman PA, Massova I, Reyes C, Kuhn B, Huo S, Chong L, Lee M, Lee T, Duan Y, Wang W, Donini O, Cieplak P, Srinivasan J, Case DA, Thomas E, Cheatham I. Acc Chem Res. 2000;33:889–897. doi: 10.1021/ar000033j. [DOI] [PubMed] [Google Scholar]
- 57.Cui Q, Sulea T, Schrag JD, Munger C, Hung MN, Naïm M, Cygler M, Purisima EO. J Mol Biol. 2008;379:787–802. doi: 10.1016/j.jmb.2008.04.035. [DOI] [PubMed] [Google Scholar]
- 58.Wang YT, Su ZY, Hsieh CH, Chen CL. J Chem Inf Model. 2009;49:2369–2375. doi: 10.1021/ci9002238. [DOI] [PubMed] [Google Scholar]
- 59.Purisima EO. Journal of Computational Chemistry. 1998;19:1494–1504. [Google Scholar]
- 60.Moreira IS, Fernandes PA, Ramos MJ. J Phys Chem B. 2006;110:10962–10969. doi: 10.1021/jp054760d. [DOI] [PubMed] [Google Scholar]
- 61.Hamza A, AbdulHameed MDM, Zhan C-G. J Phys Chem B. 2008;112:7320–7329. doi: 10.1021/jp8007688. [DOI] [PubMed] [Google Scholar]
- 62.Liu M, Cong XJ, Li P, Tan JJ, Chen WZ, Wang CX. Biopolymers. 2009;91:700–709. doi: 10.1002/bip.21211. [DOI] [PubMed] [Google Scholar]
- 63.Zoetea V, Irvingb MB, Michielin O. J Mol Recognit. 2010;23:142–152. doi: 10.1002/jmr.1005. [DOI] [PubMed] [Google Scholar]
- 64.Hawkins GD, Cramer CJ, Truhlar DG. Chem Phys Lett. 1995;246(1–2):122–129. [Google Scholar]
- 65.Hawkins GD, Cramer CJ, Truhlar DG. J Phys Chem. 1996;100(51):19824–19839. [Google Scholar]
- 66.Hamza A, Tong M, AbdulHameed MDM, Liu J, Goren AC, Tai H-H, Zhan C-G. J Phys Chem B. 2010;114:5605–5616. doi: 10.1021/jp100668y. [DOI] [PMC free article] [PubMed] [Google Scholar]
- 67.Zoete V, Meuwly M, Karplus M. Proteins: Structure, Function, and Bioinformation. 2005;61:79–93. doi: 10.1002/prot.20528. [DOI] [PubMed] [Google Scholar]
- 68.Gohlke H, Kiel C, Case DA. J Mol Biol. 2003;330:891–913. doi: 10.1016/s0022-2836(03)00610-7. [DOI] [PubMed] [Google Scholar]
Associated Data
This section collects any data citations, data availability statements, or supplementary materials included in this article.