Abstract
Undersampled spiral CSI (spCSI) using a free induction decay (FID) acquisition allows sub-second metabolic imaging of hyperpolarized 13C. Phase correction of the FID acquisition can be difficult, especially with contributions from aliased out-of-phase peaks. This work extends the spCSI sequence by incorporating double spin-echo radiofrequency (RF) pulses to eliminate the need for phase correction and obtain high quality spectra in magnitude mode. The sequence also provides an added benefit of attenuating signal from flowing spins, which can otherwise contaminate signal in the organ of interest. The refocusing pulses can potentially lead to a loss of hyperpolarized magnetization in dynamic imaging due to flow of spins through the fringe field of the RF coil, where the refocusing pulses fail to provide complete refocusing. Care must be taken for dynamic imaging to ensure that the spins remain within the B1-homogeneous sensitive volume of the RF coil.
Keywords: hyperpolarized 13C, dynamic metabolic imaging, pyruvate, spiral CSI
Introduction
Rapid chemical shift imaging (CSI) techniques are of considerable interest for metabolic imaging with hyperpolarized 13C-labeled substrates [1–10]. These methods allow dynamic imaging of metabolism in vivo and the quantitation of metabolic kinetics for a variety of normal and diseased states. Undersampled spiral CSI (spCSI) using a free induction decay (FID) acquisition mode has been applied to real-time metabolic imaging of 13C-pyruvate (Pyr) and its metabolic products lactate (Lac), alanine (Ala) and bicarbonate (Bic) with acquisition times of less than 1 s per slice [4]. Undersampled spCSI exploits the sparse spectrum by undersampling in the spectral domain to reduce the number of excitations. An appropriate choice of spectral bandwidth is necessary to avoid spectral overlap between aliased components. The FID acquisition necessitates phase correction during reconstruction for accurate spectral quantitation as the metabolite signals cannot be separated well in magnitude mode. This phase correction can be challenging, especially in undersampled spCSI due to contributions from aliased out-of-phase peaks. Chemical shift artifact results in blurring of the aliased components, and the dispersion mode signal contribution from the aliased peaks can hamper the quantitation of metabolite distributions, especially for peaks of low signal-to-noise ratio. In contrast, when a full spin echo is acquired, the magnitude spectrum has the same linewidth as absorption spectrum, hence eliminating the need for phase correction.
A double spin-echo (DSE) echo-planar spectroscopic imaging sequence has previously been applied to hyperpolarized 13C metabolic imaging [7–12]. The spin-echo sequences typically use adiabatic pulses for refocusing to be robust to errors in transmit gain calibration since adiabatic pulses produce the same flip angle over a range of B1 amplitudes as long as the adiabatic condition is met. A pair of adiabatic pulses is needed to rewind the non-linear phase across the spectrum produced by a single adiabatic refocusing pulse. This work extends the spiral CSI sequence to incorporate a double spin echo using a pair of adiabatic refocusing pulses, and compares DSE-spCSI to FID-spCSI in both single time-point and dynamic imaging of rat kidney. Cunningham et al [7] compared the single time-point DSE and FID acquisitions in a phantom. Though they presented the application of DSE in vivo for a single time-point study and in dynamic imaging with a phantom, there has not been a comparison of the DSE and FID acquisitions for dynamic imaging in vivo. The in vivo dynamic imaging comparison presented in this work provides an insight into the effect of refocusing pulses on flowing spins.
Method
The polarized sample comprised a mixture of 14-M [1-13C] pyruvic acid and 15-mM Ox063 trityl radical, to which a 50:1 dilution of ProHance (Bracco Diagnostics Inc., Princeton, NJ) was added prior to polarization. The sample was polarized using a HyperSense system (Oxford Instruments Molecular Biotools, Oxford, UK). Dynamic nuclear polarization with rapid dissolution [13] was used to achieve approximately 18–25% liquid-state polarization. The polarized sample was dissolved with a solution of 80 mM NaOH mixed with 40 mM TRIS buffer and 0.1 g/L EDTA-Na2, leading to a 80 mM solution of hyperpolarized pyruvate with a pH of 7.4–7.5. For in vivo experiments, 2.5–3 mL of the hyperpolarized pyruvate solution were injected manually into healthy male Wistar rats (n=5, 209–516 g body weight) through a tail vein catheter at a rate of approximately 0.25 mL/s. All procedures were approved by the Institutional Animal Care and Use Committee.
All experiments were performed on a clinical 3T Signa MR scanner (GE Healthcare, Waukesha, WI) equipped with self-shielded gradients (40 mT/m, 150 mT/m/ms). A cus- tom-built dual-tuned (1H/13C) quadrature rat coil (inner diameter=80 mm, length=90 mm), operating at 127.7 MHz and 32.1 MHz, respectively, was used for both radiofrequency (RF) excitation and signal reception. The transmit 13C RF power was calibrated using a reference phantom containing a solution of 13C-lactate, which was placed on top of the animal. Single-shot fast spin-echo 1H MR images with nominal in-plane resolution of 0.47 mm and 2-mm slice thickness were acquired in the axial, sagittal, and coronal planes throughout the scan session as anatomical references for prescribing the 13C-CSI experiments.
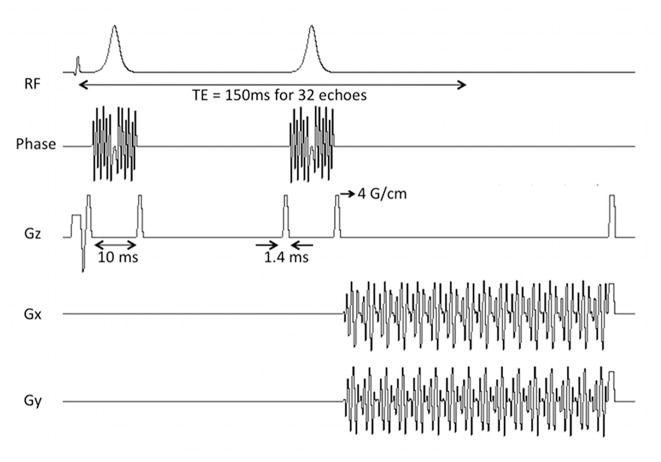
The spiral CSI (FID-spCSI) sequence consisted of a slice-selective excitation and a spiral readout gradient for combined spatial and spectral encoding as previously reported [4]. The spiral waveforms were designed for a field-of-view (FOV) of 80×80 mm2 with a nominal 5×5 mm2 in-plane resolution using 3 spatial interleaves. After each excitation, 40 spiral gradient echoes were acquired with an interval of 3.6 ms corresponding to a spectral width of 276.2 Hz. For the DSE-spCSI mode, the slice-selective excitation was followed by two adiabatic refocusing pulses and a symmetric echo acquisition using the spiral readout trajectory. The pulse sequence diagram is shown in Fig. 1. Non-slice-selective adiabatic hyperbolic secant refocusing pulses were used, with the same parameters as in [7], i.e. peak B1 of 0.167 mT and 10 ms duration. The adiabatic pulses were overdriven by a factor of approximately 2.5 to ensure that the adiabatic threshold was exceeded throughout a large part of the coil volume. The TE was 3 ms for FID-spCSI and 178 ms for DSE-spCSI. The readout duration and the readout trajectory were the same for both acquisitions.
Figure 1.
Pulse sequence diagram for the double spin-echo spiral CSI sequence. The sequence uses a pair of adiabatic refocusing pulses and a symmetric echo acquisition. The spiral gradients provide combined spatial and spectral encoding.
The reconstruction was performed using Matlab (MathWorks Inc., Natick, MA). The reconstruction procedure for FID-spCSI is described in detail in [4,5] and is briefly summarized here. Due to the spectral undersampling, separate reconstructions were necessary for each of the metabolites as they were aliased a different number of times. With the center frequency set approximately at Ala (at 177 ppm), Pyr (171.5 ppm) and Lac (183.5 ppm) were aliased once and Bic (161.5 ppm) was aliased twice. Thus, four separate reconstructions were performed, one each for Pyr, Lac, Ala, and Bic. In each reconstruction, one of the spectral components was corrected for chemical shift phase accrual and reconstructed “in-focus”, while the aliased components were severely blurred. For the FID-spCSI reconstruction, the in-focus metabolite was then phase-corrected by multiplying the spectrum with a constant phase factor so that its peak appeared in absorption mode. This constant phase factor was determined automatically, i.e. without user interaction, by maximizing the area under the peak on a per-voxel basis. For the DSE-spCSI data, no phase correction was necessary, and the spectrum was analyzed in magnitude mode. A 15 Hz Gaussian line broadening was used (full Gaussian apodization for DSE-spCSI). Each of the spectra was corrected for B0 inhomogeneity using a frequency offset map calculated directly from the in vivo data averaged over all time-points. The peak location of the dominant Pyr signal was used for B0 correction for the FID-spCSI reconstructions. For the DSE-spCSI data, frequency offset maps calculated individually from Pyr, Lac and Ala spectra were used for the corresponding reconstructions. The Bic reconstruction used the Pyr signal for B0 correction due to the low signal level of Bic. The Lac and Ala spectra were not used for FID-spCSI B0 correction because the individual peaks in the FID spectrum cannot be separated in magnitude mode. The frequency offset calculation would require the peaks to be in absorption mode in order to accurately determine the peak location. Metabolic maps for Pyr, Lac, Ala and Bic were calculated by integrating the signal around each peak in absorption mode for FID and magnitude mode for DSE. The integration interval was 40 Hz for Pyr, Lac and Ala, and 20 Hz for Bic. The baseline was estimated by a straight line through the spectral points at the beginning and end of the integration interval, and was subtracted for the display of metabolite maps. The metabolic images were normalized by the solid-state polarization level of each sample, and also by the signal intensity of the 13C-lactate reference acquired with the respective sequence.
The DSE-spCSI acquisition was compared to FID-spCSI in a single time-point measurement of a 10 mm axial slice through the kidneys (n=2). The time delay from dissolution to start of injection was 22 s. Each injection was completed within 15 s. The images were acquired at 20 s after the start of injection of hyperpolarized pyruvate (i.e. at 42 s after dissolution). A variable-flip-angle scheme [14] of 35°, 45°, and 90° was used for the three spiral interleaves to account for depletion of the longitudinal magnetization with multiple excitations and excite the same amount of transverse magnetization for each acquisition. Longitudinal relaxation and metabolic turnover can be neglected for the short time duration between the excitations (154 ms for FID and 250 ms for DSE). The total acquisition time for both sequences was less than 1 s.
To verify that the DSE-spCSI sequence preserved the hyperpolarized magnetization over multiple excitations, the T1 relaxation of hyperpolarized 13C-Pyr solution was measured in vitro. Approximately 3 mL of the hyperpolarized pyruvate solution in a syringe was placed within the RF coil. The signal dynamics of the DSE-spCSI sequence were compared to that observed with an FID pulse-and-acquire sequence over 40 excitations. A constant 5° flip angle excitation was used and images were acquired every 3 s.
The performance of the DSE-spCSI and FID-spCSI sequences was also compared in dynamic imaging experiments in vivo (n=3). An axial slice through the kidneys was imaged using a constant 5° flip angle excitation and 32 gradient echoes were acquired after each excitation for spectral encoding. The TE was 150 ms for DSE-spCSI and 3 ms for FID-spCSI. A 16 mm slice-thickness was used for improved signal-to-noise ratio. The time delay from dissolution to start of injection was 22 s. Images were acquired every 5 s, starting at the time of injection, for 90 s. Considering the effect of in-flowing spins into the imaging slice during the 90 s scan, a constant flip angle excitation was used instead of a variable flip angle scheme. In order to investigate the effect of the DSE refocusing pulses on the pyruvate bolus during injection, another DSE-spCSI experiment was done with the imaging starting at the end of injection (i.e. 15 s after start of injection). The metabolite time courses were calculated as the signal in the respective metabolic maps in a region of interest (ROI) chosen from the corresponding 1H reference image.
Results and Discussion
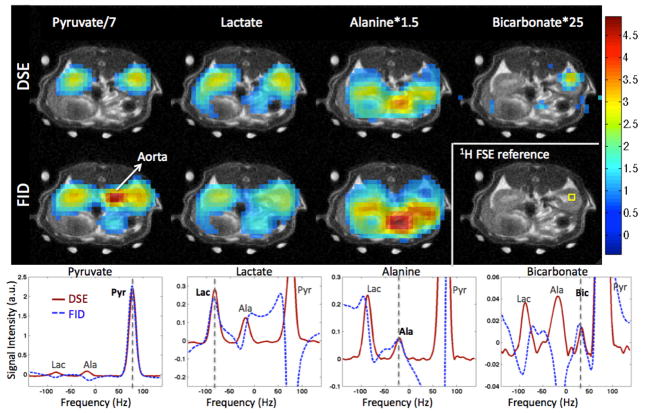
Representative metabolic images of Pyr, Lac, Ala and Bic from a single time-point study in one animal are shown in Fig. 2, superimposed onto a 1H reference image corresponding to the center of the 10 mm 13C slice. The magnitude mode DSE spectra and absorption mode FID spectra from a voxel in the right kidney are also shown. The spectra for Pyr, Lac, Ala and Bic are plotted separately due to the independent reconstructions performed for each of them. The vertical dashed lines in the plots indicate the frequency of the main (in-focus) spectral component in each of the reconstructed spectra. The DSE-spCSI exhibits high quality spectra, with the magnitude mode linewidth being comparable to absorption mode FID-spCSI spectra. The Bic signal in particular is obscured in the FID acquisition due to the contribution from the out-of-phase aliased Pyr peak nearby, but can be easily distinguished in the DSE magnitude spectrum. Automatic phase-correction of the FID spectra failed for Bic due to its proximity to the Pyr peak, and the spectrum from the kidney voxel in Fig. 2 was manually phase-corrected to obtain the Bic peak shown here. However, manual phase correction would not be practical for large CSI datasets.
Figure 2.
Metabolic images of Pyr, Lac, Ala, and Bic along with spectra from a voxel in the rat right kidney (voxel location is shown in 1H anatomical image). DSE-spCSI magnitude mode spectra yield similar linewidth as FID-spCSI absorption mode spectra, eliminating the need for phase correction. Bic image is not shown for FID as it was contaminated by out-of-phase Pyr signal. The DSE sequence also suppresses signal from flowing spins in blood vessels, which is clearly seen in the Pyr map. The spectra for Pyr, Lac, Ala and Bic are plotted separately due to the independent reconstructions performed for each of them. The vertical dashed lines indicate the frequency of the main (in-focus) spectral component in each of the reconstructed spectra.
The DSE sequence also suppresses the signal from flowing spins, as crusher gradients around the refocusing RF pulses attenuate their magnetization. This effect is illustrated in the Pyr maps in Fig. 2, where the vascular signal from the aorta is significantly suppressed in the DSE image. This can be useful to distinguish between in-flowing metabolite signal and that generated locally in the region of interest. Additionally, in the FID, the high Pyr signal in the nearby blood vessels can obscure the signal from the kidney at the 5 mm spatial resolution used here.
The dephasing of magnetization due to the crusher gradients around the refocusing pulse is direction specific, and will attenuate transverse magnetization from spins flowing in the direction of the gradient. In this work, where an axial slice was imaged, the in- and out-flow of spins from the major blood vessels, e.g. the aorta, which are primarily in the superior/inferior direction, is perpendicular to the slice. For spins that are flowing within a slice and are within the region of the coil where the adiabatic pulses refocus well, their magnetization would not be affected. There may be some blurring of the signal due to flow during the readout gradients, but that effect is not specific to the DSE and would be present for FID sequences as well.
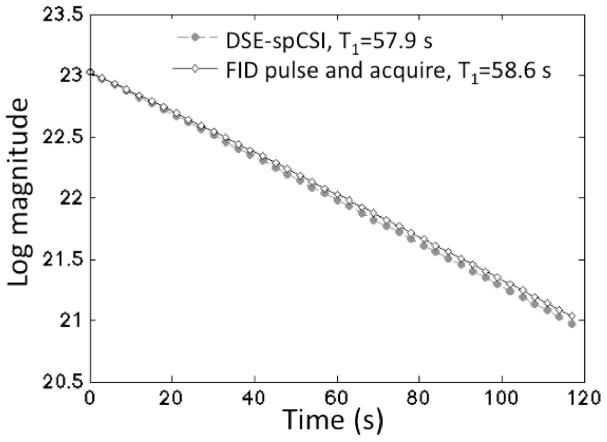
Figure 3 compares the T1 measurements performed with the DSE-spCSI and FID pulse and acquire. The plot shows the log magnitude of the measured pyruvate signal, corrected for constant flip angle, and the linear fits to the data. The pulse-and-acquire data were normalized to the same signal level as the DSE-spCSI. The T1 values and the standard error of the fit were: 57.9±0.1 s for DSE-spCSI and 58.6±0.1 s for FID pulse-and-acquire. The small difference between the two is due to normal variation between samples. The similar T1 values obtained with both sequences in vitro demonstrate that the signal behavior over multiple excitations was the same for the spin echo compared to a small-tip excitation.
Figure 3.
Comparison of in vitro T1 measurement results from DSE-spCSI and FID pulse-and-acquire. Similar T1 values were obtained with both sequences (57.9 s with DSE-spCSI and 58.6 s with FID pulse-and-acquire), demonstrating that the signal behavior in the phantom over multiple excitations was the same for the spin echo compared to a small-tip excitation.
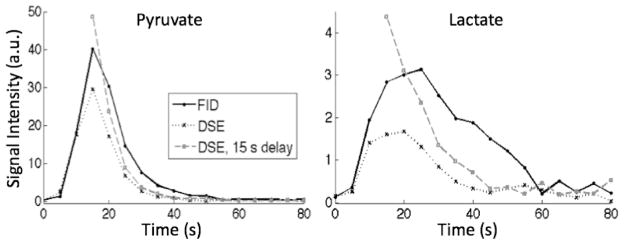
Figure 4 shows representative results of the in vivo dynamic imaging experiment from one animal. The plots depict the time courses of the mean Pyr and Lac signals from an ROI in the right kidney. The DSE-spCSI exhibits lower signal and decays faster than the FID-spCSI, as the refocusing pulses attenuate magnetization passing through the regions of inhomogeneous B1 at the edges of the RF coil (“fringe field”). Delaying the acquisition until the end of injection so that the pyruvate bolus did not experience any RF pulses as it was flowing through the tail vein catheter recovered some of the signal. But the signal still decayed faster compared to the FID-spCSI data as the re-circulating blood went through the fringe field.
Figure 4.
Time course of pyruvate and lactate signal in the right kidney, normalized by the lactate reference signal. The DSE sequence allows time-resolved metabolic measurements, but loses some signal compared to the FID acquisition as the refocusing pulses attenuate magnetization passing through the RF coil edges. Delaying the acquisition until end of injection may provide some gain in that case.
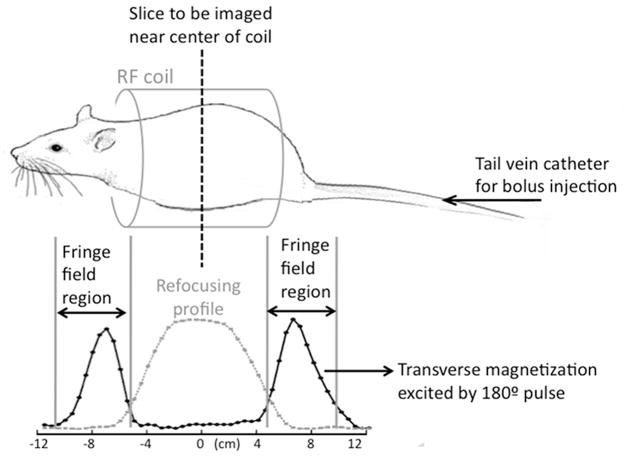
In contrast to the T1 measurement where the pyruvate syringe was completely within the RF coil volume, in the in vivo experiments a significant portion of the rat anatomy lay near the edge of or outside of the coil. Figure 5 illustrates the animal position with respect to the coil, and the fringe-field region at the RF coil edges. The adiabatic refocusing pulses are robust to B1 variations within the coil volume. However, the RF pulse performance and profile degrades in the fringe-field, in particular at the superior/inferior ends of the coil, where the adiabatic condition is not met, resulting in flip angles lower than 180° for the refocusing pulse.
Figure 5.
A sketch of the animal position with respect to the RF coil and the fringe-field region at the periphery of the coil. The measured signal profiles plotted here show the region within the coil where the refocusing pulses work well, and also that the refocusing pulses fail in the fringe-field region and attenuate magnetization flowing through that region during acquisition.
In order to clarify the behavior of the adiabatic refocusing pulses at the fringe-field, the signal profiles of the adiabatic 180° pulse measured within the coil volume and in the fringe field of the coil are also plotted in Fig. 5. The profiles were obtained by imaging an [1-13C] acetate phantom (0.5 cm diameter, 30 cm length) placed along the center of the coil and measuring the signal along its length. The DSE-spCSI refocusing mode signal profile shows that the refocusing pulses work well within an approximately 9 cm extent of the coil. The fringe-field profile was measured by using the adiabatic 180° RF pulse as the excitation pulse in the FID-spCSI mode. Within the coil volume where the adiabatic threshold is exceeded, the pulse acts as an inversion pulse and does not generate any signal. Any signal measured in this case indicates where the pulse fails to achieve an 180° flip angle, and instead creates transverse magnetization. In fact, the refocusing pulse could act as a 90° excitation pulse in those regions. In the DSE-spCSI sequence, this transverse magnetization would then be suppressed by the crushers, thus destroying hyperpolarized magnetization from spins in those regions.
This can be a significant loss in dynamic imaging when major blood vessels or the heart lie in the fringe field of the coil. This loss can be overcome by using a transmit coil that is larger than the subject (e.g. a whole-body coil for small animal imaging), though that may not be practical in all cases. The lower peak B1 and receive sensitivity of large coils would also be a limitation, though the receive sensitivity could be improved by using a surface coil for reception. The optimal solution for each case would depend on the experimental setup.
The DSE sequence is very useful for a single slice/time-point acquisition, where the loss of signal due to flow through the fringe field is negligible during the sub-second acquisition time. This loss may also be tolerable for a 3D volumetric single time-point acquisition completed within a few seconds, or for time-resolved imaging requiring only a few time-points.
Conclusion
This work demonstrates the use of DSE-spCSI sequence for fast metabolic imaging in vivo and evaluates the effect of the refocusing pulses on flowing spins. The spin echo acquisition achieves high quality spectra in magnitude mode without the need for phase correction. It also provides an additional benefit of attenuating signal from flowing spins in the vasculature and potentially isolating the signal generated in the organ of interest. However, the application of DSE in dynamic imaging is hampered by the loss of signal due to blood flow through inhomogeneous B1 regions at the edges of the coil, where the refocusing pulse performance degrades. To avoid this loss, care must be taken to ensure that the spins remain within the RF coil volume during imaging.
Acknowledgments
Funded by: NIH RR09784, AA018681, AA05965, AA13521-INIA, EB009070
The authors thank Oliver Hsu, B.A., and Evan Nunez, B.A., for assistance with the animal experiments.
Footnotes
Publisher's Disclaimer: This is a PDF file of an unedited manuscript that has been accepted for publication. As a service to our customers we are providing this early version of the manuscript. The manuscript will undergo copyediting, typesetting, and review of the resulting proof before it is published in its final citable form. Please note that during the production process errors may be discovered which could affect the content, and all legal disclaimers that apply to the journal pertain.
References
- 1.Golman K, Zandt R, Thaning M. Real-time metabolic imaging. Proc Natl Acad Sci USA. 2006;103:11270–11275. doi: 10.1073/pnas.0601319103. [DOI] [PMC free article] [PubMed] [Google Scholar]
- 2.Golman K, Petersson JS. Metabolic imaging and other applications of hyperpolarized 13 C1. Acad Radiol. 2006;13:932–942. doi: 10.1016/j.acra.2006.06.001. [DOI] [PubMed] [Google Scholar]
- 3.Kohler SJ, Yen Y, Wolber J, Chen AP, Albers MJ, Bok R, Zhang J, Tropp J, Nelson S, Vigneron SB, Kurhanewicz J, Hurd RE. In vivo 13carbon metabolic imaging at 3T with hyperpolarized 13C-1-pyruvate. Magn Reson Med. 2007;58:65–69. doi: 10.1002/mrm.21253. [DOI] [PubMed] [Google Scholar]
- 4.Mayer D, Yen Y, Tropp J, Pfefferbaum A, Hurd RE, Spielman DM. Application of subsecond spiral chemical shift imaging to real-time multislice imaging of rat in vivo after injection of hyperpolarized 13C1 pyruvate. Magn Reson Med. 2009;62:557–564. doi: 10.1002/mrm.22041. [DOI] [PMC free article] [PubMed] [Google Scholar]
- 5.Mayer D, Yen Y, Levin Y, Tropp J, Pfefferbaum A, Hurd RE, Spielman DM. In vivo application of subsecond spiral chemical shift imaging to hyperpolarized 13C1 metabolic imaging: Comparison with phase encoded CSI. J Magn Reson. 2010;204:340–345. doi: 10.1016/j.jmr.2010.03.005. [DOI] [PMC free article] [PubMed] [Google Scholar]
- 6.Cunnigham CH, Chen AP, Lustig M, Hargreaves BA, Lupo J, Xu D, Kurhanewicz J, Hurd RE, Yen Y, Pauly JM, Nelson SJ, Vigneron DB. Pulse sequence for dynamic volumetric imaging of hyperpolarized metabolic products. J Magn Reson. 2008;193:139–146. doi: 10.1016/j.jmr.2008.03.012. [DOI] [PMC free article] [PubMed] [Google Scholar]
- 7.Cunningham CH, Chen AP, Albers MJ, Kurhanewicz J, Hurd RE, Yen Y, Pauly JM, Nelson SJ, Vigneron DB. Double spin-echo sequence for rapid spectroscopic imaging of hyperpolarized 13C. J Magn Reson. 2007;187:357–362. doi: 10.1016/j.jmr.2007.05.014. [DOI] [PubMed] [Google Scholar]
- 8.Larson PEZ, Bok R, Kerr AB, Lustig M, Hu S, Chen AP, Nelson SJ, Pauly JM, Kurhanewicz J, Vigneron DB. Investigation of tumor hyperpolarized [1–13C] pyruvate dynamics using time resolved multiband RF excitation echo-planar MRSI. Magn Reson Med. 2010;63:582–591. doi: 10.1002/mrm.22264. [DOI] [PMC free article] [PubMed] [Google Scholar]
- 9.Hu S, Lustig M, Balakrishnan A, Larson PEZ, Bok R, Kurhanewicz J, Nelson SJ, Goga A, Pauly JM, Vigneron DB. 3D compressed sensing for highly accelerated hyperpolarized 13C MRSI with in vivo application to transgenic mouse models of cancer. Magn Reson Med. 2010;63:312–321. doi: 10.1002/mrm.22233. [DOI] [PMC free article] [PubMed] [Google Scholar]
- 10.Lupo JM, Chen AP, Zierhut ML, Bok RA, Cunningham CH, Kurhanewicz J, Vigneron DB, Nelson SJ. Analysis of hyperpolarized dynamic 13C latate imaging in a transgenic mouse model of prostate cancer. Magn Reson Imag. 2010;28:153–162. doi: 10.1016/j.mri.2009.07.007. [DOI] [PMC free article] [PubMed] [Google Scholar]
- 11.Chen AP, Leung K, Lam W, Hurd RE, Vigneron DB, Cunnigham CH. Design of spectral-spatial outer volume suppression RF pulses for tissue specific metabolic characterization with hyperpolarized 13C pyruvate. J Magn Reson. 2009;200:344–348. doi: 10.1016/j.jmr.2009.06.021. [DOI] [PMC free article] [PubMed] [Google Scholar]
- 12.Chen AP, Hurd RE, Albers M, Zierhut ML, Yen Y, Tropp J, Bok R, Nelson SJ, Kurhanewicz J, Vigneron DB. Symmetric echo acquisition of hyperpolarized C-13 MRSI data in the tramp mouse at 3T. Proc. ISMRM; 2007. p. 538. [Google Scholar]
- 13.Ardenkjaer-Larsen JH, Fridlund B, Gram A, Hansson G, Hansson L, Lerche MH, Servin R, Thaning M, Golman K. Increase in signal-to-noise ratio of >10,000 times in liquid-state NMR. Proc Natl Acad Sci USA. 2003;100:10158–10163. doi: 10.1073/pnas.1733835100. [DOI] [PMC free article] [PubMed] [Google Scholar]
- 14.Zhao L, Mulker R, Tseng CH, Williamson D, Patz S, Kraft R, Walsworth RL, Jolesz FA, Albert MS. Gradient echo imaging considerations for hyperpolarized 129Xe MR. J Magn Reson B. 1996;113:179–183. [PubMed] [Google Scholar]


