Abstract
OBJECTIVE
Our purpose in this study was to develop an automated computer-aided volumetry (CAV) scheme for quantifying pneumothorax in MDCT images for pediatric patients and to investigate the imaging parameters that may affect its accuracy.
MATERIALS AND METHODS
Fifty-eight consecutive pediatric patients (mean age 12±6 years) with pneumothorax who underwent MDCT for evaluation were collected retrospectively for this study. All cases were imaged by a 16- or 64-MDCT scanner with weight-based kilovoltage, low-dose tube current, 1.0 ~ 1.5 pitch, 0.6 ~ 5.0 mm slice thickness, and a B70f (sharp) or B31f (soft) reconstruction kernel. Sixty-three pneumothoraces ≥1 cc were visually identified in the left (n = 30) or/and right (n = 33) lungs. Each identified pneumothorax was contoured manually on an Amira workstation V4.1.1 (Mercury Computer Systems, Chelmsford, Massachusetts) by two radiologists in consensus. The computerized volumes of the pneumothoraces were determined by application of our CAV scheme. The accuracy of our automated CAV scheme was evaluated by comparison between computerized volumetry and manual volumetry, for the total volume of pneumothoraces in the left and right lungs.
RESULTS
The mean difference between the computerized volumetry and the manual volumetry for all 63 pneumothoraces ≥1 cc was 8.2%. For pneumothoraces ≥10 cc, ≥50 cc, and ≥200 cc, the mean differences were 7.7% (n=57), 7.3% (n=33), and 6.4% (n=13), respectively. The correlation coefficient was 0.99 between the computerized volume and the manual volume of pneumothoraces. Bland-Altman analysis showed that computerized volumetry has a mean difference of −5.1% compared to manual volumetry. For all pneumothoraces ≥10 cc, the mean differences for slice thickness ≤1.25 mm, =1.5 mm, and =5.0 mm were 6.1% (n=28), 3.5% (n=10), and 12.2% (n=19), respectively. For the two reconstruction kernels, B70f and B31f, the mean differences were 6.3% (n=42, B70f) and 11.7% (n=15, B31f), respectively.
CONCLUSION
Our automated CAV scheme provides an accurate measurement of pneumothorax volume in MDCT images of pediatric patients. For accurate volumetric quantification of pneumothorax in children in MDCT images by use of the automated CAV scheme, we recommended reconstruction parameters based on a slice thickness ≤1.5 mm and the reconstruction kernel B70f.
Keywords: Computerized volumetry method, Multidetector computed tomography (MDCT), Pneumothorax, Quantification of pneumothorax, Pediatric patients
1 INTRODUCTION
Pneumothorax is a potentially life-threatening condition which can occur in up to 20% of pediatric patients who suffer from chest trauma [1]. The early detection and accurate measurement of the size of pneumothorax play an important role in proper management of pediatric patients who have pneumothorax. Failure to identify even a small pneumothorax, which may potentially enlarge rapidly and result in cardiopulmonary compromise, can lead to detrimental consequences, including death.
Although chest radiography has been used as an initial imaging modality for evaluating pneumothorax in children, it has been reported that the false-negative rate of detecting pneumothorax on chest radiographs can be as high as 50% [2–4]. Study found that the estimation of pneumothorax size on CXR [5, 6] is inaccurate and inconsistent [7]. Whereas, multi-detector CT (MDCT), which provides the gold standard for detecting occult traumatic pneumothorax [8], provides an imaging modality for more accurate diagnosis and quantification of pneumothorax.
It is commonly believed that the size of a pneumothorax is an important determinant of pneumothorax management, in particular regarding whether chest tube drainage is required [9]. However, most surgeons and emergency physicians tend to place a chest tube in pneumothorax management [10]. The incident rate of chest tube drainage varied from 31% [11] to 67% [8] of injured pneumothorax patients, and up to 82% for patients with concurrent hemo- and pneumothorax [12]. The over-treatment is particularly important with chest tube drainage as it is associated with an up to 22% rate of major complications [13], including insertional, positional, and infective issues [13–16]. However, studies suggest that carefully selected patients may be treated conservatively, ultimately requiring chest tube placement only in about 10% of cases [17,18]. The large variability of chest size related to the age (0 ~ 18 year old) of pediatric patients worsens the situations clinicians have in practice in determining the relative size of pneumothorax to chest volume and thus the appropriate treatment for pneumothoraces. MDCT provides a better imaging solution for an objective and consistent estimation of the size of pneumothoraces and thus may improve the physicians' performance in the decision-making about drainage.
Recently, an automated computer-aided volumetry (CAV) method for quantifying pneumothorax in MDCT images has been developed and evaluated in adult patients with occult pneumothorax [19]. In this study, we have improved the CAV scheme to pediatric patients by the development of an automated segmentation method for the pleural region in MDCT images, named pleural region geometric modeling, to substantially reduce the false-positives caused by subcutaneous emphysema. We have applied and validated the improved CAV scheme in MDCT images of pediatric patients for detecting and quantifying of pneumothoraces.
Therefore, one major goal in this study was to develop an automated CAV scheme for quantifying pneumothorax and assess its accuracy for volumetric measurement of pneumothorax in MDCT images of pediatric patients based on manual volumetry. A second aim was to investigate the imaging parameters that may affect the accuracy of the automated CAV scheme for quantifying pneumothorax in MDCT images of pediatric patients.
2 MATERIAL AND METHODS
2.1 INSTITUTIONAL REVIEW BOARD APPROVAL
Our Institutional Review Board approved this retrospective, HIPAA-compliant pediatric patient study. Informed consent was waived, but patient confidentiality was protected.
2.2 STUDY PATIENTS
We used our radiology department’s information system to identify all consecutive pediatric patients (< 18 years old) with clinically suspected pneumothorax who underwent thoracic MDCT examinations from Novermber 2004 to January 2009. Pediatric patients who were suspected of having pneumothorax on the basis of clinical signs and symptoms as determined by their referring physicians, and who underwent thoracic MDCT examinations, were eligible for this study. These children had various combinations of clinical symptoms and signs that suggested pneumothorax, including shortness of breath, pleuritic chest pain, tachycardia, and an increased oxygen requirement.
The final study population consisted of 58 pediatric patients (28 females and 30 males), ranging in age from 1 day to 18 years (mean, 12 ± 6 years). The underlying reasons for the development of pneumothoraces in these patients included spontaneous pneumothorax (n=31), prior recent surgery (n=13), trauma (n=8), and extensive pulmonary infection (n=6).
2.3 MDCT IMAGING
Patient Preparation
At our institution, a pediatric patient’s ability to cooperate with a chest CT study without adjuvant medication or general anesthesia is assessed in advance by a dedicated pediatric anesthesiologist and a CT nurse. In general, older children (> 5 years) are able to undergo CT studies without sedation. Infants or younger children (≤ 5 years) are typically sedated.
MDCT Imaging Technique
All MDCT examinations were performed by use of either a 16-MDCT scanner (n = 25) (LightSpeed 16, GE Healthcare, Milwaukee, WI) or a 64-MDCT scanner (n=33) (Sensation 64, Siemens Medical Solutions, Malvern, PA) with weight-based kilovoltage, low-dose tube current, 1.0 ~ 1.5 pitch, 0.6 ~ 5.0 mm slice thickness, and a B70f (sharp) or B31f (soft) reconstruction kernel. The area coverage extended from the thoracic inlet to the lung bases, which was determined on the basis of the initial scout topographic images obtained prior to CT scanning. The estimated radiation dose associated with our MDCT protocol in our patient population ranged between 0.5 and 1.0 mSv.
2.4 COMPUTERIZED VOLUMETRY OF PNEUMOTHORAX
We developed an automated computer-aided volumetry (CAV) scheme for quantifying pneumothoraces in the MDCT images of pediatric patients based on our prior work [19]. The CAV scheme consisted of four automated steps: (1) extraction of the pleural region; (2) detection of pneumothoraces; (3) segmentation of the detected pneumothoraces; and (4) volumetry of the segmented pneumothoraces. The CAV scheme was performed in the entire 3D volume of MDCT images.
Extraction of Pleural Region
Pneumothoraces are located within the pleural cavity (i.e., intrathoracic). In order to effectively exclude subcutaneous emphysema (air pockets in the soft-tissue) that are usually outside the chest cavity and are often seen in chest patients, we developed an automated method named pleural region geometric modeling (PR-GM) for extraction of the entire pleural region by modeling the pleural surface from MDCT images.
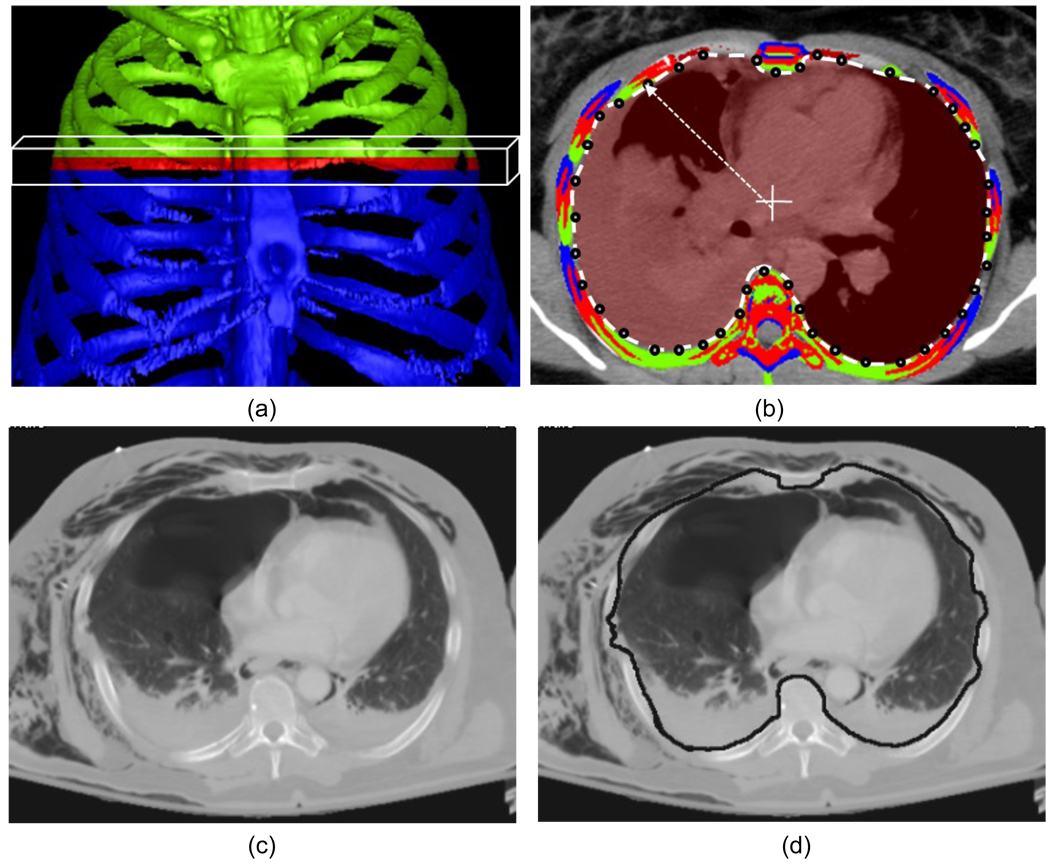
Because the pleural cavity is surrounded by the skeletal ribs and its surface is very close to the ribs, the PR-GM method used rib structures as references to assist the segmentation of the pleural cavity. For this purpose, an axial slab structure, which encompasses a certain number of consecutive axial slices, as illustrated in Figure 1(a), sweeps through each axial slice. We set the thickness of the axial slab at 10 mm, i.e., 5 mm of axial slices in the upper half and lower half of the slab, respectively.
Figure 1.
Pleural region geometric modeling (PR-GM) for extraction of the entire pleural region. (a) Rib structures within an axial slab are projected on the medial slice: the ribs on the medial slice are marked in red, whereas green and blue indicate the ribs in the upper half and lower half of the slab, respectively. (b) A ray is shot from the center of the slice for estimating the inner pleural contour by use of the intersection with ribs from the current slice or neighboring slices within the slab. (c) One axial slice with subcutaneous emphysema. (d) Pleural curve built by the intersection points with rib structures successfully excludes these subcutaneous air pockets from the pleural region.
In each axial slab, the rib locations on the medial slice were estimated by interpolation between the closest ribs in the upper and lower half of the slab. The inner contour of the ribs on the medial slice was estimated by shooting a ray from the center to each point on the four edges of the slice, as shown in Figure 1(b). The intersection points with rib structures were connected for estimation of the pleural curve. By this means, the pleural curves on each axial slice were estimated slice by slice when the axial slab swept through all axial images, as illustrated in Figure 1(c,d). Finally, the 3D pleural region was extracted by the reconstructed pleural surface using the pleural curves on each axial slice. The detection and segmentation of pneumothoraces followed were performed in a 3D manner in the extracted volume of the pleural region.
Detection of Pneumothoraces
Because a pneumothorax tends to appear as a homogeneous air pocket between the pleural surface and the lung parenchyma, pneumothorax candidates are defined as contiguous regions of homogeneous air within the pleural region.
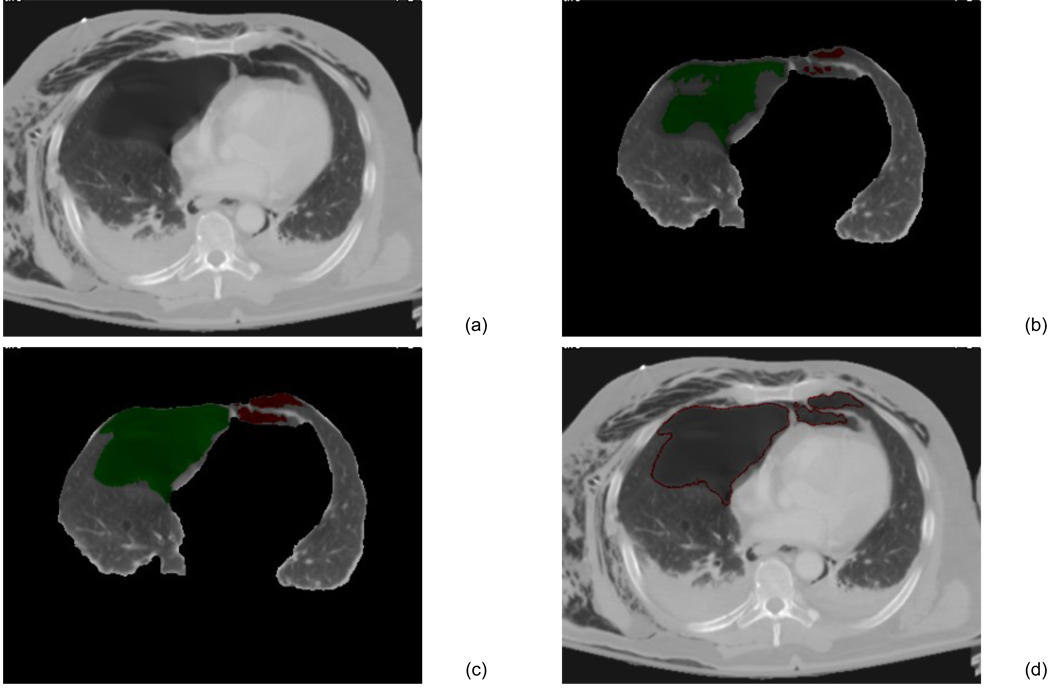
After applying a threshold of lung parenchyma, e.g., −500 Hounsfield units (HU), to the pleural region, followed by morphological operations, we marked the lung region, which includes both pneumothoraces and lung parenchyma. We then employed two image features, the local mean / standard deviation and the gradient of the images, in this thresholded lung region for identification of pneumothorax candidates. This was followed by a 3D connectivity check for detecting the continuous regions of air; i.e., the volume of the air region is larger than a predefined size, such as 0.1 cc. The detected air regions were marked as the pneumothorax candidates, as demonstrated in Figure 2(b).
Figure 2.
The CAV scheme for pneumothoraces. (a) One axial slice of chest CT scan. (b) Lung region was segmented, and the homogeneous air regions were detected as the pneumothorax candidates. (c) Pneumothorax candidates were segmented by dynamic-threshold level-set method. Pneumothoraces in the right lung region are marked in green, whereas those in the left lung are marked in red. (d) Contours of the segmented pneumothoraces.
Segmentation of Pneumothoraces
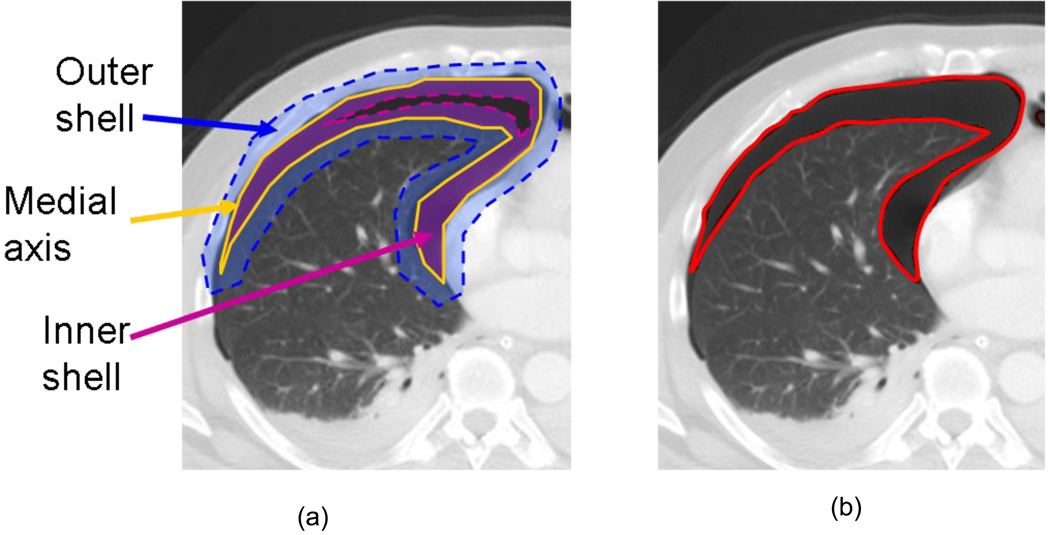
Pneumothoraces were precisely segmented from the pleural regions by use of our previously-developed dynamic-thresholding level-set (DTLS) method [20]. The DTLS was initialized by the pneumothoraces detected in the previous step and evolved within the segmented pleural region. During the evolution, the front of the level set was pushed toward the boundary of the pneumothoraces by the threshold calculated from the shell, which is a thick 3D region encompassing the level set front, and the histogram of the voxel values in the shell for calculating the values of the speed functions [20], as shown in Figure 3. The threshold calculated from the shell approaches the optimal threshold, and the shell was settled in the convergence position, where the inner shell was located in the pneumothorax, whereas the outer shell was located in the background. Thus, the medial axis delineated the boundaries of the pneumothorax, as shown in Figure 2(c,d).
Figure 3.
Pneumothorax segmentation by use of the Dynamic-Threshold (DT) level-set method. (a) The propagation shell consists of an inner shell, an outer shell, and a medial axis. The medial axis is controlled by a DT speed function that is set based on the histogram in the shell. (b) The resulting contour (medial axis) delineates the boundary of the segmented pneumothorax.
Volumetry of Pneumothoraces
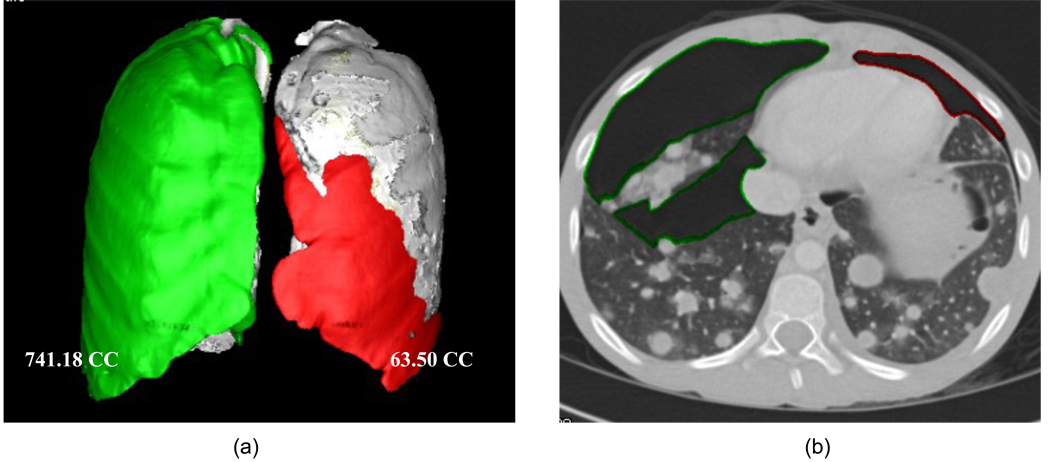
The resulting pneumothoraces detected and segmented by our CAV scheme were loaded into a 3D workstation and reviewed by one radiologist, who marked the false-positive detections on the workstation. These false-positive detections were excluded from the calculation of the volume of pneumothoraces. The reviewed pneumothoraces were grouped into the left and right pleural cavities and thus the volume of pneumothoraces in the left and right pleural cavities were reported, respectively, as shown in Figure 4, which demonstrates the resulting images of the automated CAV scheme on 2D and 3D images.
Figure 4.
An example of the CAV scheme for the quantification of pneumothorax on a 12-year-old/ male patient with metastatic angiosarcomas, who had pneumothorax after pleural biopsy. (a) The pneumothoraces in the right and left lung cavity detected and segmented by our CAV scheme were 741.18 CC and 63.50 CC, respectively. (b) One of the axial images: the resulting pneumothoraces were contoured.
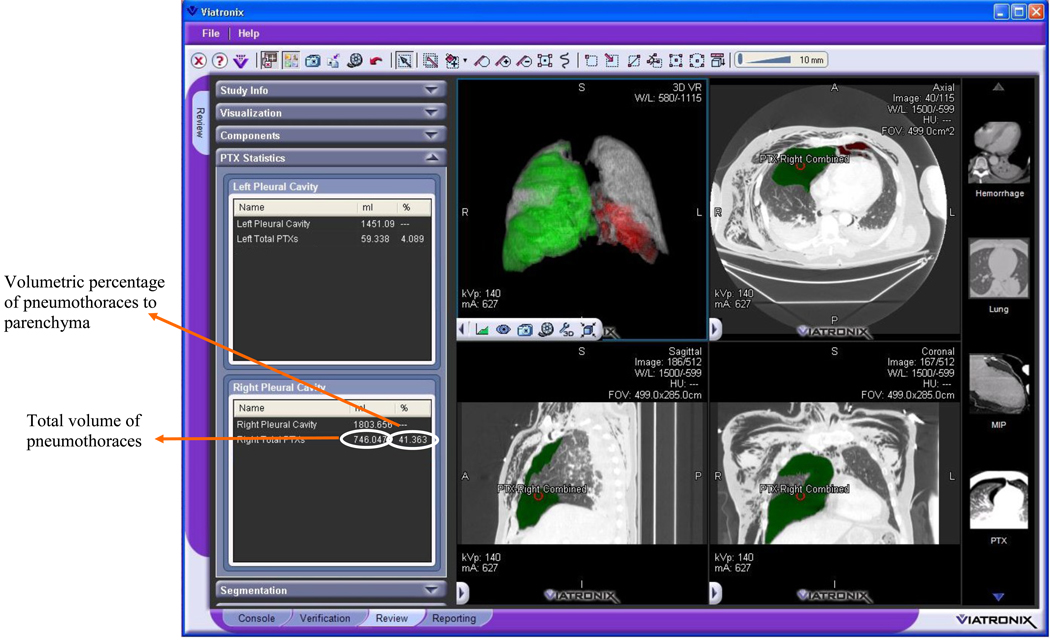
This automated CAV scheme for quantification of pneumothoraces was integrated into a medical imaging visualization platform, V3D-Explorer (Viatronix, Inc., Stony Brook, NY). The V3DExplorer runs on an off-the-shelf workstation with a Windows 64-bit operating system. Figure 5 shows the user interface of the CAV scheme, on which the left panel displays the pneumothoraces in the left and the right pleural region, respectively.
Figure 5.
The user interface of the CAV scheme for quantification of pneumothoraces, which was integrated into a V3D-Explorer platform (Viatronix, Inc., Stony Brook, NY ).
2.5 DATA ANALYSIS
The computerized volumetric measurements generated by the CAV scheme, named as computerized volumetry, were assessed by the manual volumetry, which were generated by the manual contouring of the pneumothoraces in these 58 cases on an Amira workstation (Mercury Computer Systems, Chelmsford, Massachusetts) by two radiologists who were both blinded to the computerized results. The manual contours of each pneumothorax were first traced by one junior radiologist, then the other senior radiologist reviewed the contours together with the junior radiologist. The final manual volumetry was established based on the manual contours in the consensus of two radiologists.
In the standard four-step CAV scheme, the resulting pneumothoraces were reviewed by a radiologist to exclude the false-positives in the calculation of the volume of pneumothoraces. For the evaluation purpose, the resulting pneumothoraces generated by the CAV scheme in the 58 cases were directly compared to the manual contours instead of being reviewed by a radiologist. The sensitivity/specificity and false-positive rate per case were calculated for the assessment of the performance of the CAV scheme by use of the “true” location (left lung or right lung) and size/volume of pneumothoraces established in the manual volumetry. The sensitivity and specificity were defined as (true positives) / (true positives + false negatives) × 100%, and (true negatives) / (true negatives + false positives) × 100%, respectively; whereas the false-positive rate was defined as the average false-positive number per patient, i.e., the false-positive rate is (total number of false positives) / (number of cases). The resulting computerized volume of pneumothoraces were calculated by exclusion of the false-positives detections.
Bland-Altman analysis [21, 22] was used to determine the agreement between the two groups of measurements, i.e., computerized volumetry and manual volumetry. Because the differences are proportional to the measurements (the size of pneumothorax), we applied a logarithmic transformation to the measurements, which is the only transformation that makes back-transformed differences easy to interpret (recommended by the Bland-Altman analysis [21]). The agreement of measurement were calculated using one-way analysis of variance by Medlabstats package (www.medlabstats.com).
In addition, we calculated intraclass correlation coefficients to evaluate the reliability between two groups of measurements, i.e., computerized results and manual results, by use of Stata/SE 10.0 statistical package (Stata Corp. LP, College Station, TX). We performed a paired t-test to evaluate whether the difference between the two groups of measurements was statistically significant. All data analysis was performed with a 95% confidence interval (CI). A p-value of .05 or less was considered to indicate statistical significance.
The relative difference between manual volumetry and computerized volumetry of a pneumothorax was defined as the percentage of the manual volume, i.e.,
3 RESULTS
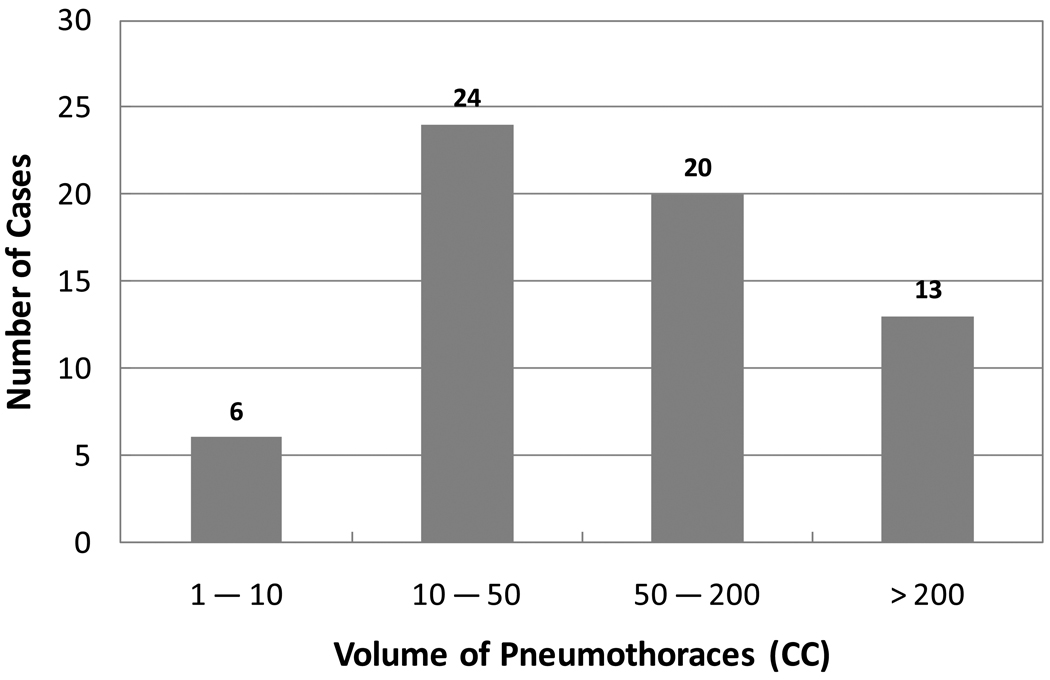
Of the 58 subjects who had pneumothoraces, a total of 63 pneumothoraces ≥1 cc were identified visually in the left or/and right lungs (30 left pneumothoraces and 33 right pneumothoraces) by the two radiologists in consensus on MDCT images. The distribution of the volumes of the 63 pneumothoraces in the study is shown in the histogram in Figure 6. In these 58 cases, 28 (48%) had left pneumothoraces, 25 (43%) had right pneumothoraces, and 5 (9%) had bilateral pneumothoraces. The average volume of the pneumothoraces was 132.67 cc. The maximum volume of the pneumothoraces was 775.25 cc, and the minimum was 1.11 cc.
Figure 6.
Histogram shows the distributions of volumetric sizes of 63 pneumothoraces ≥ 1cc in the study.
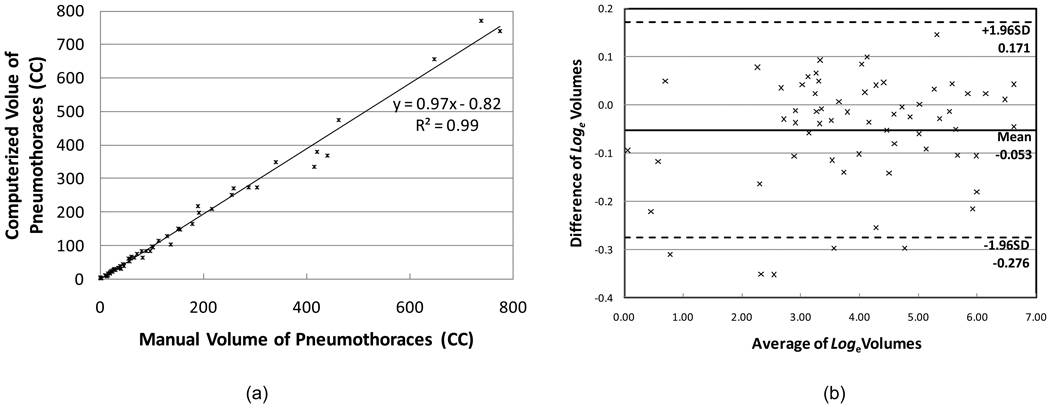
Our CAV scheme detected 68 pneumothoraces ≥1 cc, of which 63 were true positives and 5 were false positives. The size range of 5 false-positive pneumothoraces was 2.14 to 6.11 cc. The sensitivity and specificity were 100% and 91.4%, respectively. The false-positive rate was 0.09 (5/58) per case. The scatter plot and the regression line, shown in Figure 7a, demonstrate a high linear correlation between the two methods of measurements. The intraclass correlation coefficient was 0.99 [95% CI: 0.992 , 0.997] between the computerized volumetry and the manual volumetry methods for measuring volumes of pneumothoraces. The Bland-Altman analysis showed that the computerized measurements had a mean difference of −5.1% (95% limits of agreement are from −24.1% to 18.7% compared to manual volumetry), displayed in Figure 7b.
Figure 7.
The scatter graph plots the measurements from the manual volumetry and computerized volumety of pneumothoraces. In total, there were 63 pneumothoraces in the reference standard. (a) The associated regression line demonstrated that the two groups of measurements were highly correlated. (b) Plot shows the difference of volumes against the average volume after loge transformation superimposed with 95% limits of agreement.
The mean value of the relative difference for all 63 pneumothoraces 2265;1 cc was 8.2% [95% CI: 6.34% , 10.11%]. To reduce the variability caused by the small pneumothoraces, we selected 57 pneumothoraces ≥10 cc from the results for further evaluation of the results in terms of the pneumothorax size (≥10 cc, ≥50 cc, and ≥200 cc), the slice thickness (≤1.25 mm, =1.5 mm, and =5.0 mm), and the CT reconstruction kernels (B70f (sharp) and B31f (smooth)). The results are listed in Table 1. The mean differences of three groups of pneumothoraces are in the same rage, which indicated that our CAV scheme can accurately quantify the small as well as the large pneumothoraces. The p-values of the paired t-tests between the manual and computerized volumetry of three slice thickness groups were 0.70, 0.55, and 0.02, respectively. This indicates that the manual and computerized measurements were statistically significantly different only for the images with a slice thickness of 5.0 mm. The difference between two reconstruction kernels indicates that sharp images generate better results than do smooth images.
Table 1.
Relative differences for 57 pneumothoraces ≥10 cc.
| Category | Mean Value | 95% CI | |
|---|---|---|---|
| Pneumothorax Size | ≥10 cc | 7.7% (n=57) | [ 5.75% , 9.62% ] |
| ≥50 cc | 7.3% (n=33) | [ 5.10% , 9.53% ] | |
| ≥200 cc | 6.4% (n=13) | [ 3.29% , 9.66% ] | |
| Slice Thickness | ≤1.25 mm | 6.1% (n=28) | [ 4.24% , 7.94% ] |
| =1.5 mm | 3.5% (n=10) | [ 1.97% , 5.13% ] | |
| =5.0 mm | 12.2% (n=19) | [ 7.79% , 16.65% ] | |
| Reconstruction Kernels | B70f | 6.3% (n=42) | [ 4.46% , 8.08% ] |
| B31f | 11.7% (n=15) | [ 6.75% , 16.58% ] |
It took about 4 hours for the CAV scheme to finish 58 cases on a 2.66 GHz, 3 GB memory PC, in average about 4 min per case. In contrast, two radiologists spent approximately 2 hours per case in order to manually contour all pneumothoraces. This demonstrated that our CAV scheme is an efficient and accurate way for the quantification of pneumothoraces in the clinical environment.
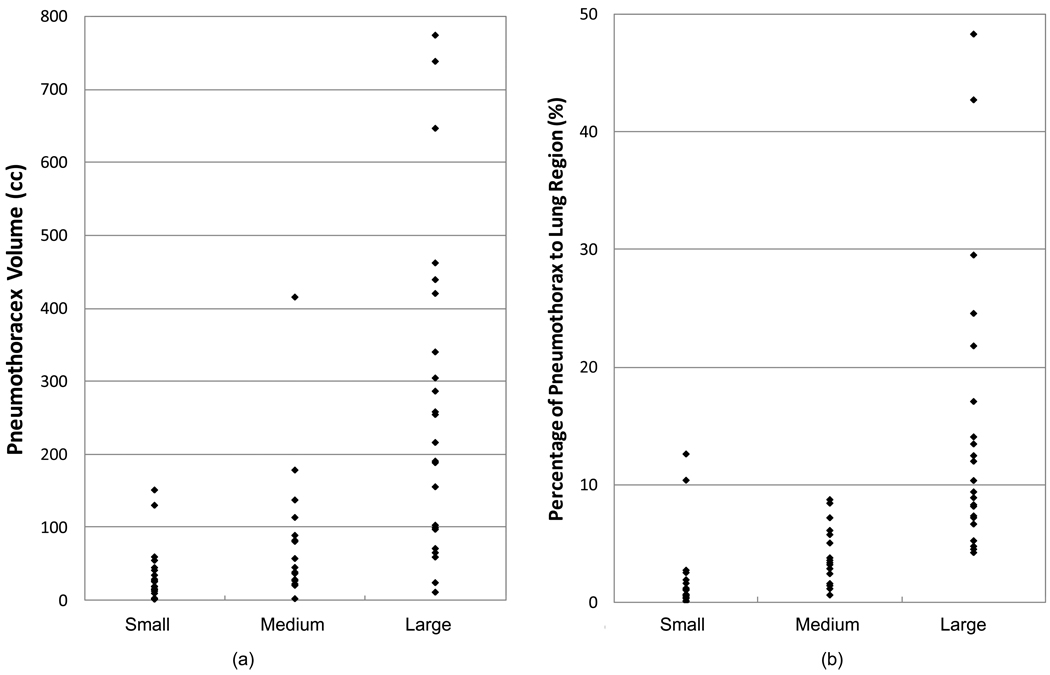
In addition, one experienced radiologist who was blinded to the volumes of the pneumothoraces read the 63 pneumothoraces and marked them in respect to the patient size with a three-scale visual assessment, including small, medium, and large. In total, 24 were ranked as small, 16 were medium, and 23 were large. The performances of the visual assessment based on the absolute size (volume) of pneumothorax and the relative size (ratio) of pneumothoraces in respect to the lung region are listed in Table 2 and Figure 8(a), Table 3 and Figure 8(b), respectively. The ranges of the three groups of pneumothoraces were highly overlapped in both volumetric size and pneumothorax in ratio to the lung region. This indicated that the three-scale visual assessment that is usually applied in current clinical practice was unable to provide an accurate and consistent estimation of the size of pneumothoraces.
Table 2.
Performance of visual assessment based on the pneumothorax volumes
| Min (cc) | Max (cc) | Mean (cc) | |
|---|---|---|---|
| Small (n=24) | 1.01 | 151.19 | 31.89 |
| Medium (n=16) | 1.67 | 334.92 | 75.46 |
| Large (n=23) | 9.17 | 771.80 | 264.37 |
Figure 8.
The performance of the three-scaled visual assessment of pneumothoraces. (a) Visual assessment vs. volumetric size. (b) Visual assessment vs. pneumothorax percentage of lung region.
Table 3.
Performance of visual assessment based on the percentages of pneumothoraces compared to lung region.
| Min (%) | Max (%) | Mean (%) | |
|---|---|---|---|
| Small (n=24) | 0.0 7 | 9.22 | 1.54 |
| Medium (n=16) | 0.59 | 8.04 | 3.76 |
| Large (n=23) | 4.26 | 45.75 | 14.20 |
4 DISCUSSION
The results of our study show that the automated CAV scheme provides an accurate measurement of pneumothorax volume in MDCT images of pediatric patients. For accurate volumetric quantification of pneumothorax in children in MDCT images when the automated CAV method is used, we observed that reconstruction parameters based on a slice thickness ≤ 1.5 mm and the reconstruction kernel B70f offers the optimal imaging parameters for an automated computerized volumetry method.
Compared to our previous study on the quantifying of traumatic occult pneumothoraces for adult patients [19], we believe that the current study of the automated CAV scheme for pediatric patients has improved the technique in three important ways.
First, from the technical point of view, the major technical improvement in the current CAV scheme in this study was the development of a new method for extracting the pleural region, named PR-GM, which uses the rib structures as reference for segmentation of the pleural cavity. This method largely reduced the leakage in the segmentation of pleural regions caused by subcutaneous emphysema. Thus, the false-positive rate for all pneumothoraces ≥ 1.0 cc, which was 0.09 per case in this study, was reduced substantially compared to the previous study, where it was 0.9 per case [19].
Second, two important imaging parameters that may affect the accuracy of the CAV scheme, slice thickness and reconstruction kernel, have been investigated in the study. In general, the computerized volumetry generates more accurate results for thin slices and sharp CT images than does that for thick slices and smooth CT images. Based on our study, we recommend that the slice thickness of ≤1.5 mm and the reconstruction kernel B70f or similar reconstruction kernels, which generate sharp images for accurate volumetric quantification, to be used in an automated CAV method for evaluating pneumothorax in children. We noticed that the images of the thickness of 1.5mm produced a slightly better result than the thickness of 1.25mm, which may be caused by the small number of cases in 1.5 mm thickness or the large volume of pneumothoraces in our study. For the purpose of volumetric measurement, we recommended shaper edge images ("B70f" kernel). However, we emphasize that soft edge images ("B31f" kernel) are valuable for evaluating intrathoracic soft-tissues in routine clinical practice.
Third, three-scaled visual assessment of pneumothoraces, which is the routine in current clinical practice, was compared to the quantification results of the CAV scheme. The ranges of the three scales were severely overlapped in both the volumetric size of pneumothoraces and the ratio of the pneumothoraces in respect to the lung region. This indicated that the three-scale assessment is insufficient to provide accurate and reliable information on the size of pneumothoraces.
It is essential that the size (absolute volume or relative ratio) of pneumothorax is critical for the management of pneumothorax. The physicians will benefit from an objective and accurate measurement of pneumothorax for the decision-making of drainage. This benefit is more explicit in the pediatric than adult patients due to the large variability of age and chest size of children. The computerized volumetry provides a more accurate and consistent estimation of pneumothorax than visual assessment. However, application of the computer volumetry in the management of pneumothorax is an on-going clinical research and the future work of the study.
We believe that an automated CAV method for detecting and measuring pneumothorax may be potentially more helpful in detecting pneumothorax in pediatric patients, who have a more variable chest size than do adult patients. Additionally, an automated CAV scheme can be a particularly helpful tool for the detection of pneumothorax in children for adult radiologists who do not routinely evaluate thoracic CT examinations in children
We acknowledge that there were two major limitations to our study. First, our study population was limited to symptomatic pediatric patients with pneumothorax. However, because of the similarity of our findings to the study of both symptomatic and asymptomatic adult patients with occult pneumothorax in our previous study [19], we anticipate that our findings can be generalized to asymptomatic pediatric patients with pneumothorax. Second, we did not make a direct comparison between chest radiographs and MDCT by use of an automated CAV scheme in regard to detecting pneumothorax. Future studies are needed which will investigate the detection rate and the characteristics of missed pneumothorax on chest radiographs but of correctly detected pneumothorax on MDCT by use of an automated CAV method. Despite these limitations, we believe that our results represent an important incremental step toward larger prospective studies that are necessary for a full explanation of the limitations raised in our work.
In conclusion, the results of our study show that our CAV scheme provides an automated method for accurate and reliable detection and measurement of pneumothoraces in MDCT images of pediatric patients. Such an accurate and reliable method has great potential to provide essential information for managing pediatric patients with pneumothorax and to assist the surgeon’s decision-making. Accurate volumetric quantification of pneumothorax in children in MDCT images by use of an automated CAV method can be obtained if one uses reconstruction parameters based on a slice thickness ≤1.5 mm and the reconstruction kernel B70f. Future studies are necessary for help in determining how to apply this technique in clinical practice, and what is its clinical impact.
Acknowledgments
This research was conducted with the support of Grant Number 1 UL1 RR025758-01, Harvard Clinical and Translational Science Center, from the National Center for Research Resources.
Footnotes
Publisher's Disclaimer: This is a PDF file of an unedited manuscript that has been accepted for publication. As a service to our customers we are providing this early version of the manuscript. The manuscript will undergo copyediting, typesetting, and review of the resulting proof before it is published in its final citable form. Please note that during the production process errors may be discovered which could affect the content, and all legal disclaimers that apply to the journal pertain.
References
- 1.Patel RP, Hernanz-Schulman M, Hilmes MA, Yu C, Ray J, Kan JH. Pediatric chest CT after trauma: impact on surgical and clinical management. Pediatr Radiol. 2010;40:1246–1253. doi: 10.1007/s00247-009-1533-x. [DOI] [PubMed] [Google Scholar]
- 2.Trupka A, Waydhas C, Hallfeldt KK, Nast-Kolb D, Pfeifer KJ, Schweiberer L. Value of thoracic computed tomography in the first assessment of severely injured patients with blunt chest trauma: results of a prospective study. J Trauma. 1997;43:405–411. doi: 10.1097/00005373-199709000-00003. discussion 411–412. [DOI] [PubMed] [Google Scholar]
- 3.Ball CG, Kirkpatrick AW, Laupland KB, et al. Factors related to the failure of radiographic recognition of occult posttraumatic pneumothoraces. Am J Surg. 2005;189:541–546. doi: 10.1016/j.amjsurg.2005.01.018. discussion 546. [DOI] [PubMed] [Google Scholar]
- 4.Omert L, Yeaney WW, Protetch J. Efficacy of thoracic computerized tomography in blunt chest trauma. Am Surg. 2001;67:660–664. [PubMed] [Google Scholar]
- 5.Light RW. Management of spontaneous pneumothorax. Am Rev Respir Dis. 1993;148:245–248. doi: 10.1164/ajrccm/148.1.245. [DOI] [PubMed] [Google Scholar]
- 6.Collins CD, Lopez A, Mathie A, Wood V, Jackson JE, Roddie ME. Quantification of pneumothorax size on chest radiographs using interpleural distances: regression analysis based on volume measurements from helical CT. AJR Am J Roentgenol. 1995;165:1127–1130. doi: 10.2214/ajr.165.5.7572489. [DOI] [PubMed] [Google Scholar]
- 7.Hoi K, Turchin B, Kelly AM. How accurate is the Light index for estimating pneumothorax size? Australas Radiol. 2007;51:196–198. doi: 10.1111/j.1440-1673.2007.01705.x. [DOI] [PubMed] [Google Scholar]
- 8.Neff MA, Monk JS, Jr, Peters K, Nikhilesh A. Detection of occult pneumothoraces on abdominal computed tomographic scans in trauma patients. J Trauma. 2000;49:281–285. doi: 10.1097/00005373-200008000-00015. [DOI] [PubMed] [Google Scholar]
- 9.Cameron P. Textbook of adult emergency medicine. New York ; Edinburg: Churchill Livingstone; 2000. [Google Scholar]
- 10.Noppen M, De Keukeleire T. Pneumothorax. Respiration. 2008;76:121–127. doi: 10.1159/000135932. [DOI] [PubMed] [Google Scholar]
- 11.Ball CG, Kirkpatrick AW, Laupland KB, et al. Incidence, risk factors, and outcomes for occult pneumothoraces in victims of major trauma. J Trauma. 2005;59:917–924. doi: 10.1097/01.ta.0000174663.46453.86. discussion 924–925. [DOI] [PubMed] [Google Scholar]
- 12.Stafford RE, Linn J, Washington L. Incidence and management of occult hemothoraces. Am J Surg. 2006;192:722–726. doi: 10.1016/j.amjsurg.2006.08.033. [DOI] [PubMed] [Google Scholar]
- 13.Ball CG, Lord J, Laupland KB, et al. Chest tube complications: how well are we training our residents? Can J Surg. 2007;50:450–458. [PMC free article] [PubMed] [Google Scholar]
- 14.Enderson BL, Abdalla R, Frame SB, Casey MT, Gould H, Maull KI. Tube thoracostomy for occult pneumothorax: a prospective randomized study of its use. J Trauma. 1993;35:726–729. discussion 729–730. [PubMed] [Google Scholar]
- 15.Etoch SW, Bar-Natan MF, Miller FB, Richardson JD. Tube thoracostomy. Factors related to complications. Arch Surg. 1995;130:521–525. doi: 10.1001/archsurg.1995.01430050071012. discussion 525–526. [DOI] [PubMed] [Google Scholar]
- 16.Bailey RC. Complications of tube thoracostomy in trauma. J Accid Emerg Med. 2000;17:111–114. doi: 10.1136/emj.17.2.111. [DOI] [PMC free article] [PubMed] [Google Scholar]
- 17.Johnson G. Traumatic pneumothorax: is a chest drain always necessary? J Accid Emerg Med. 1996;13:173–174. doi: 10.1136/emj.13.3.173. [DOI] [PMC free article] [PubMed] [Google Scholar]
- 18.Plurad D, Green D, Demetriades D, Rhee P. The increasing use of chest computed tomography for trauma: is it being overutilized? J Trauma. 2007;62:631–635. doi: 10.1097/TA.0b013e31802bf009. [DOI] [PubMed] [Google Scholar]
- 19.Cai W, Tabbara M, Takata N, et al. MDCT for automated detection and measurement of pneumothoraces in trauma patients. AJR Am J Roentgenol. 2009;192:830–836. doi: 10.2214/AJR.08.1339. [DOI] [PubMed] [Google Scholar]
- 20.Cai W, Holalkere N, Harris G, Sahani D, Yoshida H. Dynamic-threshold level set method for volumetry of porcine kidney in CT images: in-vivo and ex-vivo assessment of the accuracy of volume measurement. Acad Radiol. 2007;14:890–896. doi: 10.1016/j.acra.2007.03.005. [DOI] [PubMed] [Google Scholar]
- 21.Bland JM, Altman DG. Statistical methods for assessing agreement between two methods of clinical measurement. Lancet. 1986;1:307–310. [PubMed] [Google Scholar]
- 22.Bland JM, Altman DG. Measuring agreement in method comparison studies. Stat Methods Med Res. 1999;8:135–160. doi: 10.1177/096228029900800204. [DOI] [PubMed] [Google Scholar]


