Abstract
A custom built coherent anti-Stokes Raman scattering (CARS) microscope was used to image prostatic glands and nerve structures from 17 patients undergoing radical prostatectomy. Imaging of glandular and nerve structures showed distinctive cellular features that correlated to histological stains. Segmentation of cell nucleus was performed to establish a cell feature-based model to separate normal glands from cancer glands. In this study, we use a single parameter, average cell neighbor distance based on CARS imaging, to characterize normal and cancerous glandular structures. By combining CARS with our novel classification model, we are able to characterize prostate glandular and nerve structures in a manner that potentially enables real-time, intra-operative assessment of surgical margins and neurovascular bundles. As such, this method could potentially improve outcomes following radical prostatectomy.
OCIS codes: (180.4315) Nonlinear microscopy, (170.1610) Clinical applications, (170.3880) Medical and biological imaging, (170.4580) Optical diagnostics for medicine
1. Introduction
Prostate cancer remains a global health concern, accounting for approximately 900,000 new cases annually worldwide [1]. Radical prostatectomy is the most common treatment for men diagnosed with clinically localized prostate disease in the Western world. In this surgical procedure, the entire prostate is removed, and the bladder is reconnected to the urethra [2]. The three main domains assessed to determine radical prostatectomy efficacy are cancer control and post-operative urinary and erectile function [3]. While there are distinct factors that may contribute to each, all are dependent, to some degree, on surgical techniques [4]. In an effort to improve intra-operative decision-making with respect to surgical plane dissection (i.e., surgical margins) and erectile function recovery (i.e., neurovascular bundle preservation), we sought to test the feasibility of utilizing CARS technology to visualize prostate and nerve tissues.
Positive surgical margins on final pathology from a radical prostatectomy specimen imply that residual cancer may be present in the surgical bed. While not universally a poor prognostic sign, positive surgical margins can be a source of disease recurrence [5]. During surgical removal of the prostate, it is not always possible to clearly distinguish prostate from non-prostate tissue and benign from malignant prostate tissue. Currently, surgeons must send samples of tissue for frozen section diagnosis to evaluate prostate margin, which takes about 20 minutes [6]. It is true that this technique is well-established and effective [7–9]. At the same time, however, it may prolong surgery as a result of the time needed to process and interpret frozen section specimens, especially if multiple areas are sampled. Therefore, an intra-operative tool to visualize surgical margins in real-time during surgery would have significant clinical value in that it would facilitate faster analysis of a greater number of areas of concern.
Nerve-sparing anatomic prostatectomy is the most widely employed technique to preserve potency following extirpative surgery for prostate cancer [10]. The preservation of post-operative erectile function currently depends on the exercise of tactile techniques and utilization of visual cues during surgery; however, currently it is only possible to use anatomical landmarks to determine which nerve tissue should be the locus of the nerve-sparing procedure [10]. Cavernous nerve (CN) fibers themselves are not visible; only the fibrofatty tissue encasing the nerve bundle is visible. This lack of precise intra-operative nerve identification, when coupled with various other factors, such as pre-operative erectile function and the intra-operative use of diathermy for hemostasis, contributes to the overall challenge of minimizing nerve tissue damage during surgery and optimizing erectile function after surgery [11].
To meet this challenge, we investigated the feasibility of using CARS as an intra-operative imaging tool. In this study, human prostate and CN tissues are successfully imaged using a CARS microscope with cellular resolution. A single parameter, average cell neighbor distance based on CARS imaging, was presented as an effective parameter for characterization of normal and cancerous glandular structures. Therefore, our findings offer a high-resolution and label-free strategy for the detection of prostate and peri-prostatic tissue. CARS utilizes nonlinear excitation of intrinsic chemical bonds to form optical contrasts, allowing chemically selective imaging of targeted vibrational transitions in unstained samples, with sub-wavelength spatial resolution [12]. Its highly directionally coherent nature generates strong CARS signals and offers high sensitivity and video-speed imaging rates [13,14]. Because of these advantages, the CARS imaging technique has been used to visualize various tissue structures, such as lung and kidney [12]. In particular, a static body nerve was previously imaged by CARS [15]. Since these results support the possibility of using CARS for the detection of prostate structures, especially prostate glands and CNs, it is entirely feasible that surgeons might be able to characterize prostate and peri-prostatic structures and thus better determine surgical margins and preserve CNs.
2. Materials and methods
2.1. Optical imaging system
The optical source system is composed of an optical parametric oscillator (OPO) and an Nd:YVO4 laser. The Nd:YVO4 laser delivers 7-ps, 76-MHz pulse trains at both 532 nm and 1,064 nm wavelengths. The Stokes wave is 1,064 nm, while 532 nm is used to pump the OPO, which generates a tunable 5-ps output from 670 nm to 980 nm. The pump and Stokes beams are overlapped both temporally and spatially to generate CARS signals. A dichroic mirror is used to separate CARS signals from excitation ps lasers. A bandpass filter (hq660/40m-2P, 25 mm diameter, Chroma Inc.) is placed before the detectors to collect CARS signals and block unwanted backgrounds. The microscopy system is modified from an FV300 confocal laser scanning microscope (Olympus, Japan), which is able to detect both backward (Epi-) and forward CARS signals. A 1.2-NA water immersion objective lens (60x, Olympus) is used with a resolution of 0.4 μm and 0.9 µm in the lateral and axial directions, respectively [16]. The schematic of the microscopy setup is illustrated in Fig. 1 .
Fig. 1.
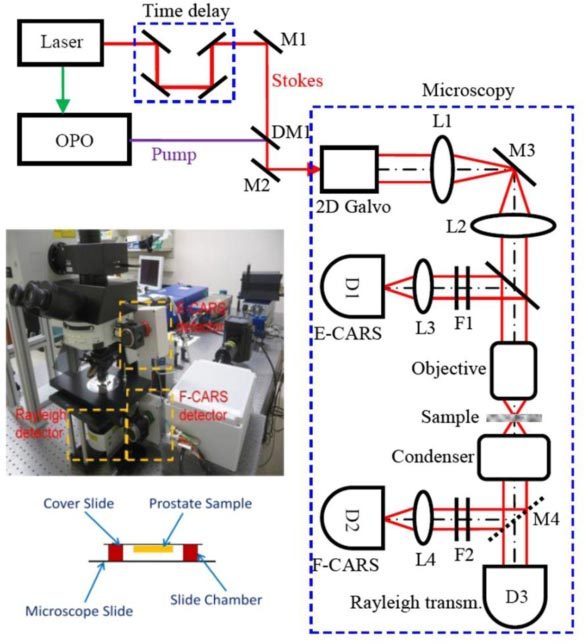
Schematic of the CARS microscopy system. The pump (816.7 nm) and Stokes (1,064 nm) beams are overlapped, both temporally and spatially, and delivered into a microscopy system. A dichroic mirror is used to separate CARS signals from excitation lasers for detection. D: PMT detector; DM: dichroic mirror; F: filter; L: lens; M: mirror
2.2. Patient population and animal model
Fresh human prostate tissues were obtained from 16 patients undergoing radical prostatectomy following Office of Human Subjects Research approval from The Methodist Hospital Research Institute (TMHRI). A transverse cut was made through the midportion of the prostate, and a small piece of sample (5 mm in each dimension) was taken in the peripheral zone for analysis. Human CN tissues were acquired from a non-nerve sparing prostatectomy patient for nerve imaging.
2.3. Imaging strategies
All samples were imaged ex vivo on a glass slide using the CARS microscope. An imaging chamber was created using an adhesive slide chamber. Prostate and nerve tissues were placed on a cover slip, which was reversely placed on the chamber to keep the samples from being pressed (Fig. 1). Z-stacks were chosen to better capture 3-D structures of the tissue. All z-stacks were acquired at an X-Y dimension of 200 μm x 200 μm and a Z-scale of about 30 μm with 1 μm step size. The beating frequency was tuned to 2,845 cm−1 to probe the CARS signals originating from symmetric CH2 stretching bonds [12] and CARS signals were always detected in the epi-direction with a frame rate of 3.93 s in this study. The average power of each incident laser beam on the image plane was kept at less than 70 mW to protect the sample from photodamage. Two to four z-stacks were acquired for each specimen from different locations. In the normal cases, imaged locations were chosen to contain both glands and stroma to test the system’s capability to identify the two typical types of structures within the prostate. In the cancer cases, imaged locations were chosen to contain predominantly glandular structures to test the classification system in distinguishing normal glands from cancer glands. After CARS imaging, the specimens were marked by india blue to indicate the imaged side, sectioned perpendicularly to the microscopic axis, stained with H&E and finally examined by a surgical pathologist to determine the type of tissue as a standard control. Eleven of these samples were determined to be normal, while five of these samples were determined to be cancer. No discernable photodamage was detected on the H&E slides.
2.4. Data Analysis
Quantitative analysis was performed to separate cancer from non-cancer samples, supporting the potential of the system for clinical applications in determining surgical margins. To this end, a semi-automatic segmentation algorithm was developed to precisely delineate boundaries of cell nucleus (Fig. 5 (A) below). The algorithm consists of one manual step and four automatic steps to obtain an accurate nuclear boundary, as shown in Fig. 5 (B-F). 1) A point within the cell nucleus is selected by the user. 2) An image patch in a square window with predefined size and a center at the selected point is cropped, and the target cell is contained in this square window. 3) A seeded watershed algorithm [17–19] is applied on the image patch to obtain a rough cell nucleus region. 4) Using a thresholding, or image segmentation process, the intensity of pixels within the square is measured, and another rough nuclear region (binary image) is identified. Pixel intensity is defined as being within [m-1.75*δ, m + 1.75*δ], where m and δ are the average intensity and standard deviation in a neighborhood of the center point. 5) Finally, an ellipse is fitted to the refined cell nucleus region (overlapping the watershed and thresholding results), using the least square fitting criterion [20], to obtain a refined nuclear boundary. Following nuclear segmentation, five cellular features were calculated, including nuclear size, maximum, minimum and average neighbor distance of a cell in the Delaunay Triangulation graph (Fig. 5 (G)) [21] and variation of nuclear orientation between adjacent cells. Nuclear orientation is defined as an angle, (arc degree), between the major axis of a cell nucleus (fitted by an ellipse) and the x-axis. The variation of nuclear orientation was then defined as the difference (absolute value) of this nuclear orientation value between one cell and its closest neighbor in the Delaunay Triangulation graph. In addition, a manual ellipse-fitting algorithm was developed to segment a small fraction of cell nuclei that cannot be well processed using the semi-automatic approach. In this algorithm, the user needs to select four points on the boundaries of the cell nucleus in order to generate an accurate cell fitting. Each z-stack was considered as an independent sample, and three images (at least 5 μm apart in depth from the first 20 μm of each z-stack) within each stack were used for analysis. It took about 1-2 minutes for segmentation of all three images from each sample using this semi-automated segmentation strategy. Because of the diversity among different cells within each image, the measurement of each feature resulted in producing a unique distribution. To characterize these distributions, we then made use of the mean value and standard deviation of each distribution, leading to a total of 10 quantitative features (a 10-element vector) to represent each sample. A Principle Components Analysis (PCA) [22] was further performed to reduce the data dimensionality and reach immediate visualization of the data distribution. The basic idea of PCA analysis is to analyze the data in a lower dimensional space. In brief, PCA maps data points from the raw coordinate system into a new coordinate system with lower dimensions [22]. The first coordinate in the new coordinate space is chosen such that the projection of the raw data points on this coordinate has the maximum variance. As such, this coordinate will effective reflects the variability of raw data points. The second coordinate can then be determined in a similar way considering the data variance, but with the constraint to be orthogonal to the first coordinate.
Fig. 5.
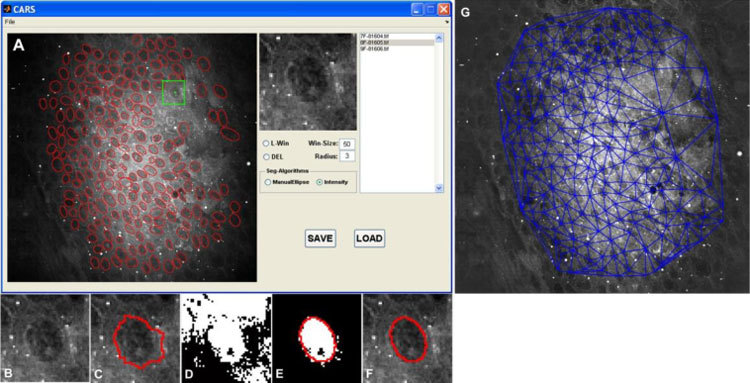
Overview of the nuclear segmentation process and the resulting Delaunay Triangulation graph. (A) Snapshot of graphic user interface of CARS image analysis software; Red ellipses are the delineated cell boundaries. The green star represents one of the user-selected points, while the green square box indicates the image patch which will be processed; intermediate results: (B) targeted nucleus; (C) watershed segmentation algorithm; (D) local thresholding; (E) Ellipse fitting; (F) final result. (G) Delaunay Triangulation on the segmented image.
3. Experimental results
Using CARS imaging, we were able to obtain images of both normal and cancerous prostate glands and CNs with sufficient resolution and level of contrast to allow identification of cellular structures and comparison to those from H&E stain. Figure 2 (A-E) illustrates representative CARS and H&E images of a normal prostate gland and its surrounding stroma. Normal glands show well-oriented epithelial structures with a predominance of relatively large glands organized into lobules, with the stroma consisting predominantly of mature fibrous tissue. These structures are closely correlated with the H&E picture from the same gland and stoma area (Fig. 2 (C) and (E)). The 3-D sectioning capability of the CARS technique was further utilized for revealing glandular epithelium structures at different depths. Figure 3 illustrates CARS images acquired from various imaging planes. The epithelial cells show polygonal structures on the surface (Fig. 3 (C)), and their nuclei are observed at a deeper plane (Fig. 3 (D)). CARS signals in these images mainly originate from lipid-rich cell and nuclear membrane structures.
Fig. 2.
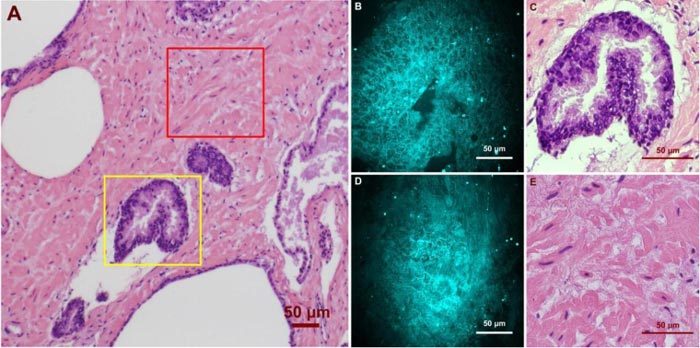
Ex vivo images of human prostate gland and stroma structures using CARS and H&E stain. (A) A low magnification image shows the position of the imaged glandular (Yellow Square) and stroma (Red Square) areas. (B)/(C) high magnification CARS/H&E images of the prostate gland marked in (A). (D)/(E) high magnification CARS/H&E images of the stroma region marked in (A).
Fig. 3.
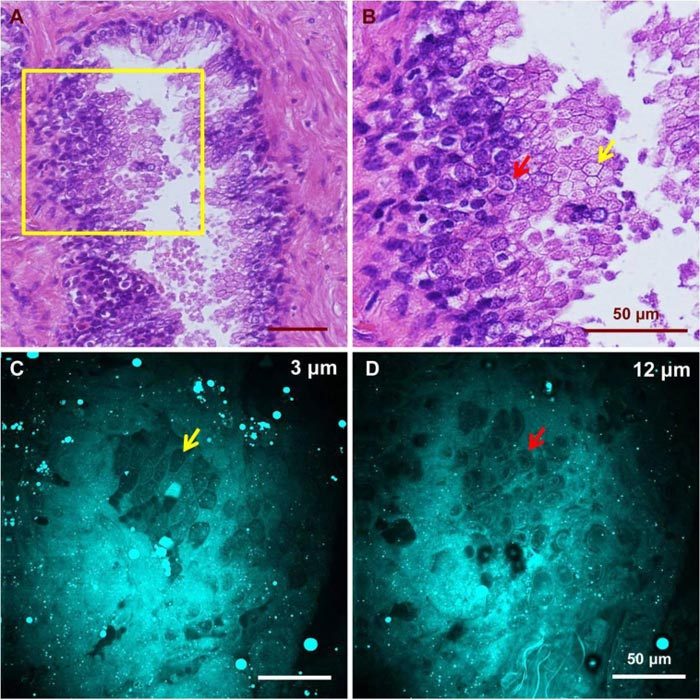
CARS images of glandular epithelium structures at different depths and H&E images from a similar gland. (A) H&E image of a normal gland showing the appearance of glandular epithelial cells from different imaging planes. (B) Higher magnification image of the highlighted region in (A) showing different appearance of epithelial cells caused by variation in focal planes. Red and yellow arrows point to cells with and without a visible nucleus, respectively. CARS images from a similar gland show epithelial cells as polygons (C) at a shallow plane and with visible nuclei at a deeper plane (D). Cells indicated by the red and yellow arrows in (C) and (D) have structures comparable to those marked in (B).
Unlike normal glands, cancerous glands possessed crowded and more poorly oriented cellular structures with greater variation of nuclear size and shape. Figure 4 shows images of cancerous structures from three cancer patients with Gleason scores of 9, 8, and 9, respectively. Patient 1 (Fig. 4 (A-C), Media 1 (53.3MB, AVI) ) has small malignant glands with distinct cell nucleoli apparent in the cell nuclei. Patient 2 (Fig. 4 (D-E), Media 2 (45.8MB, AVI) ) has larger and more complex glands than patient 1, but once again, nucleoli are apparent in some cells. Variation of nuclear size and shape is another distinct feature seen in patient 2. Some of the epithelial cells contain prominent secretory material in the cytoplasm, and this feature is also captured in the CARS image (Fig. 4 (F)). Patient 3 (Fig. 4 (G-I), Media 3 (30.8MB, AVI) ) shows similar features in the imaged area, with significant nuclear pleomorphism and nucleoli seen.
Fig. 4.
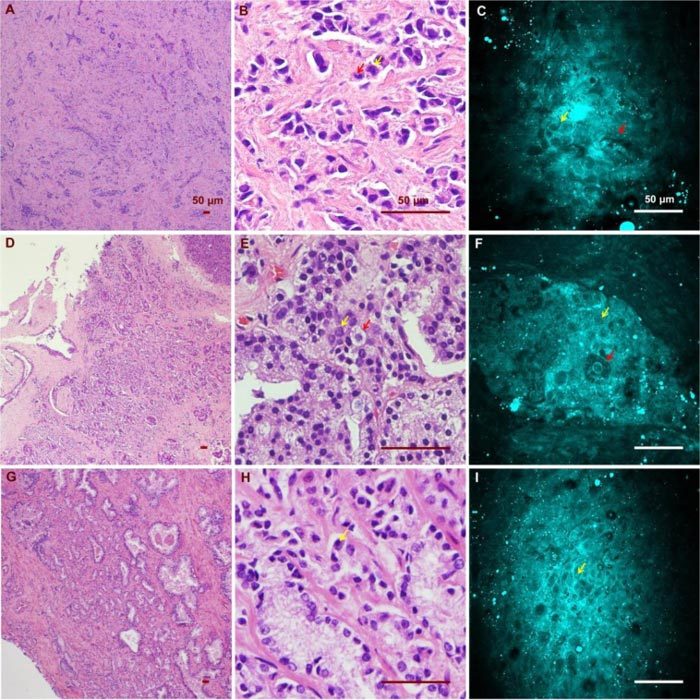
CARS and H&E images of cancerous glands from three patients. (A)(B)(C) Low/ high magnification H&E images and a CARS image from the first patient (Media 1 (53.3MB, AVI) ). Red and yellow arrows point to an enlarged epithelial cell and a distinctive cell nucleolus, respectively. (D)(E)(F) Low/ high magnification H&E images and a CARS image from the same patient (Media 2 (45.8MB, AVI) ). Red and yellow arrows point to an enlarged epithelial cell containing prominent secretory material in the cytoplasm and a cancerous epithelial cell of relatively normal size. (G)(H)(I) Low/high H&E and CARS results from the third patient, who possesses significant nuclear pleomorphism (Media 3 (30.8MB, AVI) ). Yellow arrow points to a distinctive cell nucleolus.
These distinctive cellular features are captured through the cell segmentation and feature extraction processes. Figure 6 (A-E) shows distributions of the five defined cellular features. The distribution patterns indicate maximum and average neighbor distance as promising features for separation of cancerous from normal glands. Quantitative analysis using PCA shows a clear separation of normal from cancer glands. Figure 6 (F) further illustrates separable 95% confident intervals for normal and cancer categories based on the Chi-square distribution [23] on the sample sets. Based on PCA results, we further investigated the coefficients of the top two principal components (Table 1 ). As expected, for the first principal component, means and standard deviations of all neighbor distances (min, max and average) possess top-ranked coefficients, indicating their greater contribution to the separation process than the rest of the features. Therefore, we further studied the classification capability of the three neighbor distance features and found that the average distance has the best performance in separating cancer from normal tissues. Figure 6 (G) shows the box plot of normal and cancer groups using the standard deviation of average cell neighbor distance as a single feature. Student’s t-test based on this plot shows a significant difference between the two groups (P<0.01, two tails), supporting the capability of this a single parameter from CARS images to characterize normal and cancerous glandular structures.
Fig. 6.
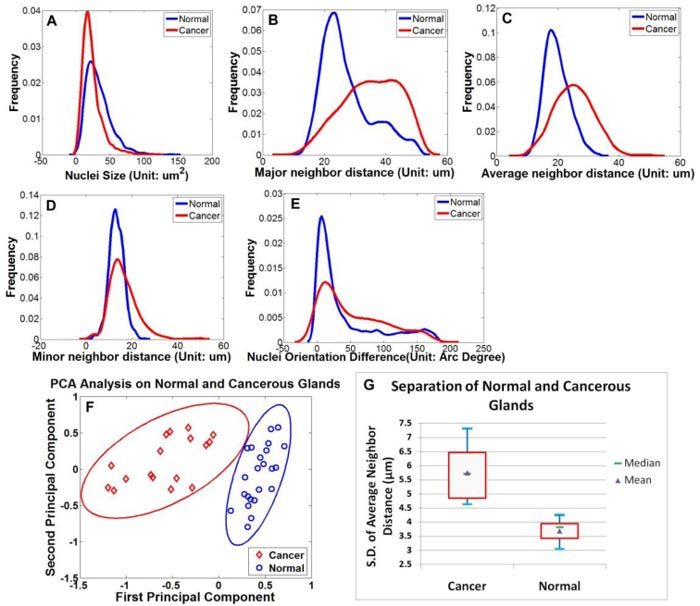
Feature extraction and PCA analysis. (A)-(E) Distribution of the five extracted features of the normal (blue) and cancer group (red); (F) Following PCA analysis, the spatial distribution of 23 normal sample sets and 17 cancer sample sets are plotted in the top two principal components space. The eclipses around the data points are 95% confidence intervals for normal (red) and cancer (blue) groups, showing a significant separation between the two groups. (G) Box plot of normal and cancer groups using a single-feature standard deviation of average cell neighbor distance. Blue bars represent samples’ maximum and minimum, while red quadrangles indicate higher and lower quartiles of the samples.
Table 1. Coefficients of top two principal components in the 10-feature space. NS: Nuclear Size; NDV: Neighbor Distance Variation; Ave ND: Average Neighbor Distance; Max ND: Maximum Neighbor Distance; Min ND: Minimum Neighbor Distance.
| Mean |
Standard Deviation |
||||||||||
|---|---|---|---|---|---|---|---|---|---|---|---|
| Features | NS | NDV | Ave ND | Max ND | Min ND | NS | NDV | Ave ND | Max ND | Min ND | |
| Principal Component 1 | 0.15 | 0.13 | -0.42 | -0.46 | -0.37 | 0.06 | 0.01 | -0.45 | 0.11 | -0.47 | |
| Principal Component 2 | -0.69 | 0.09 | 0.15 | 0.09 | 0.26 | -0.59 | 0.04 | 0.11 | 0.24 | 0.06 | |
For nerve imaging, our system was able to resolve CNs on a 3-D scale. Figure 7 shows a two-dimensional projection of a CN using a 45-μm deep z-stack and its corresponding H&E results. CARS signals mainly originated from lipid-rich myelin sheaths on the outer surface of the nerve fibers. As a result, individual nerve fibers were better illustrated in the cross-sectional images.
Fig. 7.
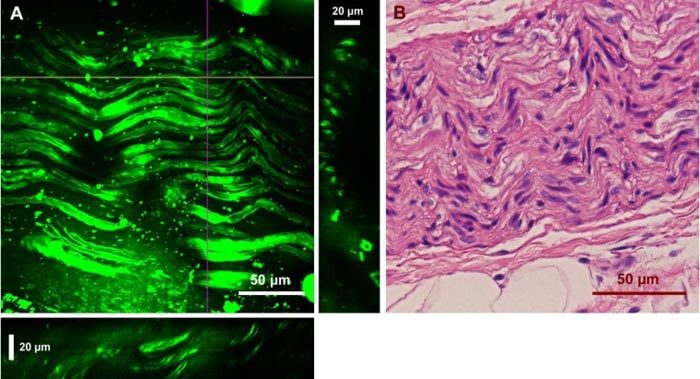
Ex vivo images of a human cavernous nerve using CARS and the H&E stained structure of the same nerve. (A) Two-dimensional projection of 45 images from a z-stack with a step size of 1 μm. YZ and XZ cross sections are presented in the right and bottom panels, which were constructed from the depth stack along the purple and yellow lines, respectively. (C) H&E image of the same nerve.
4. Discussion
In recent years, intra-operative imaging modalities have been widely explored to provide direct visualization of prostate and peri-prostatic structures to improve the rate of nerve preservation and post-operative potency. Fluorescent tracers, which are used to label CNs, have been successfully imaged with a confocal fiber optic probe [24], but they are limited by the safety and approval for human use. From a translational perspective, label-free techniques have an advantage in that they avoid the use of exogenous agents. For example, optical coherent tomography (OCT) [25] and two-photon excited autofluorescence microscopy [26], as direct imaging strategies, have been able to resolve prostatic tissue structure. Unfortunately, these techniques are hindered by limited specificity.
Aiming at these challenges, we have tested the feasibility of utilizing the CARS technique to image prostatic structures. Although there has been extensive previous work using CARS for tissue [12,13,15] and cell imaging [27], preclinical experimental work is rare [28], and up to now, no data are available for prostate applications. Our results demonstrate, for the first time, the capability of CARS to identify normal and cancerous prostate glandular structures as well as CNs. Since the human prostate has a poorly defined capsule, intra-operative characterization of the glandular structures may potentially allow better separation of prostate tissue from peri-prostatic structures, thus enabling better determination of the boundary of the prostate. Our novel cellular-feature-based image analysis approach has broadened the clinical application of the CARS technique in diagnosing cancers and other diseases by quantifying the morphological features that can be identified by this technology, well utilizing its high-resolution and label-free properties. Our study has also demonstrated high-resolution imaging of CNs. Compared to adjacent muscle and prostatic tissues, CNs and adipose cells in nearby soft tissue possessed much brighter CARS emissions and thus required a lower gain for imaging. We believe that the CARS imaging morphology of nerve tissue is so strikingly distinctive that surgeons would be able to reliably identify nerves in most instances without having to call on pathologists. Therefore, this technology has the potential to decrease the rate of erectile function loss following radical prostatectomy procedures via improved neurovascular bundle identification.
The current ex vivo study serves as proof-of-concept for future in vivo applications. Further miniaturization of our CARS platform into a microendoscope will be required for in vivo applications, along with thorough testing to ensure that the lasers will not cause unacceptable injury to probed tissue. This work is ongoing. Nevertheless, given the increasing efforts aimed at miniaturizing the CARS technique for fiber-based imaging [16,29,30], the miniaturization of this system is highly promising. In addition, the current ex vivo approach has significant value, even without the incorporation of an endoscope setup, as it could be readily used to examine surgical excisions during prostatectomy for evaluation of cancer margin and neurovascular bundles. The estimated time to analyze each tissue sample, including imaging and analysis, is under 5 minutes which is much shorter than the typical 20 minute delay for frozen section analysis. Therefore, without frozen sectioning and the associated delays, our approach can significantly facilitate the surgical process and thus reduce surgical costs and patient suffering.
For future application of this technology, we envision surgeons having a probe that could be used, either manually or robotically, to provide real-time visualization of margins of concern. With high resolution, such probes would allow surgeons to pinpoint areas requiring further frozen section analysis to rule out carcinoma. Differentiating between benign and malignant glands in prostate tissue is often challenging, even for experienced pathologists examining conventional histology [31], so it is not realistic to expect urologists to be able to make this distinction using CARS unaided. However, since cancerous glands appear to have distinctive cytologic and architectural features on CARS imaging, especially in higher grade tumors (Gleason pattern 4 or 5), it may be possible, with further study, to identify criteria that would enable pathologists to render real-time diagnoses of carcinoma using CARS images alone, at least in some instances, without frozen sectioning analysis. Additionally, following development and validation, future application of our technology may involve sending a live CARS image feed to a pathologist for real-time assessment intra-operatively. Further improvement of algorithmic image-analysis tools based on current results will be another strategy to facilitate the integration of the CARS imaging system with current surgical approaches as computerized decision making systems. As a result, this CARS-based approach could potentially improve and fundamentally change the practice of nerve-sparing approaches to radical prostatectomy by offering a cost-effective, label-free strategy for characterization of surgical margins and peri-prostatic structures.
5. Conclusion
In this study, we demonstrated, for the first time, the feasibility of using the CARS imaging technique to detect prostate glands and CNs with cellular resolution using intrinsic molecular contrast. The current approach is readily compatible with radical prostatectomy for ex vivo examination of surgical excisions for facilitated evaluation. Further improvement in the CARS technology holds promise for the intra-operative identification of prostatic and peri-prostatic structures, thereby potentially improving the ability of surgeons to determine prostate margin status as well as maximally preserve CNs in real time.
Acknowledgments
The funding of this research is supported by John S Dunn Foundation, Bioengineering and Bioinformatics Program and Research Scholars Grant Award of The Methodist Hospital Research Institute to Stephen T. C. Wong. The authors would like to thank Dr. David P. Bernard, Pam McShane and Beverly Grice of the Department of Pathology and Laboratory Medicine from TMH for their help in obtaining human tissue samples, as well as Dr. Rebekah A. Drezek from Rice University for critical reading of the manuscript.
References and links
- 1.W. International Agency for Research on Cancer, “Cancer Incidence and Mortality Worldwide in 2008” (2008), http://globocan.iarc.fr/
- 2.Su L. M., “Robot-assisted radical prostatectomy: advances since 2005,” Curr. Opin. Urol. 20(2), 130–135 (2010). 10.1097/MOU.0b013e328336257a [DOI] [PubMed] [Google Scholar]
- 3.Le C. Q., Gettman M. T., “Laparoscopic and robotic radical prostatectomy,” Expert Rev. Anticancer Ther. 6(7), 1003–1011 (2006). 10.1586/14737140.6.7.1003 [DOI] [PubMed] [Google Scholar]
- 4.Gontero P., Kirby R. S., “Nerve-sparing radical retropubic prostatectomy: techniques and clinical considerations,” Prostate Cancer Prostatic Dis. 8(2), 133–139 (2005). 10.1038/sj.pcan.4500781 [DOI] [PubMed] [Google Scholar]
- 5.Grossfeld G. D., Chang J. J., Broering J. M., Miller D. P., Yu J., Flanders S. C., Henning J. M., Stier D. M., Carroll P. R., “Impact of positive surgical margins on prostate cancer recurrence and the use of secondary cancer treatment: data from the CaPSURE database,” J. Urol. 163(4), 1171–1177, quiz 1295 (2000). 10.1016/S0022-5347(05)67716-6 [DOI] [PubMed] [Google Scholar]
- 6.Novis D. A., Zarbo R. J., “Interinstitutional comparison of frozen section turnaround time. A College of American Pathologists Q-Probes study of 32868 frozen sections in 700 hospitals,” Arch. Pathol. Lab. Med. 121(6), 559–567 (1997). [PubMed] [Google Scholar]
- 7.Heidenreich A., “Intraoperative frozen section analysis to monitor nerve-sparing radical prostatectomy,” Eur. Urol. 49(6), 948–949 (2006). 10.1016/j.eururo.2006.02.064 [DOI] [PubMed] [Google Scholar]
- 8.Eichelberg C., Erbersdobler A., Haese A., Schlomm T., Chun F. K., Currlin E., Walz J., Steuber T., Graefen M., Huland H., “Frozen section for the management of intraoperatively detected palpable tumor lesions during nerve-sparing scheduled radical prostatectomy,” Eur. Urol. 49(6), 1011–1018 (2006). 10.1016/j.eururo.2006.02.035 [DOI] [PubMed] [Google Scholar]
- 9.Goharderakhshan R. Z., Sudilovsky D., Carroll L. A., Grossfeld G. D., Marn R., Carroll P. R., “Utility of intraoperative frozen section analysis of surgical margins in region of neurovascular bundles at radical prostatectomy,” Urology 59(5), 709–714 (2002). 10.1016/S0090-4295(02)01539-X [DOI] [PubMed] [Google Scholar]
- 10.Rodriguez E., Melamud O., Ahlering T. E., “Nerve-sparing techniques in open and laparoscopic prostatectomy,” Expert Rev. Anticancer Ther. 8(3), 475–479 (2008). 10.1586/14737140.8.3.475 [DOI] [PubMed] [Google Scholar]
- 11.Burnett A. L., “Erectile dysfunction following radical prostatectomy,” JAMA 293(21), 2648–2653 (2005). 10.1001/jama.293.21.2648 [DOI] [PubMed] [Google Scholar]
- 12.Evans C. L., Xie X. S., “Coherent anti-stokes Raman scattering microscopy: chemical imaging for biology and medicine,” Annu Rev Anal Chem (Palo Alto Calif) 1(1), 883–909 (2008). 10.1146/annurev.anchem.1.031207.112754 [DOI] [PubMed] [Google Scholar]
- 13.Evans C. L., Potma E. O., Puoris’haag M., Côté D., Lin C. P., Xie X. S., “Chemical imaging of tissue in vivo with video-rate coherent anti-Stokes Raman scattering microscopy,” Proc. Natl. Acad. Sci. U.S.A. 102(46), 16807–16812 (2005). 10.1073/pnas.0508282102 [DOI] [PMC free article] [PubMed] [Google Scholar]
- 14.Evans C. L., Potma E. O., Xie X. S., “Coherent anti-stokes raman scattering spectral interferometry: determination of the real and imaginary components of nonlinear susceptibility χ(3) for vibrational microscopy,” Opt. Lett. 29(24), 2923–2925 (2004). 10.1364/OL.29.002923 [DOI] [PubMed] [Google Scholar]
- 15.Huff T. B., Cheng J. X., “In vivo coherent anti-Stokes Raman scattering imaging of sciatic nerve tissue,” J. Microsc. 225(2), 175–182 (2007). 10.1111/j.1365-2818.2007.01729.x [DOI] [PMC free article] [PubMed] [Google Scholar]
- 16.Wang Z., Yang Y., Luo P., Gao L., Wong K. K., Wong S. T. C., “Delivery of picosecond lasers in multimode fibers for coherent anti-Stokes Raman scattering imaging,” Opt. Express 18(12), 13017–13028 (2010). 10.1364/OE.18.013017 [DOI] [PubMed] [Google Scholar]
- 17.S. Beucher, “The watershed transformation applied to image segmentation,” in Scanning Microscopy International (1991), vol. 6, pp. 299–314. [Google Scholar]
- 18.Vincent L., Soille P., “Watersheds in digital spaces: an efficient algorithm based on immersion simulations,” IEEE Trans. Pattern Anal. Mach. Intell. 13(6), 583–598 (1991). 10.1109/34.87344 [DOI] [Google Scholar]
- 19.Wang M., Zhou X., Li F., Huckins J., King R. W., Wong S. T. C., “Novel cell segmentation and online SVM for cell cycle phase identification in automated microscopy,” Bioinformatics 24(1), 94–101 (2007). 10.1093/bioinformatics/btm530 [DOI] [PubMed] [Google Scholar]
- 20.Gander W., Golub G. H., Strebel R., “Least-squares fitting of circles and ellipses,” BIT Numerical Math. 34(4), 558–578 (1994). 10.1007/BF01934268 [DOI] [Google Scholar]
- 21.Li F., Zhou X., Ma J., Wong S. T., “Multiple nuclei tracking using integer programming for quantitative cancer cell cycle analysis,” IEEE Trans. Med. Imaging 29(1), 96–105 (2010). 10.1109/TMI.2009.2027813 [DOI] [PMC free article] [PubMed] [Google Scholar]
- 22.I. T. Jolliffe, Principal Component Analysis (Springer-Verlag, New York, 2002). [Google Scholar]
- 23.Alexandersson A., “Graphing confidence ellipses: An update of ellip for Stata 8,” Stata J. 4, 242–256 (2004). [Google Scholar]
- 24.Boyette L. B., Reardon M. A., Mirelman A. J., Kirkley T. D., Lysiak J. J., Tuttle J. B., Steers W. D., “Fiberoptic imaging of cavernous nerves in vivo,” J. Urol. 178(6), 2694–2700 (2007). 10.1016/j.juro.2007.07.124 [DOI] [PubMed] [Google Scholar]
- 25.Rais-Bahrami S., Levinson A. W., Fried N. M., Lagoda G. A., Hristov A., Chuang Y., Burnett A. L., Su L. M., “Optical coherence tomography of cavernous nerves: a step toward real-time intraoperative imaging during nerve-sparing radical prostatectomy,” Urology 72(1), 198–204 (2008). 10.1016/j.urology.2007.11.084 [DOI] [PubMed] [Google Scholar]
- 26.Yadav R., Mukherjee S., Hermen M., Tan G., Maxfield F. R., Webb W. W., Tewari A. K., “Multiphoton microscopy of prostate and periprostatic neural tissue: a promising imaging technique for improving nerve-sparing prostatectomy,” J. Endourol. 23(5), 861–867 (2009). 10.1089/end.2009.0221 [DOI] [PMC free article] [PubMed] [Google Scholar]
- 27.Parekh S. H., Lee Y. J., Aamer K. A., Cicerone M. T., “Label-free cellular imaging by broadband coherent anti-Stokes Raman scattering microscopy,” Biophys. J. 99(8), 2695–2704 (2010). 10.1016/j.bpj.2010.08.009 [DOI] [PMC free article] [PubMed] [Google Scholar]
- 28.Kirsch M., Schackert G., Salzer R., Krafft C., “Raman spectroscopic imaging for in vivo detection of cerebral brain metastases,” Anal. Bioanal. Chem. 398(4), 1707–1713 (2010). 10.1007/s00216-010-4116-7 [DOI] [PubMed] [Google Scholar]
- 29.Balu M., Liu G., Chen Z., Tromberg B. J., Potma E. O., “Fiber delivered probe for efficient CARS imaging of tissues,” Opt. Express 18(3), 2380–2388 (2010). 10.1364/OE.18.002380 [DOI] [PMC free article] [PubMed] [Google Scholar]
- 30.Légaré F., Evans C. L., Ganikhanov F., Xie X. S., “Towards CARS Endoscopy,” Opt. Express 14(10), 4427–4432 (2006). 10.1364/OE.14.004427 [DOI] [PubMed] [Google Scholar]
- 31.Van der Kwast T. H., Evans A., Lockwood G., Tkachuk D., Bostwick D. G., Epstein J. I., Humphrey P. A., Montironi R., Van Leenders G. J., Pihl C. G., Neetens I., Kujala P. M., Laurila M., Mazerolles C., Bubendorf L., Finelli A., Watson K., Srigley J., “Variability in diagnostic opinion among pathologists for single small atypical foci in prostate biopsies,” Am. J. Surg. Pathol. 34(2), 169–177 (2010). 10.1097/PAS.0b013e3181c7997b [DOI] [PubMed] [Google Scholar]


