

Abstract
Objective
To compare the strengths and limitations of cardiovascular risk scores available for clinicians in assessing the global (absolute) risk of cardiovascular disease.
Design
Review of cardiovascular risk scores.
Data sources
Medline (1966 to May 2009) using a mixture of MeSH terms and free text for the keywords ‘cardiovascular’, ‘risk prediction’ and ‘cohort studies’.
Eligibility criteria for selecting studies
A study was eligible if it fulfilled the following criteria: (1) it was a cohort study of adults in the general population with no prior history of cardiovascular disease and not restricted by a disease condition; (2) the primary objective was the development of a cardiovascular risk score/equation that predicted an individual's absolute cardiovascular risk in 5–10 years; (3) the score could be used by a clinician to calculate the risk for an individual patient.
Results
21 risk scores from 18 papers were identified from 3536 papers. Cohort size ranged from 4372 participants (SHS) to 1591209 records (QRISK2). More than half of the cardiovascular risk scores (11) were from studies with recruitment starting after 1980. Definitions and methods for measuring risk predictors and outcomes varied widely between scores. Fourteen cardiovascular risk scores reported data on prior treatment, but this was mainly limited to antihypertensive treatment. Only two studies reported prior use of lipid-lowering agents. None reported on prior use of platelet inhibitors or data on treatment drop-ins.
Conclusions
The use of risk-factor-modifying drugs—for example, statins—and disease-modifying medication—for example, platelet inhibitors—was not accounted for. In addition, none of the risk scores addressed the effect of treatment drop-ins—that is, treatment started during the study period. Ideally, a risk score should be derived from a population free from treatment. The lack of accounting for treatment effect and the wide variation in study characteristics, predictors and outcomes causes difficulties in the use of cardiovascular risk scores for clinical treatment decision.
Keywords: Risk stratification, coronary artery disease (cad), general practice
What is already known on this subject.
Guidelines advocate the use of cardiovascular risk scores to calculate global risk instead of focusing on single risk modification.
Healthcare providers in the UK are expected to select a cardiovascular risk score appropriate for their requirements from the many existing risk assessment tools with the recent change in the NICE guidelines.
What this study adds.
The existing risk scores vary widely in terms of study characteristics, predictors and outcomes.
These cohort studies have not taken into account the effect of treatment on the study population and will therefore underestimate cardiovascular risk.
Introduction
For many years, the Framingham cardiovascular risk equation has been the preferred method of cardiovascular risk assessment. However, in February 2010, the National Institute for Health and Clinical Excellence (NICE) announced that the Framingham equation should be considered as just one of several acceptable methods.1 The same guideline included a systematic review, which found 110 different cardiovascular risk-scoring methods. Clinicians are now able and expected to select, from these 110 cardiovascular risk scores, one that is appropriate for their patients. How should they decide which one is appropriate?
Despite guidelines advocating the use of cardiovascular risk scores to calculate global risk instead of focusing on single risk modification, adoption of cardiovascular risk scores has been slow.1 2 One survey in three countries showed that only 48% of physicians regularly use cardiovascular risk scores.3 In another survey in six European countries, 85% of respondents recognised the importance of global risk assessment; yet, the majority (62%) used a subjective assessment of cardiovascular risk rather than specific risk calculators in practice.4 Subjective risk assessment often disagrees with assessment by cardiovascular risk scores.3 5 Doctors who use cardiovascular risk scores can rate individual risk factors more accurately6 and are more likely to correctly prescribe treatment in given scenarios than non-users.3
Why don't doctors use cardiovascular risk scores in practice? Many physicians do not trust the validity of the risk scores7 and believe their own estimation to be more accurate.3 Another reason may simply be that there is too much choice. The Framingham risk equations were first published in 1976.8 Since then, many other cohort studies have developed their own equations such as PROCAM,9 SCORE10 and QRISK.11 These cohort studies differ significantly in terms of study population characteristics, risk predictors and outcomes.12
Cardiovascular risk scores measure baseline risk factors to predict future cardiovascular morbidity and mortality, but most do not account for changes in treatment during the years of follow-up. Failure to adjust for such treatment effects will cause cardiovascular risk scores to systematically underestimate predicted risk. This problem is greater for more recent studies with the progressive increase in the use of effective medication for blood pressure and lipids over the past 20–30 years.13 14
We aimed to review the strengths and limitations of current cardiovascular risk scores, to assess how these may impact on the classification of patients' risk of cardiovascular disease, and to identify the scores that may be most appropriate for use in clinical care.
Methods of review
Objectives
The objective of this review is to assess the strengths and limitations of cardiovascular risk scores available to clinicians for the assessment of global or absolute risk of cardiovascular disease. A particular focus was on how the risk scores dealt with the effects of treatment during follow-up.
Search methods for identification of studies
We searched Medline (1966 to May 2009) using a mixture of MeSH terms and free text for the keywords ‘cardiovascular’, ‘risk prediction’ and ‘cohort studies’. To identify other studies that answered our question, we also used our own literature files, previous reviews of cardiovascular scores, and citation tracking.
A study was eligible if it fulfilled the following criteria: (1) it was a cohort study of adults in the general population with no prior history of cardiovascular disease and not restricted by a disease condition; (2) the primary objective was the development of a cardiovascular risk score/equation that predicted an individual's absolute cardiovascular risk in 5–10 years; and (3) the score could be used by a clinician to calculate the risk for an individual patient.
Identifying studies
We screened the titles and abstracts of all retrieved records to identify exclusions. Full copies or reprints of records not excluded were then assessed to determine if they met with the inclusion criteria for the review. Any disagreements were resolved through discussion.
Data extraction
Two reviewers, LSM and JD, appraised and selected the studies, then extracted information from each study for analysis. Information extracted included study demographics, outcomes, predictors and treatment effect.
Analytical methods
Study methods were assessed using criteria adapted from Wasson et al15 and Royston et al,16 including sampling, predictors, follow-up, outcomes, data quality and performance of the rule.
Results
A total of 3536 papers were retrieved after removal of duplicates from records identified through the Medline search and other sources. Figure 1 shows the PRISMA flow diagram. The PRISMA statement and review protocol are available online as supplemental material.
Figure 1.

PRISMA flow diagram.
Description of studies
We identified 21 risk scores eligible for the review (table 1) from 18 papers. Five were from Framingham,8 17–19 three from the Munster group (PROCAM)9 20 and ARIC (Atherosclerosis Risk in Communities),21 22 two each from QRISK11 23 and Reynolds,24 25 and one each from the Scottish Heart Health Extended Cohort,26 Strong Heart Study,27 USA-PRC (People's Republic of China Collaborative Study of Cardiovascular Epidemiology)28 and NHEFS (National Health and Nutrition Examination Survey NHANES 1 Epidemiologic Follow-up Study).29 Some risk scores used multiple cohorts: SCORE10 was derived from a pool of 12 European cohorts, and Progetto CUORE30 from a pool of Italian cohorts. Twelve are from North America, eight are European, and one from China.
Table 1.
Description of the studies
| Study | Country | Population | Sample size | Age | % Female | Recruitment period |
| Framingham 1976 | USA | Population cohort | 5209 | 35–64 | 55 | 1948–1952 |
| Framingham 1991 | USA | Population cohort (original + offspring) | 5573 | 30–74 | 54 | 1968–1971; 1971–1975 |
| Framingham 1998 | USA | Population cohort (original + offspring) | 5345 | 30–74 | 53 | 1968–1971; 1971–1975 |
| Framingham 2008 | USA | Population cohort (original + offspring) | 8491 | 30–74 | 53 | 1968–1971; 1971–1975; 1984–1987 |
| PROCAM 2002 | Germany | Occupational cohort | 5389 | 35–65 | 0 | 1979–1985 |
| PROCAM 2007 | ||||||
| CHD | Germany | Occupational cohort | 26 975 | 20–75 | 32 | 1978–1995 |
| Stroke | Occupational cohort | 8130 | 35–65 | 27 | 1978–1995 | |
| SCORE 2003 | Europe | Pooled dataset of cohort studies | 205 178 | 45–64 | 43 | 1967–1991 |
| ARIC 2003 | USA | Population cohort | 14 054 | 45–64 | 57 | 1987–1989 |
| Progetto CUORE 2004 | Italy | Pooled dataset of cohort studies | 20 647 | 35–69 | 64 | 1983–1997 |
| Strong Heart Study 2006 | USA | Population cohort - American Indian | 4372 | 45–74 | 61 | 1989–1991 |
| USA-PRC 2006 | China | Population cohort | 9903 | 39–59 | 51 | 1983–1984 |
| ASSIGN 2007 | UK | Population cohort | 13 297 | 30–74 | 51 | 1984–1995 |
| Reynolds women 2007 | USA | Women's Health Study trial subjects | 16 400 | 45+ | 100 | 1992–1995 |
| Reynolds men 2008 | USA | Physician Health Study trial subjects | 10 724 | 50–80 | 0 | 1995–1997 |
| Personal Heart 2007 | USA | Population cohort | 14 343 | 45–64 | 57 | 1987–1989 |
| QRISK 2007 | UK | Electronic medical database | 1 283 174 | 35–74 | 50 | 1995–2007 |
| QRISK2 2008 | UK | Electronic medical database | 1 535 583 | 35–74 | 50 | 1993–2008 |
| NHEFS 2008 | USA | Population cohort | 6186 | 25–74 | 54 | 1971–1975 |
Figure 2 shows a timeline chart of the reviewed cohort studies and the introduction of several drugs.13 14
Figure 2.

Timeline of studies.
Analytical methods
Table 2 compares the analytical methods of the reviewed risk scores.
Table 2.
Analytical methods
| Study | Prospective | Predictors defined | Predictor selection | Follow-up loss | Missing values | Outcomes defined | Objective outcomes | Blinded assessment of outcomes | Model used | Results of rule |
| Framingham 1976 | Yes | EGC-LVH | NR | NR | Complete data - IC | Yes | Includes angina | NR | Logistic regression | NR |
| Framingham 1991 | Yes | EGC-LVH | Significance testing | NR | Complete data - IC | Yes | Includes angina | NR | Weibull model | c statistic |
| Framingham 1998 | Yes | Yes | Significance testing | NR | Complete data - IC | Yes | Includes angina | NR | Cox model | c statistic |
| Framingham 2008 | Yes | Yes | Significance testing | NR | Complete data - IC | Yes | Includes angina | Adjudication committee | Cox model | c statistic and calibration |
| PROCAM 2002 | Yes | Yes | Significance testing | Yes | NR | Yes | Yes | NR | Cox model | ROC + calibration |
| PROCAM 2007 | ||||||||||
| CHD | Yes | Yes | Significance testing | NR | NR | Yes | Yes | NR | Weibull model | ROC |
| Stroke | Yes | Yes | Significance testing | NR | NR | Yes | Yes | Yes | Cox model | ROC |
| SCORE 2003 | Pooled prospective cohorts | Pooled cohorts | A priori | NR | No HDL in some cohorts | Yes | Yes | Used diagnostic codes | Weibull model | ROC |
| ARIC 2003 | Yes | Yes | Significance testing | Yes | Complete data - IC | Yes | Includes revascularisation | NR | Cox model | ROC |
| Progetto CUORE 2004 | Pooled prospective cohorts | Yes | Significance testing | NR | NR | Yes | Includes revascularisation | Used diagnostic codes | Cox model | ROC |
| Strong Heart Study 2006 | Yes | Yes | Significance testing | Yes | Yes | Yes | Includes angina and revascularisation | NR | Cox model | ROC + calibration |
| USA-PRC 2006 | Yes | Yes | A priori | Yes | Complete data - IC | Yes | Yes | Adjudication committee | Cox model | ROC + calibration |
| ASSIGN 2007 | Yes | Yes | Significance testing | NR | NR | Yes | Includes angina and revascularisation | Used diagnostic codes | Cox model | ROC |
| Reynolds women 2007 | Yes | Trial data | Model testing - BIC | NR | NR | Yes | Includes revascularisation | NR | Cox model | ROC + calibration |
| Reynolds men 2008 | Yes | Trial data | Model testing - BIC | NR | Complete data - IC | Yes | Includes revascularisation | Adjudication committee | Not specified | ROC + calibration |
| Personal Heart 2007 | Yes | Self report | Significance testing | NR | NR | Yes | Includes revascularisation | NR | Cox model | c statistic |
| QRISK 2007 | No | Retrospective GP record | Model testing - BIC | NR | Significant missing data | Diagnosis from GP records or death certificate | Includes angina | Used diagnostic codes | Cox model | ROC + calibration |
| QRISK 2 2008 | No | Retrospective GP record | Model testing - BIC | NR | Significant missing data | Diagnosis from GP records or death certificate | Includes angina | Used diagnostic codes | Cox model | ROC + calibration |
| NHEFS 2008 | Yes | Yes | A priori | NR | Complete data - IC | Yes | Includes revascularisation | Used diagnostic codes | Cox model | ROC + calibration |
ECG-LVH, left ventricular hypertrophy on electrocardiogram; NR, not reported; IC, inclusion criteria; ROC, receiver operating characteristic; CHD, coronary heart disease; HDL, high density lipoprotein cholesterol; BIC, Bayes Information Criteria; GP, general practice.
The areas in which most of the risk equations did poorly were: (1) reporting loss to follow-up; (2) percentage of missing values; and (3) blind assessment of outcomes.
Risk predictors and their definitions
The final number of risk predictors ranged from five (PROCAM stroke) to 15 in QRISK 2 (table 3). Selection of predictors was mostly by significance testing (table 2). All scores included age, gender, blood pressure and smoking, and most included lipids and diabetes. Lipid levels were not used in the non-laboratory model of the 2008 Framingham risk score, the PROCAM 2007 risk equation for stroke, or the NHEFS risk score. Diabetes, glucose intolerance or HbA1c level was a predictor for all except the European SCORE. Other risk predictors included by some scores were left ventricular hypertrophy, antihypertensive medication use, body mass index, ethnicity, family history, socioeconomic status, medical diseases, biomarkers (hsCRP and albuminuria) and physical activity.
Table 3.
Predictors
|

Shaded areas, Predictors not included in risk score; SBP, systolic blood pressure; DBP, diastolic blood pressure; Sr. Chol, serum cholesterol; HDL, high density lipoprotein cholesterol; Tg, triglycerides; LVH, left ventricular hypertrophy; Antihpt med, antihypertensive medication; BMI, body mass index; Family hx, family history; SCE, socioeconomic; Rh arthritis, rheumatoid arthritis; Atrial fib, atrial fibrillation; No, number; M, male; F, female; Y, yes; N, no; TC, total cholesterol; RBS, random blood sugar; FBS, fasting blood sugar; LDL, low density lipoprotein cholesterol; Non-lab, non-laboratory; NA, not applicable; Cigs, cigarettes; SIMD, Scottish Index of Multiple Deprivation; HbA1c, haemoglobin A1c; hsCRP, high sensitivity c-reactive protein; GP, general practice.
Definitions for risk predictors differed from score to score. In the original Framingham cohort, diabetes was defined as a random blood glucose measurement ≥150 mg/dl (8.3 mmol/l) or treatment with insulin or oral hypoglycaemics. In the Framingham Offspring cohort, this definition was broadened to a fasting plasma glucose level ≥140 mg/dl (7.7 mmol/l) or treatment requirement.18 This in turn differs from the current definition used by the World Health Organization (WHO) of fasting plasma glucose ≥126 mg/dl (7.0 mmol/l).31 Hence, patients with fasting plasma glucose between 126 and 150 mg/dl (7–8.3 mmol/l) would be classed as non-diabetics by the first Framingham score. Systolic blood pressure measurement methods included averages taken from two readings (Framingham, Progetto CUORE, ASSIGN), average of last two of three readings (ARIC, SHS, NHEFS), average of three readings (USA-PRC) and second reading taken from two readings (PROCAM). For some scores, the measurement method was ill defined: self-report (Reynolds Study), general practitioner record (QRISK studies) or a previous diagnosis of hypertension (Personal HEART), to not being stated (SCORE).
Outcomes predicted
The outcomes predicted differ widely between the risk scores (table 4), ranging from general cardiovascular risk to specific disease outcomes. Almost all scores predict myocardial infarction and death from coronary heart disease. Only 12 of the 21 scores included cerebrovascular events. SCORE only predicts fatal cardiovascular events.
Table 4.
Outcomes
|
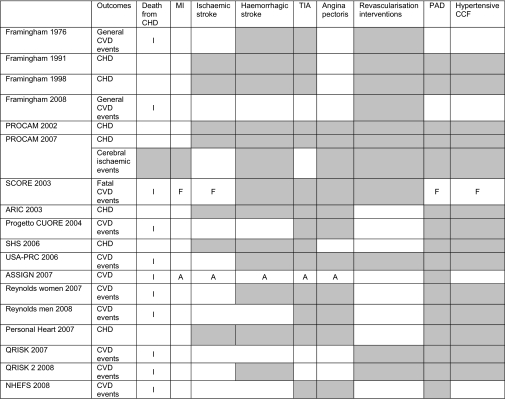
Shaded areas, outcomes not included in risk score; I, includes other fatal CVD; F, only if fatal; A, only if admitted; CHD, coronary heart disease; MI, myocardial infarct; TIA, transient ischaemic attack; PAD, peripheral artery disease; CCF, congestive cardiac failure; CVD, cardiovascular disease.
Methods to assess outcome events also differed. The SCORE and ASSIGN scores used hard outcomes with diagnostic codes such as ICD 9/10 codes. ‘Hard outcomes’ can be defined as irrevocable events32 that have permanent consequences, such as myocardial infarction and death, as opposed to ‘soft events’, such as hospitalisation for angina. The Framingham studies included a broader composite of hard and soft end points. Diagnostic criteria for outcomes in Progetto CUORE and the USA-PRC cohorts followed the WHO-MONICA Study (WHO–MONItoring trends and determinants in CArdiovascular disease project).28 30 Expert panels reviewed medical records and hospital notes in the Framingham studies, PROCAM scores, ARIC, SHS, Reynolds studies and the NHEFS. QRISK1 and 2 used general practice electronic recorded diagnosis or death certificates linked to the computer system.
Adjustment for treatment effects
Methods used to adjust for the effect of medication were absent or weak (table 5). The effect of treatment is not fully assessed or adjusted for by any of the reviewed risk scores. Treatment effect includes (1) that which occurs by risk factor modification (eg, blood pressure-lowering medication), (2) that which works independently of risk factors (eg, platelet inhibitors such as aspirin), and (3) that which works by both means (eg, statins). Twelve of the cardiovascular risk score studies (Framingham 1998, Framingham 2008, ARIC, Progetto CUORE, SHS, USA-PRC, Reynolds 2007, Reynolds 2008, Personal Heart, QRISK1, QRISK2, and NHEFS) reported data on prior treatment, but this was mainly limited to antihypertensive treatment. Only seven (Framingham 2008, ARIC, Progetto CUORE, SHS, QRISK1, QRISK2 and NHEFS) included the use of antihypertensive drugs as a risk predictor. The Reynolds studies were the only ones to report prior use of lipid-lowering agents. None of the studies reported on the prior use of platelet inhibitors.
Table 5.
Treatment effect
|

Shaded areas, information not reported; Antihpt, antihypertensive medication; SBP, systolic blood pressure; pred, predictors.
*Corrected for change in risk factors by factoring in changes at midpoint of follow-up—that is, 1993/1994.
Two treatment effects need to be considered: (1) prior treatment (started before enrolment in the study) and (2) subsequent treatment started during study follow-up (treatment drop-ins). None of the risk scores addressed the effect of treatment drop-ins. For early studies, such as the older Framingham Study, this may be minimal. Recent cohorts such as QRISK may have had more than half of their study population receiving treatment with their blood pressure under control (see NHANES data33–37 in figure 2).
Discussion
For users of cardiovascular risk scores, this review has two main findings: that cardiovascular risk scores differ considerably in terms of population, predictors and outcomes, which may not match those used by clinicians, and that treatment ‘drop-in’ is poorly accounted for by most rules.
Whichever risk equation they choose, clinicians should know which outcomes are predicted. As the outcomes predicted differ significantly, the risk scores are not interchangeable. For example, the Framingham risk scores predict a broad range of cardiovascular events (including cerebrovascular events), whereas SCORE only predicts fatal cardiovascular events. The Framingham Study risk scores have been criticised for the inclusion of ‘soft’ (subjective) outcomes such as angina,10 although the Framingham investigators argue that such outcomes estimate the total cardiovascular disease burden19 and are clinically important to both patient and doctor. Revascularisation interventions may also be criticised as being subjective.
Time is a major obstacle to the use of risk scores by physicians4; obtaining more information from a patient will further decrease the use of risk calculators. Of the risk scores, QRISK2 had the most predictors, which included disease conditions such as atrial fibrillation and chronic renal disease. QRISK2 score is designed to use data in the patient's electronic health record, with imputed values for missing data. However, the proportion with missing data for these factors in the derivation cohorts was substantial (>70% for ethnicity; >60% for cholesterol).23
The second limitation is that the effect of treatment has not been considered fully by any of the reviewed risk scores. Treatment decreases the true effect of risk factors on outcomes,38 39 as illustrated by figure 3. The combined effects of risk reduction due to treatment can be as much as 50%.40 If 25% of the population started treatment during follow-up, it would mean a population risk reduction of 12.5%. But this would be greater in the high-risk groups, who are more likely to be treated. These differences are similar to those found between QRISK 2 and Framingham (11.6%), which was obtained in a recent validation study of QRISK 2.41
Figure 3.

True effect of risk factor on outcome.
Ideally, a cardiovascular risk score to determine the risk of a cardiovascular event and to stratify patients for risk factor modification should be derived in a population receiving no treatment at the start of and during the study. Such an ideal study is not tenable or ethical. We know of three possible solutions. First, we could favour the use of older studies, when less aggressive treatment occurred. Second, treatment uptake could be monitored and appropriate adjustments such as the application of a penalised Cox model made to account for the effect of treatment.42 Until such studies have been performed, study cohorts where there is minimal treatment drop-in during follow-up should be preferred. Alternatively, to minimise treatment drop-in, we could study cohorts with much larger numbers over much shorter periods (Rod Jackson, personal communication).
We have not addressed how risk scores may change over time. However, a common misconception is that the strength of the risk scores change with population health status. Changes in the prevalence of a risk factor should not change the underlying relationship of a risk predictor to a disease outcome. For example, lower rates of smoking will not change the RR reduction due to smoking. Study participants may have changed their risk behaviour—for example, stopped smoking during the study. However, that is another treatment effect and should ideally be measured.
The lack of accounting for treatment makes the use of most cardiovascular risk scores for treatment decisions problematic. We need to examine how doctors use cardiovascular risk scores in clinical practice. If the aim is to discuss with patients the risk of remaining untreated, then the use of the majority of these risk scores would be incorrect.
Strengths and weaknesses of the study
The review was limited to studies in which participants had no previous history of cardiovascular disease and excluded those who were restricted to a disease condition. A prior diagnosis of cardiovascular disease or a disease such as diabetes raises the patient into the high-risk category, removing the need for risk scoring. This has also been advocated by the NICE guidelines, which states that risk equations should not be used for those with a previous history of cardiovascular disease or other high-risk diseases such as diabetes.1 Furthermore, the majority of these patients would have received treatment, potentially altering study outcomes.
This is a detailed review with a clear and focused question and explicit methodology. The review is particularly relevant to the recent modification of the NICE guidelines and offers the most up-to-date comparison of available cardiovascular risk scores. It has also identified a major gap in risk assessment studies, namely, the effect of treatment.
Strengths and weaknesses in relation to other studies, discussing particularly any differences in results
The 2005 review by Beswick et al43 included in the appendix of the NICE guidelines identified 110 studies, with 70 meant specifically for application in primary prevention. The difference in the number of studies identified is due to their wider inclusion criteria, which included studies restricted to a disease condition, studies that had participants with prior cardiovascular disease, studies that were recalibrations or modifications of the original cohort study, studies that did not use absolute risk scoring, and studies where the duration of prediction was not specified. More recent studies such as QRISK and Reynolds scores are not included, as their search concluded in April 2005.
Meaning of the study: possible mechanisms and implications for clinicians or policymakers
The recent change in the NICE guidelines has major implications for clinical practice. Selecting an appropriate risk score is likely to be difficult because of the wide variation in available risk scores. This review has attempted to address the problem by comparing features of all the cardiovascular risk scores.
Unanswered questions and future research
This review did not address the effectiveness or accuracy of the cardiovascular risk scores, which would require a review of validation studies instead of the original cohort studies. The reviews by Beswick et al and Brindle et al44 have tried to assess this, but do not include the more recent studies. However, it should be pointed out that any validation study of risk scores might also suffer the same problem of treatment drop-in, which would attenuate the true cardiovascular risk. Researchers should also attempt to address the effect of treatment in future studies in this field by collecting data on treatment at the start and during the course of cohort studies, as this will impact on the final outcomes.
Authors' conclusions
Implications
These results show that there are substantial differences in the available cardiovascular risk scores in terms of study characteristics, predictors and outcomes. The effect of treatment on the study population has not been taken into account by these cohort studies. Further study is required for the translation of such research into clinical practice.
Footnotes
Funding: This study was funded in part by the NHMRC Project Grant 511217 and Prof Glasziou's NIHR Fellowship.
Competing interests: None.
Contributors: SM, JD and PG are responsible for the study concept and design. SM and JD extracted data. SM and PG undertook analysis and interpretation of the data. SM drafted the manuscript, and JD and PG undertook critical revisions of the manuscript. All three authors read and approved the final manuscript and as such act as guarantors for the study.
Provenance and peer review: Not commissioned; internally peer reviewed.
References
- 1.Cooper A, Nherera L, Calvert N, et al. Clinical Guidelines and Evidence Review for Lipid Modification: cardiovascular risk assessment and the primary and secondary prevention of cardiovascular disease. London, National Collaborating Centre for Primary Care and Royal College of General Practitioners, 2008 [Google Scholar]
- 2.British Cardiac Society, British Hypertension Society, Diabetes UK, HEART UK, Primary Care Cardiovascular Society, Stroke Association JBS 2: Joint British Societies' guidelines on prevention of cardiovascular disease in clinical practice. Heart 2005;91(Suppl 5):v1–52 [DOI] [PMC free article] [PubMed] [Google Scholar]
- 3.Sposito AC, Ramires JAF, Jukema JW, et al. Physicians' attitudes and adherence to use of risk scores for primary prevention of cardiovascular disease: cross-sectional survey in three world regions. Curr Med Res Opin 2009;25:1171–8 [DOI] [PubMed] [Google Scholar]
- 4.Graham IM, Stewart M, Hertog MG. Cardiovascular Round Table Task Force. Factors impeding the implementation of cardiovascular prevention guidelines: findings from a survey conducted by the European Society of Cardiology. Eur J Cardiovasc Prev Rehabil 2006;13:839–45 [DOI] [PubMed] [Google Scholar]
- 5.Montgomery AA, Fahey T, MacKintosh C, et al. Estimation of cardiovascular risk in hypertensive patients in primary care. Br J Gen Pract 2000;50:127–8 [PMC free article] [PubMed] [Google Scholar]
- 6.Imms A, Quinn S, Nelson M. General practitioners' use of cardiovascular risk calculators. Aust Fam Physician 2010;39:57. [PubMed] [Google Scholar]
- 7.Eichler K, Zoller M, Tschudi P, et al. Barriers to apply cardiovascular prediction rules in primary care: a postal survey. BMC Fam Pract 2007;8:1. [DOI] [PMC free article] [PubMed] [Google Scholar]
- 8.Kannel WB, McGee D, Gordon T. A general cardiovascular risk profile: the Framingham Study. Am J Cardiol 1976;38:46–51 [DOI] [PubMed] [Google Scholar]
- 9.Assmann G, Cullen P, Schulte H. Simple scoring scheme for calculating the risk of acute coronary events based on the 10-year follow-up of the prospective cardiovascular Munster (PROCAM) study. Circulation 2002;105:310–15 [DOI] [PubMed] [Google Scholar]
- 10.Conroy RM, Pyorala K, Fitzgerald AP, et al. Estimation of ten-year risk of fatal cardiovascular disease in Europe: the SCORE project. Eur Heart J 2003;24:987–1003 [DOI] [PubMed] [Google Scholar]
- 11.Hippisley-Cox J, Coupland C, Vinogradova Y, et al. Derivation and validation of QRISK, a new cardiovascular disease risk score for the United Kingdom: prospective open cohort study. BMJ 2007;335:136. [DOI] [PMC free article] [PubMed] [Google Scholar]
- 12.Ferket BS, Colkesen EB, Visser JJ, et al. Systematic review of guidelines on cardiovascular risk assessment: which recommendations should clinicians follow for a cardiovascular health check? Arch Intern Med 2010;170:27–40 [DOI] [PubMed] [Google Scholar]
- 13.Piepho RW, Beal J. An overview of antihypertensive therapy in the 20th century. J Clin Pharmacol 2000;40:967–77 [DOI] [PubMed] [Google Scholar]
- 14.Endo A. The discovery and development of HMG-CoA reductase inhibitors. J Lipid Res 1992;33:1569–82 [PubMed] [Google Scholar]
- 15.Wasson JH, Sox HC, Neff RK, et al. Clinical prediction rules. applications and methodological standards. N Engl J Med 1985;313:793–9 [DOI] [PubMed] [Google Scholar]
- 16.Royston P, Moons KG, Altman DG, et al. Prognosis and prognostic research: Developing a prognostic model. BMJ 2009;338:b604. [DOI] [PubMed] [Google Scholar]
- 17.Anderson KM, Wilson PW, Odell PM, et al. An updated coronary risk profile. A statement for health professionals. Circulation 1991;83:356–62 [DOI] [PubMed] [Google Scholar]
- 18.Wilson PW, D'Agostino RB, Levy D, et al. Prediction of coronary heart disease using risk factor categories. Circulation 1998;97:1837–47 [DOI] [PubMed] [Google Scholar]
- 19.D'Agostino RB, Sr, Vasan RS, Pencina MJ, et al. General cardiovascular risk profile for use in primary care: the Framingham Heart Study. Circulation 2008;117:743–53 [DOI] [PubMed] [Google Scholar]
- 20.Assmann G, Schulte H, Cullen P, et al. Assessing risk of myocardial infarction and stroke: new data from the Prospective Cardiovascular Munster (PROCAM) study. Eur J Clin Invest 2007;37:925–32 [DOI] [PubMed] [Google Scholar]
- 21.Chambless LE, Folsom AR, Sharrett AR, et al. Coronary heart disease risk prediction in the Atherosclerosis Risk in Communities (ARIC) study. J Clin Epidemiol 2003;56:880–90 [DOI] [PubMed] [Google Scholar]
- 22.Mainous AG, 3rd, Koopman RJ, Diaz VA, et al. A coronary heart disease risk score based on patient-reported information. Am J Cardiol. 2007;99:1236–41 [DOI] [PMC free article] [PubMed] [Google Scholar]
- 23.Hippisley-Cox J, Coupland C, Vinogradova Y, et al. Predicting cardiovascular risk in England and Wales: prospective derivation and validation of QRISK2. BMJ 2008;336:1475–82 [DOI] [PMC free article] [PubMed] [Google Scholar]
- 24.Ridker PM, Buring JE, Rifai N, et al. Development and validation of improved algorithms for the assessment of global cardiovascular risk in women: the Reynolds Risk Score. JAMA 2007;297:611–19 [DOI] [PubMed] [Google Scholar]
- 25.Ridker PM, Paynter NP, Rifai N, et al. C-reactive protein and parental history improve global cardiovascular risk prediction: the Reynolds Risk Score for men. Circulation 2008;118:2243–51, 4p following 2251. [DOI] [PMC free article] [PubMed] [Google Scholar]
- 26.Woodward M, Brindle P, Tunstall-Pedoe H; SIGN group on risk estimation Adding social deprivation and family history to cardiovascular risk assessment: the ASSIGN score from the Scottish Heart Health Extended Cohort (SHHEC). Heart 2007;93:172–6 [DOI] [PMC free article] [PubMed] [Google Scholar]
- 27.Lee ET, Howard BV, Wang W, et al. Prediction of coronary heart disease in a population with high prevalence of diabetes and albuminuria: the Strong Heart Study. Circulation 2006;113:2897–905 [DOI] [PubMed] [Google Scholar]
- 28.Wu Y, Liu X, Li X, et al. Estimation of 10-Year Risk of Fatal and Nonfatal Ischemic Cardiovascular Diseases in Chinese Adults. Circulation 2006;114:2217–25 [DOI] [PubMed] [Google Scholar]
- 29.Gaziano TA, Young CR, Fitzmaurice G, et al. Laboratory-based versus non-laboratory-based method for assessment of cardiovascular disease risk: the NHANES I Follow-up Study cohort. Lancet 2008;371:923–31 [DOI] [PMC free article] [PubMed] [Google Scholar]
- 30.Palmieri L, Panico S, Vanuzzo D, et al. Evaluation of the global cardiovascular absolute risk: the Progetto CUORE individual score. Ann Ist Super Sanita 2004;40:393–9 [PubMed] [Google Scholar]
- 31.2006 World Health organization - International Diabetes Federation Definition and Diagnosis of Diabetes Mellitus and Intermediate Hyperglycemia: Report of a WHO/IDF Consultation. Switzerland: WHO Press, World Health Organization, 2006 [Google Scholar]
- 32.Nissen SE. Cardiovascular outcomes in randomized trials: should time to first event for “hard” end points remain the standard approach? J Am Coll Cardiol 2009;54:2363–5 [DOI] [PubMed] [Google Scholar]
- 33.Burt VL, Cutler JA, Higgins M, et al. Trends in the prevalence, awareness, treatment, and control of hypertension in the adult US population. Data from the health examination surveys, 1960 to 1991. Hypertension 1995;26:60–9 [DOI] [PubMed] [Google Scholar]
- 34.Hajjar I, Kotchen TA. Trends in prevalence, awareness, treatment, and control of hypertension in the United States, 1988–2000. JAMA 2003;290:199–206 [DOI] [PubMed] [Google Scholar]
- 35.Ong KL, Cheung BM, Man YB, et al. Prevalence, awareness, treatment, and control of hypertension among United States adults 1999–2004. Hypertension 2007;49:69–75 [DOI] [PubMed] [Google Scholar]
- 36.Ostchega Y, Yoon SS, Hughes J, et al. Hypertension awareness, treatment, and control–continued disparities in adults: United States, 2005–2006. NCHS Data Brief 2008;(3):1–8 [PubMed] [Google Scholar]
- 37.Egan BM, Zhao Y, Axon RN. US trends in prevalence, awareness, treatment, and control of hypertension, 1988–2008. JAMA 2010;303:2043–50 [DOI] [PubMed] [Google Scholar]
- 38.Wilson PW, Anderson KM, Castelli WP. Twelve-year incidence of coronary heart disease in middle-aged adults during the era of hypertensive therapy: the Framingham offspring study. Am J Med 1991;90:11–16 [DOI] [PubMed] [Google Scholar]
- 39.Brown BG, Zhao X. Nicotinic acid, alone and in combinations, for reduction of cardiovascular risk. Am J Cardiol 2008;101:58B–62 [DOI] [PubMed] [Google Scholar]
- 40.Messerli FH, Bakris GL, Ferrera RD, et al. on behalf of the AVALON Investigators Efficacy and safety of coadministered amlodipine and atorvastatin in patients with hypertension and dyslipidemia: results of the AVALON trial. J Clin Hypertens(Greenwich) 2006;8:571–83 [DOI] [PMC free article] [PubMed] [Google Scholar]
- 41.Collins GS, Altman DG. An independent and external validation of QRISK2 cardiovascular disease risk score: a prospective open cohort study. BMJ 2010;340:c2442. [DOI] [PMC free article] [PubMed] [Google Scholar]
- 42.Simes J, Voysey M, O'Connell R, et al. FIELD Study Investigators. A novel method to adjust efficacy estimates for uptake of other active treatments in long-term clinical trials. PLoS One 2010;5:e8580. [DOI] [PMC free article] [PubMed] [Google Scholar]
- 43.Beswick AD, Brindle P, Fahey T, et al. A systematic review of risk scoring methods and clinical decision aids used in the primary prevention of coronary heart disease. Appendix K. Clinical Guidelines and Evidence Review for Lipid Modification. Cardiovascular Risk Assessment and the Primary and Secondary Prevention of Cardiovascular Disease, 2007; CG67. London: National Collaborating Centre for Primary Care and Royal College of General Practitioners; http://www.nice.org.uk/nicemedia/live/11982/40758/40758.pdf (accessed 16 Mar 2011). [Google Scholar]
- 44.Brindle P, Beswick A, Fahey T, et al. Accuracy and impact of risk assessment in the primary prevention of cardiovascular disease: a systematic review. Heart 2006;92:1752–9 [DOI] [PMC free article] [PubMed] [Google Scholar]