Abstract
Identifying neuronal morphology is a key component in understanding neuronal function. Several techniques have been developed to address this issue, including Golgi staining, electroporation of fluorescent dyes, and transfection of fluorescent constructs. Ballistic delivery of transgenic constructs has been a successful means of rapidly transfecting a non-biased population of cells within tissue or culture. Recently, this technique was modified for the ballistic delivery of dye coated gold or tungsten particles, enabling a non-biased, rapid fluorescent membrane labeling of individual neurons in both fixed and non-fixed tissue. This unit outlines a step-by-step protocol for the ballistic method of dye delivery (“DiOlistic labeling) to fixed tissue, including optimal tissue fixation conditions. In addition, a protocol for coupling “DiOlistic” labeling with other immunofluorescent methods is detailed, enabling the association of neuronal morphology with a specific cellular phenotype.
Keywords: DiOlistic, Gene Gun, dendritic spine, neuronal morphology
INTRODUCTION
Morphological reconstruction of individual neurons has been at the heart of developing structure-function relationships within the nervous system. Detailed analyses of dendritic arbors and their associated spines provide a basis for inferences of connectivity and local circuitry (e.g., Hollingworth and Berry, 1975; Purves and Hume, 1981; Coss and Perkel, 1985), as well as plasticity in information processing (Kasai et al., 2010) in both experimental studies and mathematical approaches to modeling neuronal processes (Chklovskii, 2004). For over a century, the methodological basis for these studies has been Golgi staining (Fairen, 2005), which has been invaluable in developing our modern understanding of the nervous system but has several drawbacks. Despite the decades of studies using Golgi techniques, a lingering mystery, which even today is only partially understood (Spacek, 1989), is why incubating brains or tissue sections in a homogeneous solution stains only a small percentage of neurons. Although, this low frequency of staining represents the value of the Golgi method, the uncertainty of why particular neurons are stained provides a nagging insecurity of a selection bias with this procedure. Finally, compatibility of the Golgi reaction product lends itself nicely to electron microscopic analyses (Fairen, 2005), but generally interferes with other labeling techniques, leaving the phenotype of the Golgi-impregnated cell often unknown.
In recent decades, a variety of methods have been developed to circumvent some of the limitations of Golgi staining, most notably electroporation of Lucifer Yellow or biotin analogs, and transgenic neuronal expression of fluorescent proteins (Buhl and Lubke, 1989; Spergel et al., 2001). These methods offer the ability to select neurons of interest (either identified neurons or through unbiased selection). Further, these are versatile methods that can be effectively combined with other staining techniques. Still, key limitations of these modern staining approaches exist including: a) the cells of interest must be accessible for electroporation, and b) a transgenic animal of species of interest is available or can be made (e.g., transgenic expression of fluorescent proteins).
An emerging approach to morphological identification of neurons is termed “DiOlistic labeling” (Gan et al., 2000). With this method, microparticles coated with a lipophilic dye (e.g., DiI) are ballisitcally applied to tissue sections or cultured neurons. If a dye coated particle is embedded in a neuron, the dye is incorporated into the membrane where the diffusion of the dye produces fluorescent Golgi-like labeling. Advantages of this labeling method are that it is compatible with a variety of tissues, reliable and offers high-throughput neuronal analysis. In this unit, we describe protocols for the use of DiOlistic labeling in tissue sections. A similar unit has been published previously in this series emphasizing in situ labeling of cultured tissue (see UNIT 2.11). Our focus is on critical methodological components of DiOlistic labeling of cells in fixed slices, as well as protocols for combining this method with other staining protocols, e.g., immunolabeling of individual neurons (Alternate protocol 1). Further, we offer a protocol for quantitative analysis of dendritic spine morphologies (Alternate protocol 2).
BASIC PROTOCOL 1
BULLET PREPARATION
Ballistic labeling utilizes high pressure to expel DiI coated tungsten particles aimed at a tissue section. The gene gun holds individual lengths of tubing (termed ‘bullets’) that have been coated with the DiI-tungsten particles. This protocol provides the steps to create the DiI bullets used to load the Gene Gun.
Materials
Nitrogen gas/regulator
Scale
Weigh paper
Micro-centrifuge tubes
Single edge razor blade
25 ml syringe
Tygon laboratory tubing (R-3603) (Saint-Gobain Performance Plastics, Akron, OH)
Carbocyanine fluorescent DiI or CM-DiI (Molecular Probes, Carlsbad, CA)
Methylene chloride
1.3 µm tungsten particles (BioRad, Hercules, CA)
Helios Gene Gun (BioRad)
Polyvinylpyrrolidon (PVP - 10 mg/ml; Sigma-Aldrich, St. Louis, MO) dissolved in deionized water
Tefzel tubing (BioRad)
Bath sonicator
Vortex
Desiccant
Pre-coat Tefzel tubing (approx 2–3 feet) with 10 mg/ml PVP and dry under 0.4 LPM nitrogen gas flow to increase the adhesion of the tungsten to the Tefzel tubing.
- Dissolve 2 mg carbocyanine fluorescent DiI in 75 µl methylene chloride.
- Methylene chloride is highly toxic and should be used only in a ventilated hood space. IMPORTANT NOTE: If performing protocol with the immunofluorescence option, bullets should be made with CM-DiI.
- Spread 90 µg of 1.3 µm tungsten particles onto a glass slide. Using a single edge razor blade “cut” and spread the tungsten particles evenly across the glass slide until the tungsten particles appear to be a fine powder.
- One batch will coat 2–3 feet of Tefzel tubing.
Apply the DiI/methylene chloride mixture in 10–15 µl aliquots to 90 µg of 1.3 µm tungsten particles that have been spread evenly on the glass slide (see step 3), ensuring the DiI is applied evenly across the tungsten particles.
Wait for the methylene chloride to evaporate, allowing the DiI to adhere to the tungsten particles. Using a single edge razor blade, scrape the DiI coated tungsten particles from the slide. “Cut” and spread the Dil/tungsten particles evenly across the glass slide until the Dil/tungsten particles appear to be a fine powder.
Carefully add all of the DiI coated tungsten particles to 10 ml of 10 mg/ml PVP in order to bring the tungsten particles into solution.
Sonicate the DiI/PVP solution for 10 min with intermittent vortexing.
Attach one end of the tubing to the 25 ml syringe and attach the other end to the PVP coated Tefzel tubing. (Figure 2.13.1).
Using the syringe plunger, quickly draw the DiI/PVP slurry into the Tefzel tubing – enough to fill the length of the tubing. Allow particles to settle for 3 minutes.
Slowly withdraw the PVP solution from the tubing making certain not to disturb the DiI coated tungsten particles.
Slowly rotate the Tefzel tubing 360° to evenly coat the inside with the DiI coated tungsten particles.
Dry the DiI coated tubing for 20 minutes under 0.4 LPM nitrogen gas flow.
Cut the tubing into 1.3 mm segments (bullets) and store at 4° C with desiccant in the dark until use (up to 1 month) (Figure 2.13.2).
Figure 2.13.1.
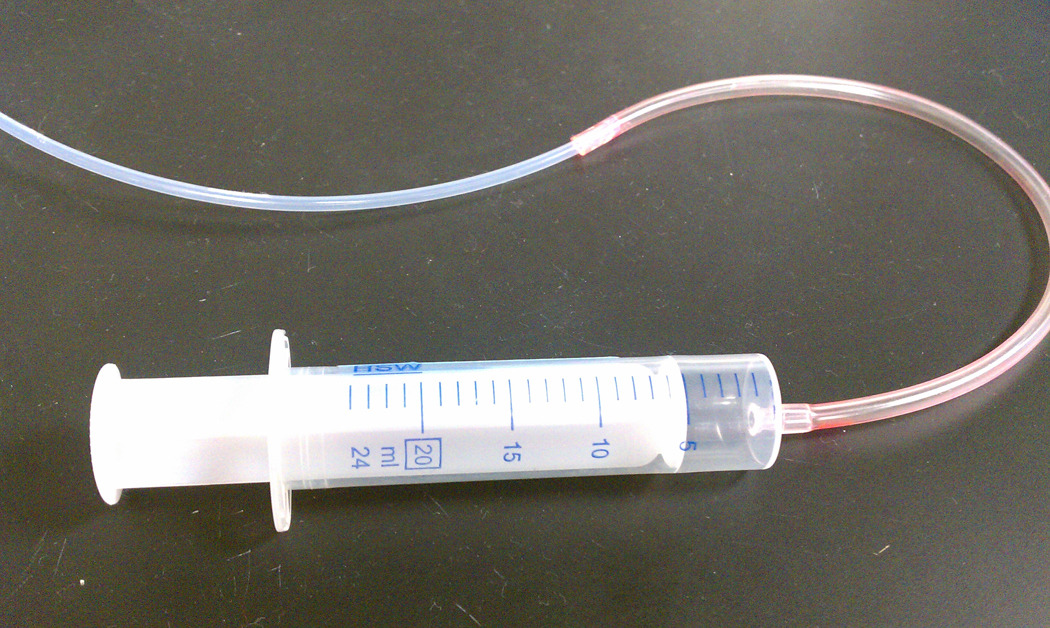
Pictorial view of the syringe set up to draw the DiI/PVP slurry into the Tefzel tubing.
Figure 2.13.2.
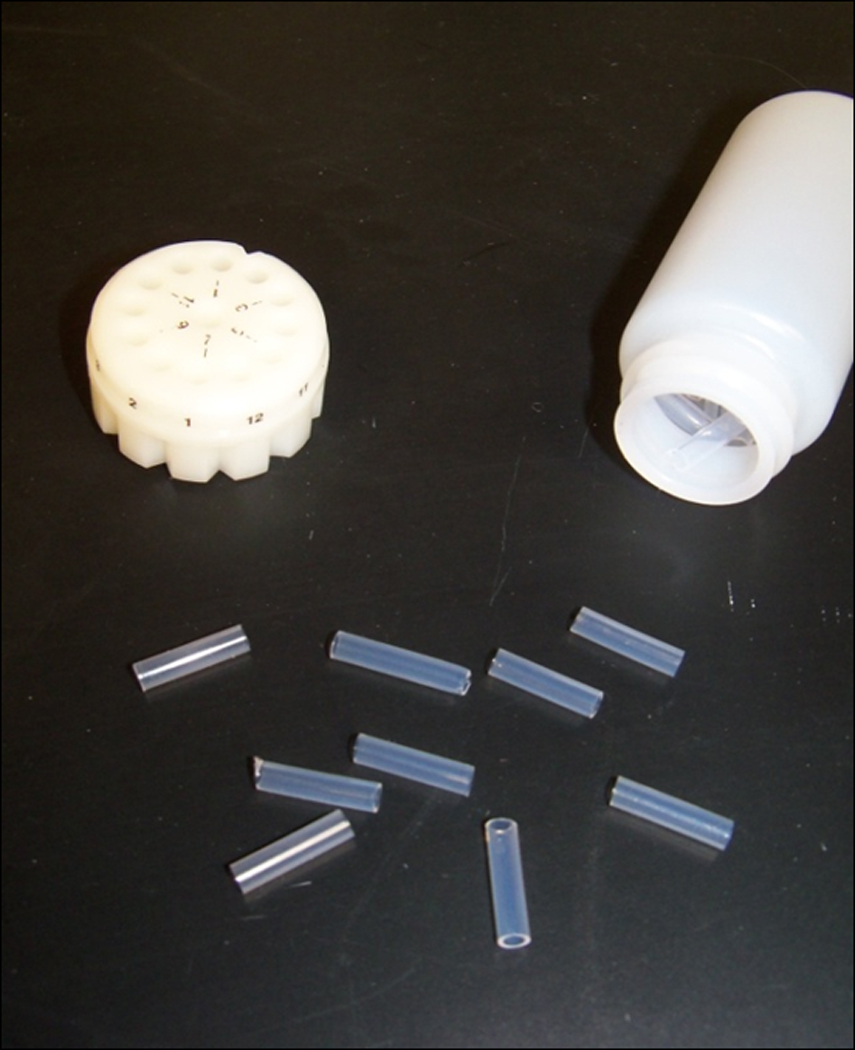
Gene Gun ‘bullets’ with cartridge.
BASIC PROTOCOL 2
TISSUE PREPARATION
Fixation is a critical step for labeling efficiency with DiI. With too little fixation, the dye may leak out of the membranes. Too much fixation will restrict diffusion through the neuronal membrane. Perfusion times certainly vary among laboratories; however, a perfusion protocol that provides a good starting point is outlined below. Please note that within this protocol, perfusion and fixation utilize a lower aldehyde concentration of 1.5% paraformaldehyde. This lower aldehyde concentration yields consistently enhanced cellular label of neurons within the tissue slice.
Materials
Anesthesia – specific to animal (requires animal protocol from specific Institute)
26 gauge Needle and syringe
Surgical scissors
Phosphate buffered saline (PBS, 25 mM, pH=7.2) (see recipe)
1.5% Paraformaldehyde in PBS (w/v) (see recipe)
4% Paraformaldehyde in PBS (w/v) (see recipe)
Perfusion pump
Brain Matrix (available from several suppliers sized for either rat or mouse brains)
Single straight edge blade
Mounting block
Cyanoacrylate glue
Paint brush
Vibratome
Vibratome blades
35-mm Tissue culture dishes
NOTE: All protocols using live animals must first be reviewed and approved by an Institutional Animal Care and Use Committee (IACUC) and must follow officially approved procedures for the care and use of laboratory animals.
Anesthetize animal.
Transcardially perfuse with 25 mM PBS (pH=7.2) for 3 minutes at 25 ml/min followed by 1.5% paraformaldehyde in 25 mM PBS for 20 minutes.
Remove brain from skull and post-fix for 1 hour in 1.5% paraformaldehyde in PBS.
Using an appropriately sized brain matrix, use the single edge razor to cut a flat surface for mounting on the vibratome mounting block. The cut should be made in an appropriate anatomical orientation (e.g., coronal) and level of the brain depending on the structure of interest.
Glue the flat/cut surface of the brain onto the mounting block. Allow it to dry for a few minutes.
While glue is drying, fill (2 ml) of each well of the 35-mm culture dish with PBS.
Place mounting block onto the vibratome stage and secure it. Lower the stage completely.
Fill the vibratome chamber with 25 mM PBS (volume will vary depending on vibratome model) (Figure 2.13.3).
Begin to raise vibratome stage in 300 µm increments until the desired region of the brain is reached.
- Vibratome section the brain into 150 – 300 µm serial sections throughout the region of interest.
- If you plan on coupling DiI labeling with immunofluorescence, slice sections should be 150 µm in thickness.
- Using the paint brush, remove sliced tissues from the PBS vibratome bath and place the tissue slices into 35-mm tissue culture dishes containing PBS – one slice per well – until they are ready for DiI labeling.
- Tissue may be stored at 4° C for up to one week prior to labeling without any negative impact on tissue labeling (Forlano and Woolley, 2010) (Figure 2.13.4).
Figure 2.13.3.
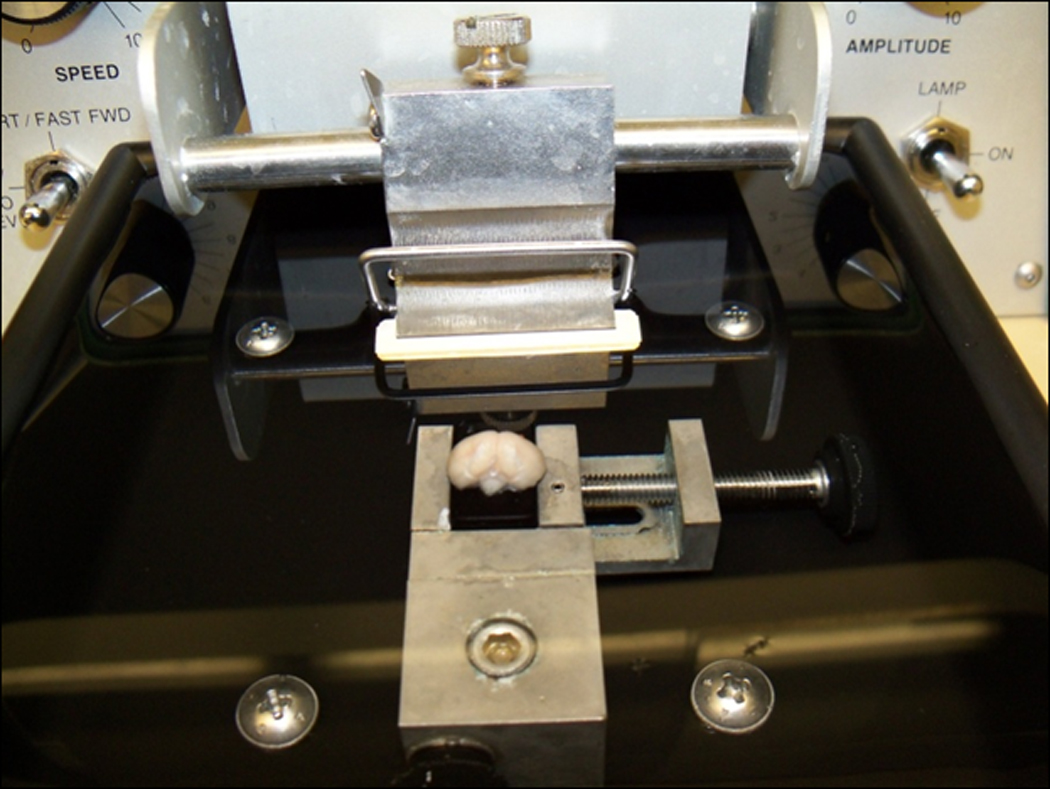
Vibratome set up. Flat edge of brain glued with cyanoacrylic to the mounting block. The mounting block is secured on the vibratome stage and the stage is lowered completely.
Figure 2.13.4.
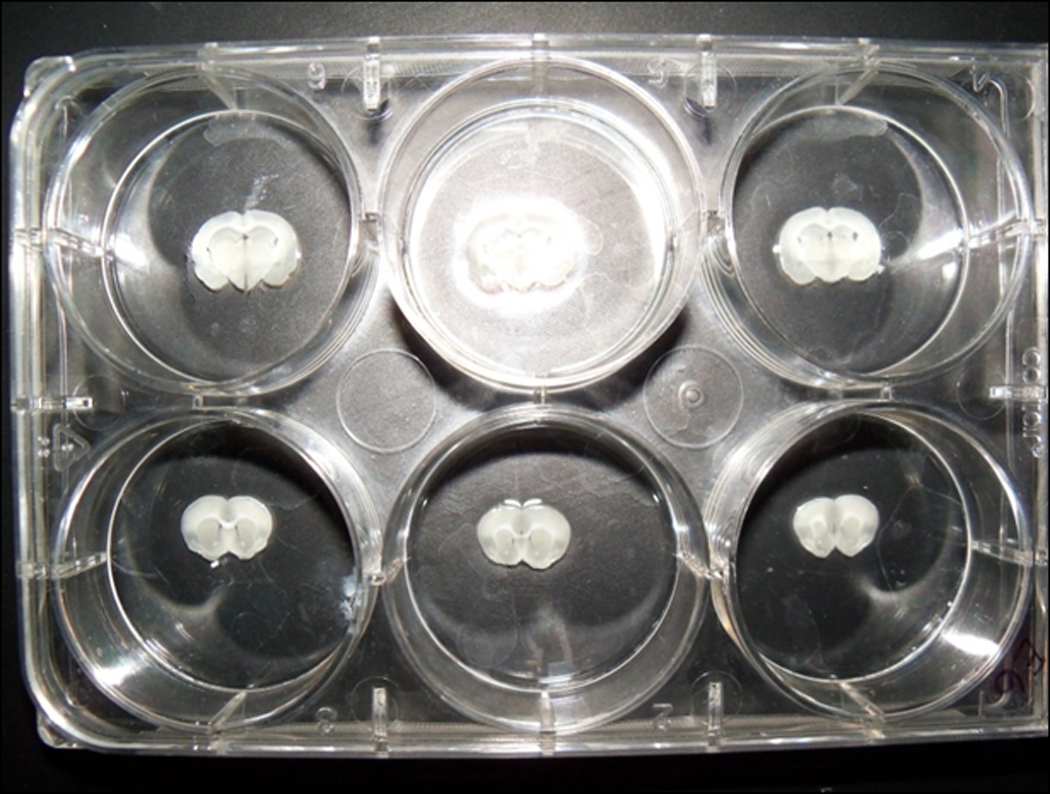
One tissue slice is placed into each of the 35-mm wells of the culture dish. At the time the tissue is placed into the well, the well already contains approximately 2 ml of PBS to ensure the tissue does not dry out.
BASIC PROTOCOL 3
DELIVERY OF DII-COATED TUNGSTEN PARTICLES AND TISSUE MOUNTING
Helium pressure forced through the bullet expels the DiI-coated tungsten particles. The goal is to achieve a good dispersion pattern of particle release that will cover the area of the tissue section without producing tissue damage. This section describes the steps taken to effectively deliver the DiI particles to the tissue. If performing protocol with the immunofluorescence option (Alternate protocol 1), bullets should be made with CM-DiI.
Materials
Tissue slices – 150–300 µm thick (see Basic Protocol 2)
Helium gas/regulator
Helium hose assembly with quick release fitting to connect to the Gene Gun
Gene Gun (BioRad) with accessories
Bullets (see Basic Protocol 1)
Modified barrel (O'Brien et al., 2001)
40 mm spacer (O'Brien et al., 2001)
Disposable plastic pipettes (5 ml)
70 µm nylon mesh filter (Plastok Associates Ltd, Birkenhead Merseyside, UK)
PBS, 25 mM, pH=7.2 (see recipe)
4% Paraformaldehyde in PBS (w/v) (see recipe)
Superfrost slides (Brain Research Laboratories, Newton Highlands, MA)
5% n-propyl-gallate in glycerin (w/v) (or any other anti-fade agent may be used)
Set up Helios Gene Gun system using the modified barrel with a 40 mm spacer (O'Brien et al., 2001). Secure 70 µm nylon mesh filter at the head of the modified barrel to prevent large clusters of tungsten penetrating the tissue. More information regarding the set up of this system can be found on the manufacturers’ website (www.biorad.com) as well as in O’Brien et al. (2001).
Load the Gene Gun cartridge with DiI bullets of similar density DiI/tungsten coating.
Open the helium gas regulator to pressurize Gene Gun to 100 PSI prior to delivery of your first bullet to avoid tissue damage/sample loss.
Using a disposable 5 ml pipette, remove all the PBS from tissue slices immediately prior to DiI labeling.
- Deliver DiI-coated particles at 100 PSI helium pressure. Use one bullet per tissue section(Figure 2.13.5).
- IMPORTANT NOTE: Do not flip tissue slice between delivery of DiI and mounting. The face of the tissue that received the tungsten micro-carriers MUST be mounted ‘face-up’ on the slide for successful imaging. This is particularly important the thicker the slice cut becomes.
- Re-suspend tissue sections in PBS immediately following DiI delivery.
- IMPORTANT NOTE: Do not flip tissue slice between delivery of DiI and mounting. The face of the tissue that received the tungsten micro-carriers MUST be mounted ‘face-up’ on the slide for successful imaging. This is particularly important the thicker the slice cut.
Allow DiI to diffuse through the tissue in the dark for 24 hours at room temperature.
Post-fix slices for 1 hour in 4% paraformaldehyde.
- Wash once briefly in room temperature PBS (a minute or two) and replace with fresh PBS. Maintain the tissue slices in PBS until mounting. Mounting should occur as quickly as possible following the 4% paraformaldehyde post-fix.
- If continuing with Immunofluorescence, stop here and move to Alternate Protocol 1.
- Mount slices on Superfrost slides using 5% n-propyl-gallate in glycerin. Cover-slip and seal slides.
- Any coated slide or anti-fade agent may be used.
Figure 2.13.5.
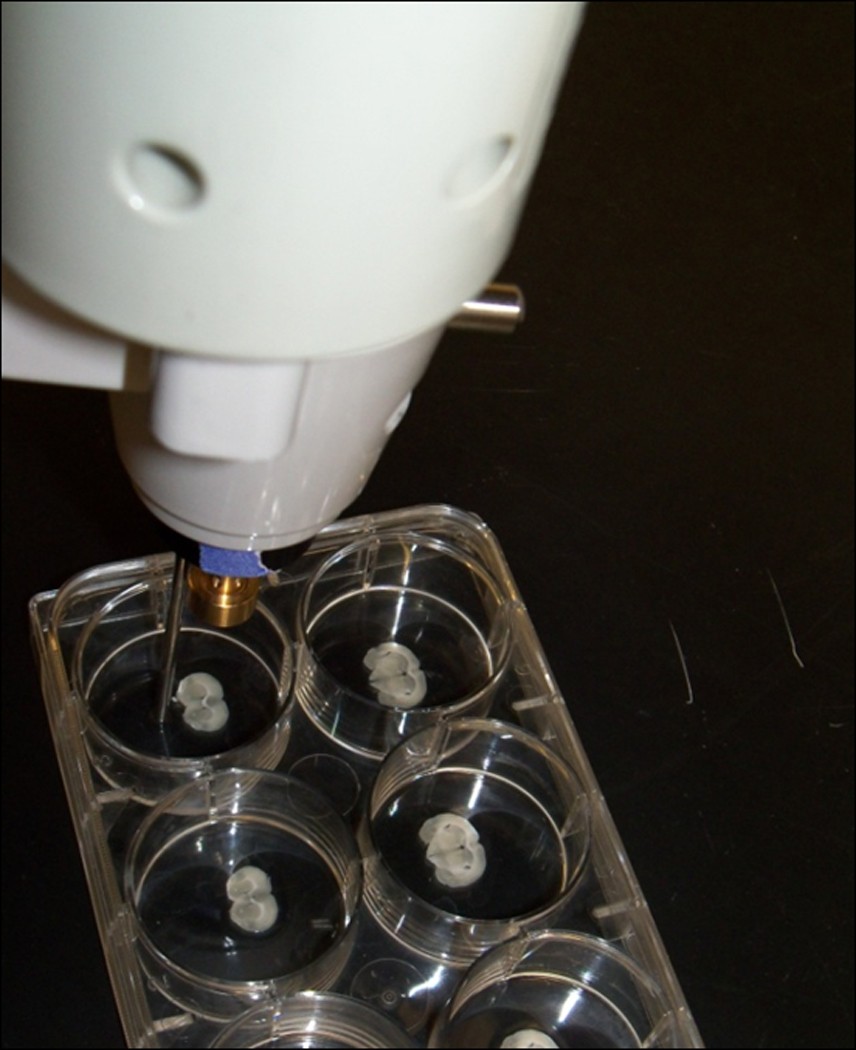
The Gene Gun with the modified barrel and 40 mm spacer. The spacer is placed at the same orientation to the brain slice each time a bullet is delivered to increase consistency of dispersion of the micro-carriers.
ALTERNATE PROTOCOL 1
IMMUNOFLUORESCENCE
One characteristic of the DiI labeling that researchers have taken advantage of is the ease of combining this method of morphological identification of neuronal structure with other histological methods to identify the chemical phenotype of the DiI-labeled neurons. This protocol illustrates a method to combine DiI labeling with immunofluorescent staining techniques.
Materials
0.1% and 0.01% Triton-X 100 (see recipe)
Bovine Serum Albumin (BSA) stock
PBS 25 mM, pH=7.2 (see recipe)
Primary antibody of interest
Appropriate fluorescent secondary antibody for conjugation – ensure secondary antibody and DiI excitation/emission spectra do not overlap
Superfrost slides (Brain Research Laboratories, Newton Highlands, MA)
5% n-propyl-gallate in glycerin (w/v)
Permeablize DiI labeled tissue sections in 0.1% Triton-X 100 in PBS for 15 minutes at room temperature.
- Block sections in 0.01% Triton-X 100, 10% BSA in PBS for 30 minutes at room temperature.
- BSA concentrations are flexible. Protocol may be adjusted to standard serum/blocking/incubation procedures currently in place in the laboratory.
Incubate in primary antibody (at appropriate dilution) in 0.01% Triton-X 100, 0.1% BSA in PBS overnight at 4°C and then overnight at room temperature (48 hours total).
Rinse 3× in 0.1% BSA in PBS.
Incubate with fluorescent secondary antibody for 45 minutes at room temperature.
Rinse 3× in 0.1% BSA in PBS.
- Mount slices on Superfrost slides using 5% n-propyl-gallate in glycerin. Cover-slip and seal slides.
- Any coated slide may be used.
BASIC PROTOCOL 4
CONFOCAL IMAGING
Once the neurons are labeled they need to be imaged. Conventional epifluorescence will permit visualization of the DiI impregnated neurons, though the more important goal of this labeling is quantitative morphological analysis of the neurons. Confocal microscopy permits higher resolution viewing of the labeled neurons along with the ability to produce serial optical sections through the neuron that can later be assembled into a three dimensional structure.
Materials
- Confocal microscope with 20X, 63X and 100X objectives
- Image complete dendritic profiles of DiI impregnated cells using a 20X lens with appropriate optical zoom to fill the field of view with the cell (see unit 2.2).
- Establish z-stack depth, ensuring that distal dendrites are not truncated by the image capture.
- Once z-stack depth is established, scan dendritic profile at 1.0 µm increments along the z-axis.
- Reconstruct z-stack images using confocal software to ensure dendrites have not been truncated during imaging (see Unit 2.8). Use reconstructed images to determine experimentally appropriate branch level and distance from the soma.
- Once branch level/distance from soma are established, increase magnification to 63×/100× oil immersion.
- If using 63× oil immersion lens, adjust optical zoom to allow for maximum distribution of pixel size to tissue dimensions without over-sampling.
- Position segment of interest in the center of the field of view.
- Establish z-stack depth and image at 0.12–1.0 µm steps. Maximum of 200 steps to avoid photo-bleaching your sample.
- Capture experimentally/statistically appropriate number of cells and dendritic segments.
ALTERNATE PROTOCOL 2
QUANTITATION AND ANALYSIS OF DENDRITIC SPINE DENSITY AND SPINE HEAD MORPHOLOGY
Quantitative analysis of dendritic spines is done separately from confocal imaging of the neurons. The reconstruction of the three dimensional view of the neurons and quantitative morphological analyses can be conducted using any appropriate software application. However, among published studies the most common software choice is the Surpass module of the Imaris software package (Bitplane Inc, St. Paul, MN), the protocol for which is outlined here. Reconstruction within the Surpass module of the Imaris software allows for full dendritic and spine analysis; features not available with standard confocal software.
Materials
Imaris software package (Version 7.0, Bitplane Inc, St Paul, MN)
Reconstruct dendritic z-stacks
-
1.
Reconstruct dendritic z-stacks using the Surpass module of the Imaris software package.
-
2.
Within the Draw tab of the Filament module, manually trace the dendritic shaft and spines in the xy plane using the AutoDepth function of the Filament module.
-
3.
Within the Edit tab of the Filament module, center the filament object using the “Center” function under the “Process Filament” menu.
-
4.Within the Edit tab under the “Process Filament” menu, determine the diameter of the Filament object using experimentally appropriate maximum and minimum widths for each image, adjusting the contrast threshold according to the intensity of the experimental image (Figure 2.13.6).
- Determining the appropriate contrast threshold is critical in creating an accurate three-dimensional reconstruction of the dendritic shaft, spine neck and spine head morphology. The software’s reconstruction data is drawn on to classify spines into suitable morphological categories. The most appropriate contrast threshold should be determined for each image.
-
5.
Within the Tools tab, execute “Classify Spines”.
Figure 2.13.6.

Dendritic segment reconstruction. A) Reconstruction of a confocal Z-stack. B) Trace skeleton of the dendrite and spines utilizing the manual trace option within the Surpass module of Imaris software overlaid on the Z-stack reconstruction. C) 3D rendering of the dendritic segment (using the “process filament” mode) used to analyze spine density and spine morphology. Scale bar = 2 µm (Copyright held by Robert Meisel).
Analyze data– spine density
-
6.
Calculate spine density by dividing the total number of spines per dendritic segment and by the dendritic segment length to calculate an average spine density/10 µm. These raw values can be located within the Statistics tab of the Filament module within the Imaris software.
-
7.
Average the spine density/10 µm for all dendritic segments captured per animal to yield the experimental value/spine density for that animal.
-
8.
Execute experimentally appropriate statistical analysis to determine experimental significance.
Analyze data– spine morphology
-
9.
After “Classify Spines” has been run, a subfolder will appear within the Filament object menu of the Imaris software titled “Filament n Classified Spines”.
-
10.
Click on the appropriate subfolder for the Filament.
-
11.
Once in the Filament Classified Spines subfolder, click on the Statistics tab.
-
12.
Sum total spine population and counts of each spine class (stubby, filapodial, long thin and mushroom).
-
13.
Execute experimentally appropriate statistical analysis.
REAGENTS AND SOLUTIONS
Unless noted, we use room temperature deionized water (sterilization is not necessary) in all recipes and protocol steps.
Note: We typically do not store any of these solutions, though individual laboratories should feel free to use their own protocol.
Phosphate Buffered Saline (PBS, 25 mM) – 1 liter
0.36 g sodium phosphate monobasic
3.14 g sodium phosphate dibasic anhydrous
8.9 g sodium chloride
Fill to 1 L with de-ionized water. PBS should be made fresh for each round of perfusions/tissue labeling.
1.5% paraformaldehyde – 1 liter
0.36 g sodium phosphate monobasic
3.14 g sodium phosphate dibasic anhydrous
8.9 g sodium chloride
Fill to 1 L with de-ionized water
15 g paraformaldehyde (granular)
Heat 1 liter PBS (above) to 60°C, stirring constantly. Once at temperature, add 15 g granular paraformaldehyde and turn heat to low. Stir constantly until granular paraformaldehyde has gone completely into solution.
4% paraformaldehyde – 1 liter
0.36 g sodium phosphate monobasic
3.14 g sodium phosphate dibasic anhydrous
8.9 g sodium chloride
Fill to 1 L with de-ionized water
40 g paraformaldehyde (granular)
Heat 1 L PBS (above) to 60°C, stirring constantly. Once at temperature, add 40 g granular paraformaldehyde and turn heat to low. Stir constantly until granular paraformaldehyde has gone completely into solution.
0.1% Triton-X 100 – 100 ml permeablization solution for immunofluorescence
100 ml PBS (above)
100 µl Triton-X 100
10% BSA, 0.01% Triton-X 100 – 100 ml blocking solution for immunofluorescence
100 ml PBS (above)
10 g BSA
10 µl Triton-X 100
0.1% BSA, 0.01% Triton-X 100 in PBS – 100 ml primary, secondary and wash solution for immunofluorescence
100 ml PBS (above)
10 µl Triton-X 100
1 g BSA
COMMENTARY
Background Information
For over one hundred years, Golgi –Cox staining has been the ‘gold standard’ for labeling morphology and dendritic arborizations of individual neurons. Within the last decade, however, fluorescent labeling of neuronal morphologies has become common with the development of “DiOlistic” labeling, high-pressure ballistic delivery of fluorescent dye coated gold or tungsten particles to neurons. DiOlistic labeling offers a rapid and versatile alternative to Golgi staining. This unit focuses on the delivery of lipophilic carbocyanine dyes into fixed tissue slices. Dextran-conjucated fuorescent dyes as an option for ballistic labeling of living tissue has been described in a previous unit (see UNIT 2.11).
For the delivery of lipophilic carbocyanine dyes, gold or tungsten particles (1.3 µm) are coated with the dye and propelled under high helium pressure into either live or fixed tissues. Gold particles tend to be more uniform in shape (i.e. spherical), whereas the surface of tungsten particles is comparably uneven. The less uniform shape of the tungsten allows for more dye to adhere, and to adhere better, to the surface of the particle. Originally, gold particles were the preferred choice for ballistic delivery of DNA constructs into cell culture because their smooth surfaces caused less disruption to the cellular membrane. However, for DiOlisic labeling, there is no clear advantage to the use of gold, and given the added cost of gold particles over tungsten, most laboratories opt for tungsten.
When applied to fixed tissue, lipophilic carbocyanine dyes are attracted to, diffuse throughout, and are maintained in the cellular membrane for long periods of time without any apparent cytotoxicity (Honig and Hume, 1986; Liu and Westerfield, 1990). Prior to the development of DiOlistic labeling, the main means of applying lipophilic carbocyanine dyes to tissue either resulted in labeling a dense population of neurons, making visualization of individual neuronal morphologies quite difficult (O'Rourke et al., 1994; Wu and Cline, 1998), or utilized a sharp electrode to label individual axons – a tedious and time consuming approach that results in very few labeled cells (Gan and Lichtman, 1998; Gan et al., 1999). DiOlistic delivery circumvents these previous obstacles by dispersing dye coated micro-carriers across tissue samples, and also allows for “rapid and differential labeling” (Gan et al., 2000) of neurons in culture or slice.
Electroporation of dyes, transgenic models and Golgi staining are alternative approaches to labeling neuronal morphology (Russo et al., 2010). When compared to these methods, DiOlistic labeling proves to be a high throughput means of labeling neuronal morphologies. Using a micropipette, electroporation can provide comparable fluorescent labeling of individual cells; however, this technique is very time consuming and becomes rapidly impractical if a large population of cells need to be labeled. Transgenic animals and cell lines can also be designed to drive fluorescent expression under a particular promoter. Although this method provides great specificity of fluorescent expression, the same end can be accomplished with a much shorter time frame and far fewer supplies/material by coupling DiOlisic labeling with techniques such as immunofluorescence. Another limitation of the transgenic approach is that its application is limited to a few species. Compared with Golgi staining, DiOlistic labeling involves very few reagents, the majority of which are non-toxic. DiOlistic labeling also provides far more control in the labeling density than Golgi staining, as the density of labeling is determined by the ratio of tungsten: carbocyanine dye. The experimenter may tailor this ratio to acquire the optimal labeling density for a given experimental condition. An added advantage of DiOlistic labeling over Golgi is that it takes advantage of the fluorescent spectrum, allowing the experimenter to couple this fluorescent technique with other fluorescent methodologies (e.g., immunofluorescence) enabling the association of an individual neuronal phenotype with its cellular morphology. Although Golgi staining can penetrate throughout the depth of the tissue sample, white light images are acquired, limiting the possibility of three dimensional reconstructions. Also, due to the capricious nature of Golgi staining, there is little control over its labeling density and different protocols may be required for various brain regions. When compared to alternatives, DiOlistic labeling is a flexible, non-toxic, high-throughput technique that is rapidly becoming a preferred method for the identification of neuronal morphology.
Critical Parameters and Troubleshooting
Fixation
Among the most important parameters of this procedure is the fixation concentration and time. Although others have successfully reported DiOlistic labeling with 4% paraformaldehyde ( e.g., Li et al.; Gan et al., 2000; Moolman et al., 2004; Wu et al., 2004; Oberheim et al., 2008; Cui et al., 2010), in our hands this concentration was completely unsuccessful. Our preference for lower aldehyde concentrations is consistent with others who have run side-by-side experiments comparing these two fixation conditions (Neely et al., 2009). If there is very intense, non-discriminate labeling (i.e., bright background fluorescence), this is a good indicator of over-fixation prior to ballistic labeling of the tissue sample. In this case, reducing fixation time and/or aldehyde concentration is suggested.
Coating of Tefzel tubing
One of the greatest obstacles in producing reliable and consistent DiOlistic labeling is evenly coating the Tefzel tubing (BioRad) with dye coated tungsten particles. A handful of factors can contribute to how densely labeled a tissue slice will end up, which include pressure of tungsten delivery, tungsten weight, dye weight, and PVP concentration.
PVP is commonly used to line the Tefzel tubing with tungsten-coated carbocyanine dyes because it increases the ‘stickiness’ of the tubing interior. One key factor to keep in mind when coating the tubing is that the stickier the tubing interior, the fewer micro-carriers will be displaced with each helium burst. You can vary the density of labeling by altering the ratio of tungsten:dye, changing the pressure at which the micro-carriers are delivered, or adjusting the concentration of the PVP coating. We strongly suggest that you vary only one of these components at a time, i.e. vary only pressure, tungsten weight, dye weight, or PVP concentration when working out optimal conditions.
Problems with tissue labeling
There are a variety of reasons for less than optimal tissue labeling. The most common problems, probable causes and solutions are outlined in Table 2.13.1.
Table 2.13.1.
Common problems and possible solutions.
| Problem | Possible Cause | Solution |
|---|---|---|
| High background without specific cellular labeling | Over fixation of tissue | Reduce aldehyde concentration and/or fixation time |
| Too much labeling – “tissue blow-out” | Too much dye/too many micro-carriers are delivered to the tissue | Increase PVP concentration, decrease weight of tungsten/dye |
| Too few cells are labeled/low labeling efficiency across tissue | Too few micro-carriers are delivered | Decrease PVP concentration, increase weight of tungsten/dye |
| Too few cells are labeled/low labeling efficiency across tissue | Micro-carriers were not delivered at high enough pressure | Increase helium pressure during micro-carrier delivery |
| Tissue tears during micro-carrier delivery | Helium pressure too high/Gene Gun too close to tissue | Decrease helium pressure/increase Gene Gun distance from tissue |
| Dendritic arborizations appear to be abruptly truncated | Tissue slice is too thin | Increase slice thickness |
| Cells appear “foggy” during imaging | Tissue slice was flipped over between micro-carrier delivery and mounting | Be sure to mount the tissue “face up” to the side of micro-carrier delivery |
Anticipated Results
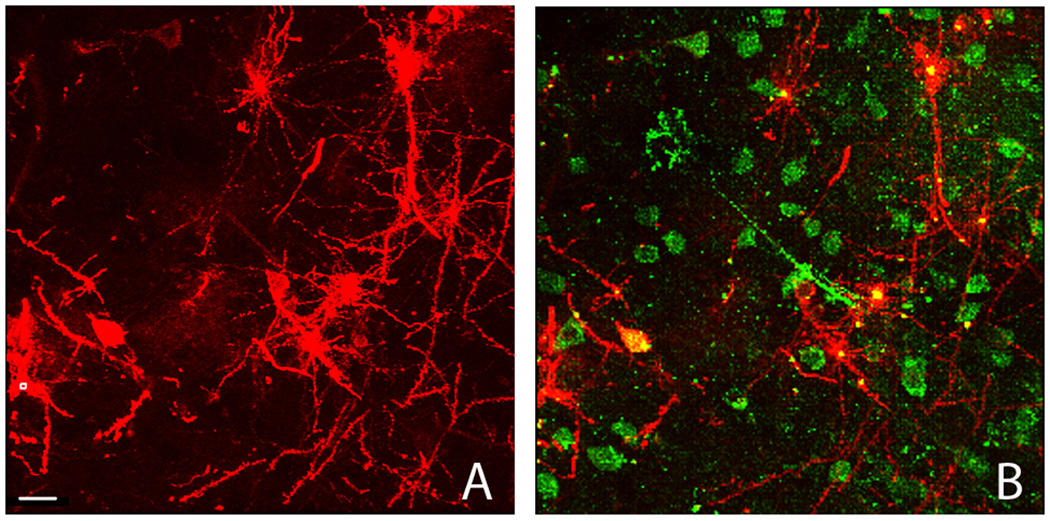
Typical results should yield relatively even dispersion of micro-carriers across tissue sample surfaces with cells brightly illuminated and low background fluorescence. Figure 2.13.7A provides a field view of a tissue slice after ballistic labeling with DiI and gives an idea of the labeling density one may expect. Also, within the tissue slice it is common to find labeling of truncated axons, as well as clumps of micro-carriers that were not caught by the mesh filter. Figure 2.13.8 shows an image of the fill one can expect from DiOlistic labeling, but also includes one such micro-carrier clump.
Figure 2.13.7.
Field view of DiI labeled tissue. A) Low power image of DiI labeled tissue slice. Scale bar = 20 µm. B) Over lay of DiI and immunofluorescent Hu staining, depicting the colocalization that is possible which enables the association of dendritic morphology with a neuronal phenotype (Copyright held by Robert Meisel).
Figure 2.13.8.
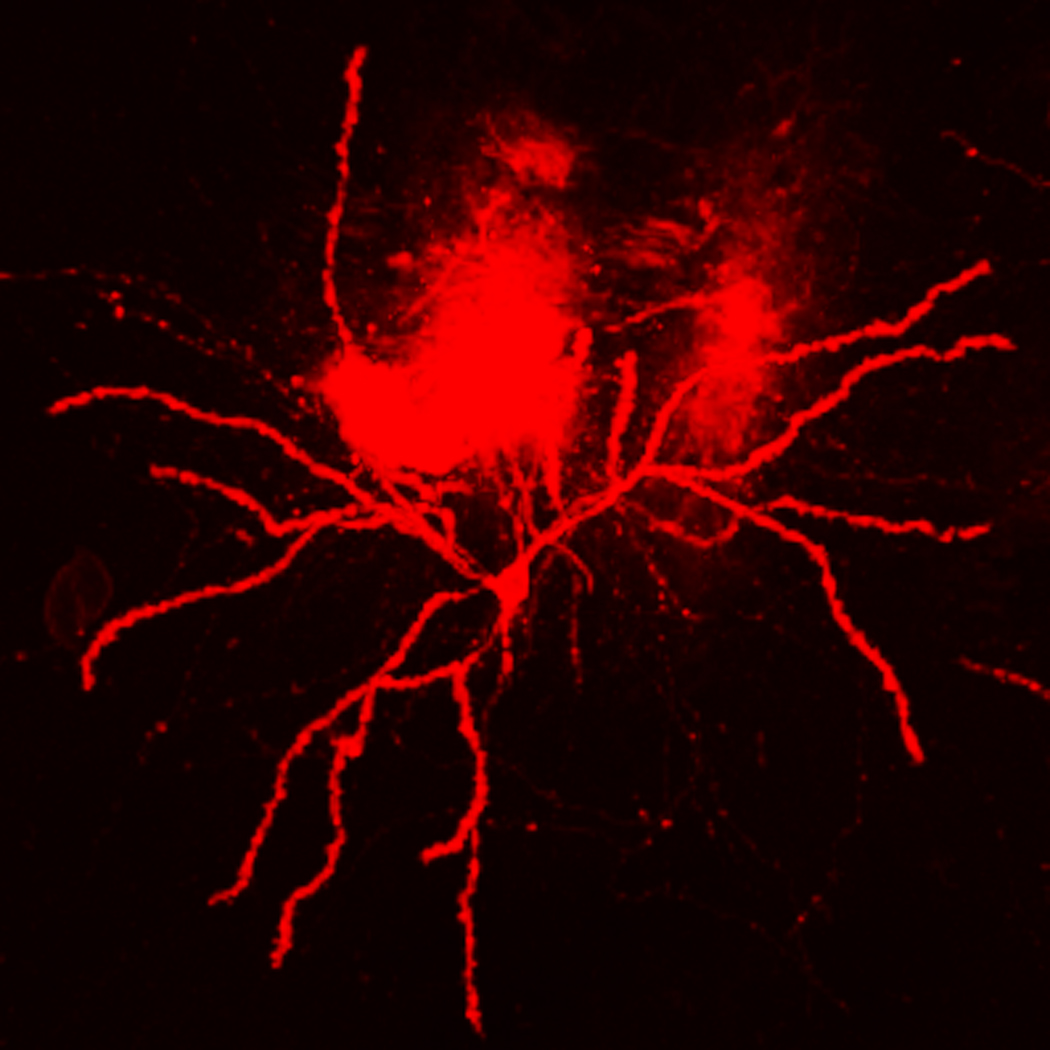
This is a low power image that depicts our usual quality of DiOlistic labeling. In the field of view is background fluorescence within the tissue slice, most likely generated by clumps of micro-carriers that were not captured by the mesh filter at the time of delivery. Scale bar = 20 µm (Copyright held by Robert Meisel).
Using Alternate Protocol 1, colocalization of an immunofluorescent signal and DiI is possible (Figure 2.13.7B), enabling the association of a neuronal phenotype with a particular cellular or dendritic morphology.
Time Considerations
Allow plenty of extra time the first time through the protocol; the usual time for each step of the procedure is outlined here:
Perfusion and tissue slicing for one animal: 2 hours
Preparation of ‘bullets’: 1 hour
Delivery of micro-carriers: 15–30 minutes (will increase with the number of samples)
Diffusion: 24 hours
Mounting: 1 hour
Acknowledgements
This work was supported by National Institutes of Health grant DA 13680 to Robert L Meisel, and training grant T32 DA07234 (Virginia Seybold, Principal Investigator).
Literature cited
- Buhl EH, Lubke J. Intracellular lucifer yellow injection in fixed brain slices combined with retrograde tracing, light and electron microscopy. Neuroscience. 1989;28:3–16. doi: 10.1016/0306-4522(89)90227-3. [DOI] [PubMed] [Google Scholar]
- Chklovskii DB. Synaptic connectivity and neuronal morphology: two sides of the same coin. Neuron. 2004;43:609–617. doi: 10.1016/j.neuron.2004.08.012. [DOI] [PubMed] [Google Scholar]
- Coss RG, Perkel DH. The function of dendritic spines: a review of theoretical issues. Behav Neural Biol. 1985;44:151–185. doi: 10.1016/s0163-1047(85)90170-0. [DOI] [PubMed] [Google Scholar]
- Cui ZJ, Zhao KB, Zhao HJ, Yu DM, Niu YL, Zhang JS, Deng JB. Prenatal alcohol exposure induces long-term changes in dendritic spines and synapses in the mouse visual cortex. Alcohol Alcohol. 2010;45:312–319. doi: 10.1093/alcalc/agq036. [DOI] [PubMed] [Google Scholar]
- Fairen A. Pioneering a golden age of cerebral microcircuits: the births of the combined Golgi-electron microscope methods. Neuroscience. 2005;136:607–614. doi: 10.1016/j.neuroscience.2005.08.011. [DOI] [PubMed] [Google Scholar]
- Forlano PM, Woolley CS. Quantitative analysis of pre- and postsynaptic sex differences in the nucleus accumbens. J Comp Neurol. 2010;518:1330–1348. doi: 10.1002/cne.22279. [DOI] [PMC free article] [PubMed] [Google Scholar]
- Gan WB, Bishop DL, Turney SG, Lichtman JW. Vital imaging and ultrastructural analysis of individual axon terminals labeled by iontophoretic application of lipophilic dye. J Neurosci Methods. 1999;93:13–20. doi: 10.1016/s0165-0270(99)00096-5. [DOI] [PubMed] [Google Scholar]
- Gan WB, Grutzendler J, Wong WT, Wong RO, Lichtman JW. Multicolor "DiOlistic" labeling of the nervous system using lipophilic dye combinations. Neuron. 2000;27:219–225. doi: 10.1016/s0896-6273(00)00031-3. [DOI] [PubMed] [Google Scholar]
- Gan WB, Lichtman JW. Synaptic segregation at the developing neuromuscular junction. Science. 1998;282:1508–1511. doi: 10.1126/science.282.5393.1508. [DOI] [PubMed] [Google Scholar]
- Hollingworth T, Berry M. Network analysis of dendritic fields of pyramidal cells in neocortex and Purkinje cells in the cerebellum of the rat. Philos Trans R Soc Lond B Biol Sci. 1975;270:227–264. doi: 10.1098/rstb.1975.0008. [DOI] [PubMed] [Google Scholar]
- Honig MG, Hume RI. Fluorescent carbocyanine dyes allow living neurons of identified origin to be studied in long-term cultures. J Cell Biol. 1986;103:171–187. doi: 10.1083/jcb.103.1.171. [DOI] [PMC free article] [PubMed] [Google Scholar]
- Kasai H, Fukuda M, Watanabe S, Hayashi-Takagi A, Noguchi J. Structural dynamics of dendritic spines in memory and cognition. Trends Neurosci. 2010;33:121–129. doi: 10.1016/j.tins.2010.01.001. [DOI] [PubMed] [Google Scholar]
- Li M, Cui Z, Niu Y, Liu B, Fan W, Yu D, Deng J. Synaptogenesis in the developing mouse visual cortex. Brain Res Bull. 81:107–113. doi: 10.1016/j.brainresbull.2009.08.028. [DOI] [PubMed] [Google Scholar]
- Liu DW, Westerfield M. The formation of terminal fields in the absence of competitive interactions among primary motoneurons in the zebrafish. J Neurosci. 1990;10:3947–3959. doi: 10.1523/JNEUROSCI.10-12-03947.1990. [DOI] [PMC free article] [PubMed] [Google Scholar]
- Moolman DL, Vitolo OV, Vonsattel JP, Shelanski ML. Dendrite and dendritic spine alterations in Alzheimer models. J Neurocytol. 2004;33:377–387. doi: 10.1023/B:NEUR.0000044197.83514.64. [DOI] [PubMed] [Google Scholar]
- Neely MD, Stanwood GD, Deutch AY. Combination of diOlistic labeling with retrograde tract tracing and immunohistochemistry. J Neurosci Methods. 2009;184:332–336. doi: 10.1016/j.jneumeth.2009.08.016. [DOI] [PMC free article] [PubMed] [Google Scholar]
- O'Brien JA, Holt M, Whiteside G, Lummis SC, Hastings MH. Modifications to the hand-held Gene Gun: improvements for in vitro biolistic transfection of organotypic neuronal tissue. J Neurosci Methods. 2001;112:57–64. doi: 10.1016/s0165-0270(01)00457-5. [DOI] [PubMed] [Google Scholar]
- O'Rourke NA, Cline HT, Fraser SE. Rapid remodeling of retinal arbors in the tectum with and without blockade of synaptic transmission. Neuron. 1994;12:921–934. doi: 10.1016/0896-6273(94)90343-3. [DOI] [PubMed] [Google Scholar]
- Oberheim NA, Tian GF, Han X, Peng W, Takano T, Ransom B, Nedergaard M. Loss of astrocytic domain organization in the epileptic brain. J Neurosci. 2008;28:3264–3276. doi: 10.1523/JNEUROSCI.4980-07.2008. [DOI] [PMC free article] [PubMed] [Google Scholar]
- Purves D, Hume RI. The relation of postsynaptic geometry to the number of presynaptic axons that innervate autonomic ganglion cells. J Neurosci. 1981;1:441–452. doi: 10.1523/JNEUROSCI.01-05-00441.1981. [DOI] [PMC free article] [PubMed] [Google Scholar]
- Russo SJ, Dietz DM, Dumitriu D, Morrison JH, Malenka RC, Nestler EJ. The addicted synapse: mechanisms of synaptic and structural plasticity in nucleus accumbens. Trends Neurosci. 2010;33:267–276. doi: 10.1016/j.tins.2010.02.002. [DOI] [PMC free article] [PubMed] [Google Scholar]
- Spacek J. Dynamics of the Golgi method: a time-lapse study of the early stages of impregnation in single sections. J Neurocytol. 1989;18:27–38. doi: 10.1007/BF01188421. [DOI] [PubMed] [Google Scholar]
- Spergel DJ, Kruth U, Shimshek DR, Sprengel R, Seeburg PH. Using reporter genes to label selected neuronal populations in transgenic mice for gene promoter, anatomical, and physiological studies. Prog Neurobiol. 2001;63:673–686. doi: 10.1016/s0301-0082(00)00038-1. [DOI] [PubMed] [Google Scholar]
- Wu CC, Reilly JF, Young WG, Morrison JH, Bloom FE. High-throughput morphometric analysis of individual neurons. Cereb Cortex. 2004;14:543–554. doi: 10.1093/cercor/bhh016. [DOI] [PubMed] [Google Scholar]
- Wu GY, Cline HT. Stabilization of dendritic arbor structure in vivo by CaMKII. Science. 1998;279:222–226. doi: 10.1126/science.279.5348.222. [DOI] [PubMed] [Google Scholar]


