Abstract
The Protein Information and Property Explorer 2 (PIPE2) is an enhanced software program and updated web application that aims at providing the proteomic researcher a simple, intuitive user interface through which to begin inquiry into the biological significance of a list of proteins typically produced by MS/MS proteomic processing software. PIPE2 includes an improved interface, new data visualization options, and new data analysis methods for combining disparate, but related, data sets. In particular, PIPE2 has been enhanced to handle multi-dimensional data like protein abundance, gene expression, and/or interaction data. The current architecture of PIPE2, modeled after that of the Gaggle (a programming infrastructure for interoperability between separately developed software tools), contains independent functional units that can be instantiated and pieced together at the user’s discretion to form a pipelined analysis workflow. Among these functional units is the Network Viewer component, which adds rich network analysis capabilities to the suite of existing proteomic web resources. Additionally, PIPE2 implements a framework within which new analysis procedures can be easily deployed and distributed over the World Wide Web. PIPE2 is available as a web service at http://pipe2.systemsbiology.net/.
Keywords: Interaction networks, Biological inference, Gene ontology, Software analysis
Technical Brief
Proteomics experiments typically include extraction of proteins from samples, fractionation, enzymatic digestion and analysis of the resultant peptide pools by mass spectrometry to arrive at quantifiable lists of protein identifications. With the use of mass spectrometry to perform peptide identification, inferences to protein identification are usually performed using pattern-matching software with peptide fragment databases. Proteomic processing software, such as the TransProteomic Pipeline (TPP) [1], typically produces statistically validated lists of identified proteins from these original experimental samples leaving the researcher to begin the task of defining relevant biological information using manual database searching or tedious publication mining. In 2008, we introduced “The Protein Information and Property Explorer” (PIPE1) [2] as an easy-to-use web application to facilitate the interpretation and understanding of the biological significance of proteomic experimental results. Here we present a significant upgrade to PIPE (PIPE2) in an effort to provide additional functionality and to aid in data exploration and visualization, including analysis of multi-dimensional data sets (e.g. RNA or protein expression level data, protein interaction data, and functional association data).
Conceptually, PIPE2 is modeled after the Gaggle framework [3], where the application plays host to several different “mini-applications” (or “PIPElets”) that can be instantiated at the user’s discretion. Based on this design, PIPE2 provides a data analysis workflow framework where users can pick and choose functional modules and piece them together as needed. Each newly instantiated PIPElet is completely independent and unaware of the state of the other PIPElets that may have been instantiated by the user beforehand. All PIPElets communicate through a simple common interface mechanism known as “broadcasting”. From the user’s point of view, each newly instantiated PIPElet is drawn into a window within the browser, with the goal of making the PIPE2 application seem natural and intuitive.
From the developer’s point-of-view, this “loosely coupled” architecture allows for easy extendibility since each new functional unit can be introduced as a new PIPElet, and can be developed without consideration for other parts of the application other than to ensure compliance with the predetermined PIPElet interface. The development of PIPE2 was undertaken to greatly increase the ability to take highly specific computational processes, generalize them, make them easily accessible online in a simple-to-use, point-and-click interface, and to enable the newly published computational service to interact with other processes that have previously undergone the same transformation. This architectural scheme is consistent with established systems biology software design principles, such as providing a framework for interoperability between independently developed software tools and ease of future integration of new technologies[4].
Currently, five PIPElets exist in PIPE2 and each of these can be instantiated by clicking the respective link on the initial “Controller” window in the application:
Network Viewer
When data are broadcasted into this PIPElet, they are displayed visually as a network. Edges can be added manually or by querying curated protein-protein interactions in publically accessible databases such as the Human Protein Reference Database [5] or BioGrid Yeast protein-protein interaction database [6]. Networks can be expanded through the interactions contained within these databases by importing these into PIPE2. Gene Ontology category associations can be also added to the network through broadcasts from the GO Enrichment PIPElet or from the Keyword Search PIPElet. When more than one broadcast is performed, this PIPElet “smart merges” the two data sets, while retaining the names of all the broadcast sources of every node. This information is useful for finding associations between two or three different sets of protein lists. In addition, the Network Viewer PIPElet contains several essential network exploration functions such as filtering visible nodes based on degree or on data attributes, selecting nearest neighbors of selected nodes, different network layouts, and changing the visual attributes of nodes (color, shape, size) based on attributes of the data. This last feature is especially useful for cases such as visualizing expression data. Snapshots of generated networks in PIPE2 can be downloaded in jpg format for publication purposes.
ID Mapper
This PIPElet encapsulates a significant portion of PIPE 1’s functionality. Its main function is to translate one type of identifier to another. This PIPElet also allows the user to upload or copy and paste their data in tab delimited format into PIPE2. Data can be taken out of PIPE2 via the download feature in this PIPElet. When the currently implemented mappings are not sufficient to suit the user’s needs, this PIPElet allows the user to upload an identifier mapping file and then use it to annotate this data.
Gene Ontology Enrichment
Given a list of Entrez Gene IDs (or yeast ORFs), this PIPElet calculates which functional categories are enriched in the input list. Enrichment is performed for functional categories in biological process, molecular function, or cellular component and is accomplished with the GOstats Bioconductor package for R [7]. The operation calculates p-values for each of the enriched functional categories, returns the depth of each of the categories in the ontology tree, the total number of genes annotated to that category, and the number of the submitted genes mapped to that category. The results are returned in table format that can either be downloaded or broadcasted to other PIPElets (such as the Network Viewer) for further analysis.
Keyword Search
The user submits a search term and the organism of interest, and the Gene Ontology and UniProt databases are searched, and all genes belonging to a category containing the search term(s) are returned.
Venn Diagram
This PIPElet may receive up to 3 broadcasts of list data. After each broadcast, it displays an updated image of a scaled Venn diagram depicting the overlap between the data sets. The number of unique elements in each data set and the number of overlapping elements across the data sets are printed below the image in a table.
PIPE2 is also able to transmit data from the web browser hosting it to the suite of desktop and web tools composing the Gaggle. This functionality is enabled when PIPE2 detects that the user is using the Firefox web browser with the Firegoose toolbar [8] installed. Some of the notable web resources accessible through Firegoose including PeptideAtlas [9], KEGG [10], STRING [11], and DAVID [12]. Desktop tools accessible through Firegoose include the Multiple Experiment Viewer [13], Cytoscape [14], and the R statistical software.
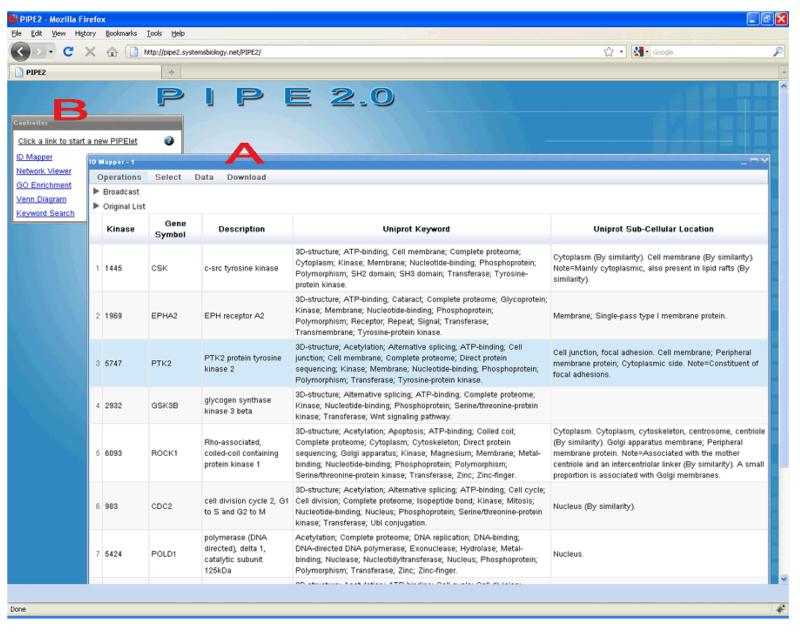
To demonstrate the utility of the PIPE2, an example of analyzing a list of protein kinases is shown in Figures 1-3. The goal is to expand and/or filter this list using the features of PIPE2 in order to find additional potential protein targets for targeted quantitative proteomic studies (i.e. selected reaction monitoring (SRM) analysis) concerning kinase activity during the development of breast cancer. Protein kinases constitute a class of enzymes that play a key role in signal transduction pathways. Numerous studies have confirmed the dysregulation of protein kinases in several diseases, in particular cancer. We began this analysis by selecting a subset of 18 protein kinases identified in shotgun proteomic mass spectrometry experiments on human breast cancer cell lines. Figure 1 shows these proteins loaded into an instance of the IDMapper PIPElet in the PIPE2 application. The IDMapper’s “ID Mapping” operation was performed to look up the Entrez gene ID, description, UniProt keywords, and sub-cellular location, according to UniProt.
Figure 1.
The PIPE2 application with A) a list of gene IDs loaded into the ID Mapper PIPElet and mapped to gene symbol, UniProt keywords, and UniProt sub-cellular locations. B) The “Controller” window containing startup links for each of the 5 currently implemented PIPElets.
Figure 3.
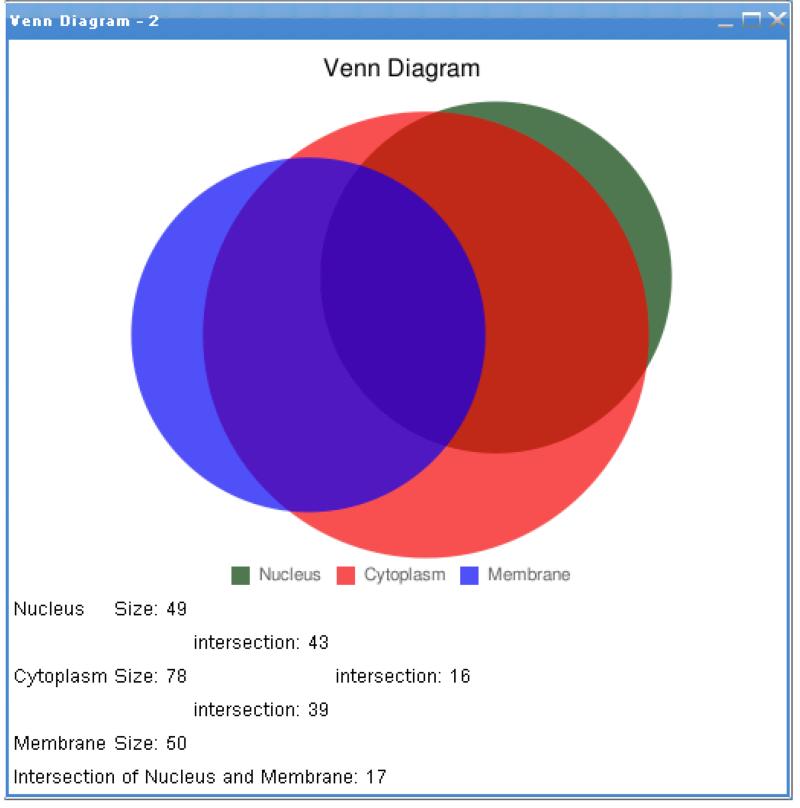
Venn diagram depicting the overlap of the identified potential protein kinase targets for follow-up SRM (targeted) MS/MS proteomic studies with respect to Gene Ontology cellular component annotations “membrane”, “cytoplasm”, and “nucleus”.
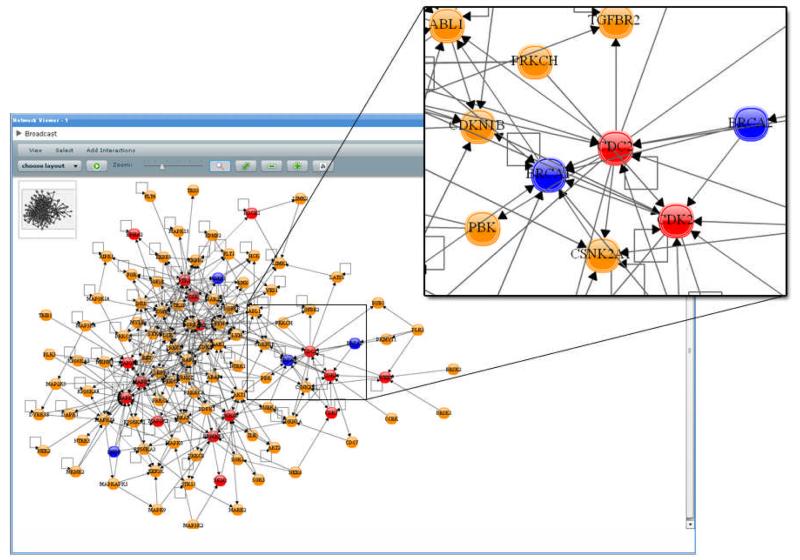
Next, these data were broadcast into the Network Viewer and adjacent nodes were added through HPRD-curated protein-protein interactions via the Network Viewer PIPElet’s Expand Network Through Interactions feature. The newly added nodes were then annotated via another instance of the IDMapper PIPElet and broadcast back to the Network Viewer. Everything but nodes containing either “cancer” or “kinase” in their annotations were hidden from view (via the View → Hide→ By Attribute Value feature in the Network Viewer PIPElet). The protein interaction network shown in Figure 2 shows the original input of several protein kinases colored in red, newly added ones in orange, and nodes annotated as being relevant to cancer in blue. The Venn Diagramming PIPElet is then employed to analyze the distribution of these newly identified protein kinases and interactions with respect to sub-cellular location (Figure 3). A preliminary result of this analysis has identified several of the newly identified protein kinase interactions in further studies using additional breast cancer tumor cell lines (Kusebauch, manuscript in preparation).
Figure 2.
An initial set of protein kinases were broadcast into this Network Viewer PIPElet. The set was then expanded through this PIPElet’s Add Interactions → Human → Expand Network Through HPRD Interactions operation and all of the resulting proteins not containing “kinase” and/or “cancer” in their gene descriptions were hidden from view. Proteins from the original set were colored in red, from the expanded set in orange, and those proteins containing the word “cancer” in their gene description in blue.
Gehlenborg et al.[15] recently surveyed several currently existing web resources for the visualization and analysis of systems biology data. Among the web applications they surveyed, Graphle, MAGGIE Data Viewer, and VisANT are of particular note because they are somewhat similar to PIPE2. The difference, however, is in the range of diverse functions possible within each software tool. Graphle and VisAnt, for example, are strictly network and pathway analysis tools, and are reliant on the user to ensure their submitted identifiers conform to the tools’ standards [16, 17]. In this regard, PIPE2 is more flexible, where different modules allow the user to perform several different functions all from the same site. Additionally, PIPE2 leverages its connection to the Gaggle to make it simple for the user to transition between other software packages if needed. This provides a great advantage over other tools that require the user to download their data in one format to then reformat it so that it can be loaded into another software tool.
The features of PIPE2 are also being integrated by links in other software projects such as the quantitative mass spectrometry feature extraction platform “Corra” [18], and the quantitative SRM analysis pipeline project called the “Automated Transition And Quantitation Software” ATAQS project (Brusniak et al., submitted), which utilize PIPE2 to enable the researcher to further interrogate, visualize and manage their increasing datasets. The PIPE2 software project was designed on extensive Asynchronous JavaScript and XML (AJAX) language that was created by compiling JAVA code with Google’s GWT compiler. The Network Viewer module was written as a FLEX component using a licensed version of the Y-Files graphing library for FLEX [19]. The compiled PIPE2 software was tested and verified to work on most web browsers (e.g., Internet Explorer, Google Chrome and Firefox); however PIPE2 requires a Firefox browser with the Firegoose toolbar installed for Gaggle compatibility.
In conclusion, PIPE2 is an extensible framework that contains several useful modules for analyzing proteomic data to produce significant biological inferences. PIPE2 greatly improves on the original version, which was developed specifically for ID mapping and Gene Ontology enrichment operations, by adding additional features and a framework in which further PIPElets can be developed and deployed for community use. PIPE2 can easily incorporate new functional modules in the future, such as a Heatmap PIPElet. Additionally, where PIPE1 was more rigid in its data analysis options, PIPE2 offers the user a more dynamic data exploration experience; when one PIPElet finishes its analysis, the results can then be broadcast to another PIPElet for additional analysis. The Network Viewer component also offers functionality not commonly available in web applications. The PIPE2 application is available athttp://pipe2.systemsbiology.net/.
Acknowledgments
We thank Dr. Julie Kerns for critical review of this manuscript. This work has been funded by the National Heart, Lung and Blood Institute, NIH, under contract N01-HV-28179 (to RA) and the Duchy of Luxembourg (to RM).
List of abbreviations
- (PIPE)
Protein Information and Property Explorer
- (MS/MS)
Tandem mass spectrometry
- (TPP)
TransProteomic Pipeline
- (SRM)
selected reaction monitoring
References
- [1].Keller A, Eng J, Zhang N, Li XJ, Aebersold R. A uniform proteomics MS/MS analysis platform utilizing open XML file formats. Mol Syst Biol. 2005;1 doi: 10.1038/msb4100024. 2005 0017. [DOI] [PMC free article] [PubMed] [Google Scholar]
- [2].Ramos H, Shannon P, Aebersold R. The protein information and property explorer: an easy-to-use, rich-client web application for the management and functional analysis of proteomic data. Bioinformatics. 2008;24:2110–2111. doi: 10.1093/bioinformatics/btn363. [DOI] [PMC free article] [PubMed] [Google Scholar]
- [3].Shannon PT, Reiss DJ, Bonneau R, Baliga NS. The Gaggle: an open-source software system for integrating bioinformatics software and data sources. BMC Bioinformatics. 2006;7:176. doi: 10.1186/1471-2105-7-176. [DOI] [PMC free article] [PubMed] [Google Scholar]
- [4].Boyle J, Cavnor C, Killcoyne S, Shmulevich I. Systems biology driven software design for the research enterprise. BMC Bioinformatics. 2008;9:295. doi: 10.1186/1471-2105-9-295. [DOI] [PMC free article] [PubMed] [Google Scholar]
- [5].Prasad TS, Kandasamy K, Pandey A. Human Protein Reference Database and Human Proteinpedia as discovery tools for systems biology. Methods Mol Biol. 2009;577:67–79. doi: 10.1007/978-1-60761-232-2_6. [DOI] [PubMed] [Google Scholar]
- [6].Stark C, Breitkreutz BJ, Reguly T, Boucher L, et al. BioGRID: a general repository for interaction datasets. Nucleic Acids Res. 2006;34:D535–539. doi: 10.1093/nar/gkj109. [DOI] [PMC free article] [PubMed] [Google Scholar]
- [7].Falcon S, Gentleman R. Using GOstats to test gene lists for GO term association. Bioinformatics. 2007;23:257–258. doi: 10.1093/bioinformatics/btl567. [DOI] [PubMed] [Google Scholar]
- [8].Bare JC, Shannon PT, Schmid AK, Baliga NS. The Firegoose: two-way integration of diverse data from different bioinformatics web resources with desktop applications. BMC Bioinformatics. 2007;8:456. doi: 10.1186/1471-2105-8-456. [DOI] [PMC free article] [PubMed] [Google Scholar]
- [9].Desiere F, Deutsch EW, Nesvizhskii AI, Mallick P, et al. Integration with the human genome of peptide sequences obtained by high-throughput mass spectrometry. Genome Biol. 2005;6:R9. doi: 10.1186/gb-2004-6-1-r9. [DOI] [PMC free article] [PubMed] [Google Scholar]
- [10].Kanehisa M, Araki M, Goto S, Hattori M, et al. KEGG for linking genomes to life and the environment. Nucleic Acids Res. 2008;36:D480–484. doi: 10.1093/nar/gkm882. [DOI] [PMC free article] [PubMed] [Google Scholar]
- [11].Jensen LJ, Kuhn M, Stark M, Chaffron S, et al. STRING 8--a global view on proteins and their functional interactions in 630 organisms. Nucleic Acids Res. 2009;37:D412–416. doi: 10.1093/nar/gkn760. [DOI] [PMC free article] [PubMed] [Google Scholar]
- [12].Dennis G, Jr., Sherman BT, Hosack DA, Yang J, et al. DAVID: Database for Annotation, Visualization, and Integrated Discovery. Genome Biol. 2003;4:P3. [PubMed] [Google Scholar]
- [13].Saeed AI, Sharov V, White J, Li J, et al. TM4: a free, open-source system for microarray data management and analysis. Biotechniques. 2003;34:374–378. doi: 10.2144/03342mt01. [DOI] [PubMed] [Google Scholar]
- [14].Shannon P, Markiel A, Ozier O, Baliga NS, et al. Cytoscape: a software environment for integrated models of biomolecular interaction networks. Genome Res. 2003;13:2498–2504. doi: 10.1101/gr.1239303. [DOI] [PMC free article] [PubMed] [Google Scholar]
- [15].Gehlenborg N, O’Donoghue SI, Baliga NS, Goesmann A, et al. Visualization of omics data for systems biology. Nat Methods. 2010;7:S56–68. doi: 10.1038/nmeth.1436. [DOI] [PubMed] [Google Scholar]
- [16].Hu Z, Mellor J, Wu J, DeLisi C. VisANT: an online visualization and analysis tool for biological interaction data. BMC Bioinformatics. 2004;5:17. doi: 10.1186/1471-2105-5-17. [DOI] [PMC free article] [PubMed] [Google Scholar]
- [17].Huttenhower C, Mehmood SO, Troyanskaya OG. Graphle: Interactive exploration of large, dense graphs. BMC Bioinformatics. 2009;10:417. doi: 10.1186/1471-2105-10-417. [DOI] [PMC free article] [PubMed] [Google Scholar]
- [18].Brusniak MY, Bodenmiller B, Campbell D, Cooke K, et al. Corra: Computational framework and tools for LC-MS discovery and targeted mass spectrometry-based proteomics. BMC Bioinformatics. 2008;9:542. doi: 10.1186/1471-2105-9-542. [DOI] [PMC free article] [PubMed] [Google Scholar]
- [19]. http://www.yworks.com/.


