Abstract
Summary: I propose a new application of profile Hidden Markov Models in the area of SNP discovery from resequencing data, to greatly reduce false SNP calls caused by misalignments around insertions and deletions (indels). The central concept is per-Base Alignment Quality, which accurately measures the probability of a read base being wrongly aligned. The effectiveness of BAQ has been positively confirmed on large datasets by the 1000 Genomes Project analysis subgroup.
Availability: http://samtools.sourceforge.net
Contact: hengli@broadinstitute.org
1 INTRODUCTION
One of the leading sources of errors in SNP discovery is errors caused by indels (Li and Homer, 2010). Current solutions include realignment and filtering SNPs around predicted indels. However, realignment is computationally intensive; filtering SNPs around predicted indels is hampered by indel discovery which itself is a harder problem. This article aims to provide an effective and efficient solution to sorting out SNPs caused by misalignments.
To begin with, we need to make a distinction between read mapping and read alignment, which are often taken as synonymous. I define the alignment of a read as the set of coordinate pairs of read and reference bases that are placed together, while define the mapping of a read as the coordinate interval between the first and the last reference bases inclusive in the alignment. We say an alignment is correct if all bases are aligned correctly and say a mapping is correct if it overlaps the true mapping. Therefore, an alignment can be wrong even if the underlying mapping is correct.
Wrong alignments are mostly caused by the ambiguity in the presence of indels when we are unsure whether differences should be explained by mismatches or by indels. They tend to reoccur in the same context and deceive SNP callers into calling false SNPs.
To account for the intrinsic alignment ambiguity, I model the read alignment with a profile HMM and compute a per-Base Alignment Quality (BAQ) to directly evaluate the probability of misalignment of each base. I will show that by replacing the original base quality with the minimum between the base quality and BAQ we can dramatically improve the SNP accuracy.
2 METHODS
2.1 The profile HMM for computing BAQ
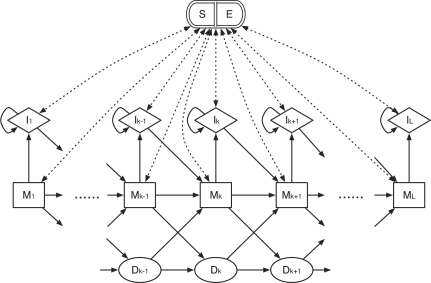
Let the nucleotide reference sequence be x = r1r2…rL (in practice x is the reference subsequence around a mapping) and the read sequence be y = c0c1…clcl+1 where c0 ≡ ‘ˆ’ marks the start of the read and cl+1 ≡‘$’ marks the end. Let ϵi, i = 1…l, be the substitution probability associated with ci, which in practice is set to be the maximum between the scale mutation rate and the sequencing error probability deduced from the base quality. We can construct a profile HMM to simulate how to generate the read sequence y from the reference x without considering introns (Fig. 1).
Fig. 1.
The topology of the profile HMM for BAQ computation. It consists of five types of states: alignment matches (M), insertions to the reference (I), deletions (D), alignment start (S) and alignment end (E). The S state points to every M and I state while every M and I points to E. States S and E are plotted together to avoid excessive dotted lines in the figure.
If we index the five types M, I, D, S and E by 0, 1, 2, 3 and 4, respectively, the transition matrix between types of states is:
 |
where α is the site-independent gap open probability, β the gap extension probability and γ = 1/(2l) controls the average length of the read which does not affect the computation of BAQ in practice, although a formal proof is lacking. By default α and β are set to 0.001 and 0.1, respectively. They should be adjusted based on the sequencing indel error rate.
As to emissions, the S state only emits the start symbol (‘ˆ’) and E emits the end (‘$’). D are silent states that do not emit any symbols. The emission probability from Ik is set to 0.25, and from M is a function of substitution probabilities {εi}, which is, for i = 1,…, l:
2.2 The forward and the backward algorithms
The recurrence equations are given as follows where any undefined values in the forward matrix f or the backward matrix b are assigned to zeros. The initialization of the forward algorithm is (k = 1,…, L):
For i = 2,…, l and k = 1,…, L:
 |
and for i = l+1:
The initialization of the backward algorithm is
For i = l − 1,…, 1 and k = L,…, 1:
 |
and for i = 0:
The probability of the read being generated from the reference equals fl+1,E = b0,S. In development, evaluating the equality helps to check the correctness of the implementation.
2.3 Computing BAQ
We define an alignment A as a set of coordinate pairs {(i1, k1),…, (ip, kp)} with 1≤i1<···<ip≤l and 1≤k1<···<kp≤L. For convenience, define
as the coordinate of the reference base that the read base ci is aligned to. The BAQ is computed as
 |
As Q(i|A) is mostly above 40, the logarithm scale is appropriate. In SNP calling, we update the i-th base quality to min{qi, Q(i|A)} where qi is the original base quality. The SNP calling algorithm may not need to be changed.
2.4 Numerical stability and banded acceleration
Given long sequences, the forward/backward algorithm given above may suffer from floating point underflow. For numerical stability, we compute
instead, where  represents any state and the scaling factor si is chosen such that
  . I refer to Durbin et al. (1998) and the source code for details on computing
  ,
,  and s.
Another concern with the computation of BAQ is the quadratic time and space complexity O(L · l). This can be resolved by only computing the forward and the backward matrices within a band that is large enough to contain the likely alignments.
3 RESULTS AND DISCUSSIONS
BAQ is implemented in the SAMtools software package (Li et al., 2009), distributed under the MIT open source license.
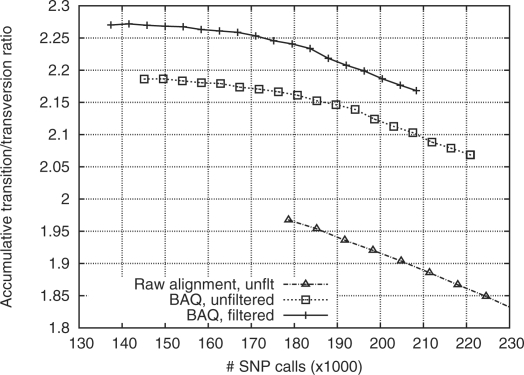
I applied the method to the chromosome 20 alignment of 60 low-coverage pilot CEU samples from the 1000 Genomes Project (1000 Genomes Project Consortium, 2010), which is done in 12 CPU hours with 110 MB memory. Figure 2 compares the quality of the call sets with and without BAQ applied. Note that for human, the transition/transversion ratio (ts/tv) is above 2, while ts/tv of random errors is 0.5. Thus, a worse call set tends to have a lower ts/tv. The much higher ts/tv with BAQ applied indicates that BAQ has effectively suppressed many false SNPs.
Fig. 2.
Transition–transversion ratio (ts/tv) as a function of the number of SNP calls. SNPs are sorted by the posterior probability of the site being a SNP (SNP probability). Given a threshold on the SNP probability, the number of SNPs of higher probability and their ts/tv are plotted. For the solid line, filters in use are as follows: (i) total depth below 500; and (ii) root mean square mapping quality above 10; (iii) P-value of reference and non-reference bases being evenly distributed on both strands is above 10−4 (by exact test).
In conclusion, BAQ successfully resolves false SNPs caused by misalignment and improves the accuracy of SNP discovery. In addition to base quality and mapping quality (Li and Homer, 2010), BAQ is another useful statistic towards accurate SNP calling.
ACKNOWLEDGEMENTS
I am grateful to Gabor Marth and Hyun Min Kang whose works have inspired me to develop BAQ, to the 1000 Genomes Project analysis subgroup for the helpful discussions and to the three reviewers whose comments have helped me to improve the manuscript.
Funding: NIH 1000 Genomes Project (grant 1U01HG005208-01).
Conflict of Interest: none declared.
REFERENCES
- 1000 Genomes Project Consortium. A map of human genome variation from population-scale sequencing. Nature. 2010;467:1061–1073. doi: 10.1038/nature09534. [DOI] [PMC free article] [PubMed] [Google Scholar]
- Durbin R., et al. Biological Sequence Analysis: Probabilistic Models of Proteins and Nucleic Acids. Cambridge, UK: Cambridge University Press; 1998. [Google Scholar]
- Li H., et al. The Sequence Alignment/Map format and SAMtools. Bioinformatics. 2009;25:2078–2079. doi: 10.1093/bioinformatics/btp352. [DOI] [PMC free article] [PubMed] [Google Scholar]
- Li H., Homer N. A survey of sequence alignment algorithms for next-generation sequencing. Brief Bioinform. 2010;11:473–83. doi: 10.1093/bib/bbq015. [DOI] [PMC free article] [PubMed] [Google Scholar]


