

Abstract
We investigated how engineered gradients of exogenous growth factors, immobilized to an extracellular matrix material, influence collective guidance of stem cell populations over extended time (>1 day) and length (>1 mm) scales in vitro. Patterns of low-to-high, high-to-low, and uniform concentrations of heparin-binding epidermal growth factor-like growth factor were inkjet printed at precise locations on fibrin substrates. Proliferation and migration responses of mesenchymal stem cells seeded at pattern origins were observed with time-lapse video microscopy and analyzed using both manual and automated computer vision-based cell tracking techniques. Based on results of established chemotaxis studies, we expected that the low-to-high gradient would most effectively direct cell guidance away from the cell source. All printed patterns, however, were found to direct net collective cell guidance with comparable responses. Our analysis revealed that collective “cell diffusion” down a cell-to-cell confinement gradient originating at the cell starting lines and not the net sum of directed individual cell migration up a growth factor concentration gradient is the principal driving force for directing mesenchymal stem cell population outgrowth from a cell source. These results suggest that simple uniform distributions of growth factors immobilized to an extracellular matrix material may be as effective in directing cell migration into a wound site as more complex patterns with concentration gradients.
1. Introduction
Growth factor directed cell migration is typically thought of as solitary cells responding to soluble chemotactic cues. However, in multicellular organisms, many cell types, especially those associated with tissue formation and repair, do not migrate as discrete cells but migrate as cell populations over physiologically relevant time and length scales. It is therefore likely that directed cell population migration represents a dynamic interaction between individual cell migrational responses to chemical cues and collective guidance cues from surrounding cell neighbors. Collective guidance has most commonly been reported for cell populations exhibiting significant cell-to-cell adhesiveness whereby cell populations tend to migrate as continuous cell sheets as exemplified by epithelial cell populations [1], however, similar collective cell migration can also be observed for less cohesive cell types [2], including fibroblasts [3]. Investigating directed cell population migration is important not only for gaining a better understanding of tissue development and tissue repair, but also for tissue engineering applications such as those targeting maximization of stem cell ingrowth from a wound site source into tissue engineered constructs, with length scales ranging from sub-millimeter to centimeters, over timescales ranging from days to weeks.
In general, migrational forces that guide collective cell populations away from a cell source arise from neighboring cell-to-cell interdependences, including cohesiveness, paracrine communication, and confinement pressure. Confinement of cells in close proximity to neighboring cells or other confining boundaries results in “pressure” mediated signaling events that confine or reduce both cell motility and proliferation [1–9]. When confinement is released, confinement gradients form emanating away from the original cell source. Cells are then capable of expanding down the confinement gradient toward areas of less confinement; this phenomenon can also be thought of as cell diffusion [8, 10, 11]. This outward expansion is maintained by cell proliferation occurring within areas of reduced cell neighbor contact inhibition due to the “empty” spaces left by the outward migrating cells, thus replenishing the cell source and in turn acting to maintain the confinement gradient. However, the relative contributions of chemotactic or haptotactic gradients of growth factors to direct individual cell migration within such cell populations or to spatially control cell proliferation within the migrating cell population remains to be elucidated.
The typical view of growth factor concentration gradients is that they exist in the liquid-phase. Consequently, the majority of the studies investigating the role of concentration gradients on cell behavior in vitro have focused on experimenting with diffusion gradients and chemotaxis [12]. These experiments are typically performed over a period of several hours and cell migration occurs over distances between 6 μm to 150 μm [13, 14]. More recent investigations in developmental biology have demonstrated that, in addition to liquid-phase diffusion gradients [15–17], immobilized growth factor concentration gradients also occur in nature [18, 19]. Immobilized growth factors are sequestered to the extracellular matrix (ECM) or directly to the cell surface via specific binding moieties or through intermediary molecules [20]. The limited time and length scales used in typical chemotaxis experiments, as well as methods of delivery of the growth factors, do not begin to adequately represent what might occur in vivo. Therefore, additional in vitro models are needed in which the experimental variables are more reflective of the in vivo environment.
We previously developed and reported on an inkjet-based bioprinting methodology for creating immobilized concentration-modulated growth factor patterns for in vitro experimentation [21–25], which are also directly translatable to in vivo applications using physiologically relevant doses of growth factor [26]. Our method uses native growth factors printed on native ECMs to achieve growth factor immobilization via native binding affinities, thus not requiring chemical modifications to the growth factor or substrates.
In our prior studies we focused on seeding cells over entire patterns and studying cell behavioral responses to patterns with uniform concentrations or concentration gradients of fibroblast growth factor-2 (FGF-2) [21, 23] and uniform concentrations of bone morphogenetic protein-2 [25]. The purpose of the work reported here was to utilize this patterning methodology to systematically investigate if immobilized concentration gradients of heparin-binding epidermal growth factor-like growth factor (HB-EGF) printed on fibrin ECM substrates direct stem cell population migration, where a starting line, or the initial cell population front, was first established at the pattern origins to simultaneously initiate cell diffusion. Patterns of low-to-high, high-to-low, and uniform concentrations of HB-EGF were printed adjacent to one another on the same ECM substrate to reduce inter-experimental variability in comparison to using individual experiments for each separate pattern. The experiments were performed over extended time (>1 day) and length (> 1 mm) scales. HB-EGF was selected as the model growth factor because of its role in directing the proliferation and migration of mesenchymal stem cells [27], its importance during wound healing [28], and its compatibility with our bioprinting methodology [21, 23]. Fibrin was selected as our printing substrate based on its role as a primary wound healing ECM, its binding capacity for numerous growth factors, and its compatibility with our printing system [22]. Cell behavior in register to patterns was observed with time-lapse video microscopy. After acquiring the time-lapse movies, the data were analyzed for cell motion and proliferation using a combination of manual and automated image processing analysis.
2. Materials and methods
2.1. Fibrin substrates
Corning 0211 #1.5 sheet glass (Corning Inc., Corning, NY) was scribe cut into 18 mm squares with tolerances of +0.0/−0.1 mm along each side (glass cutting performed by Precision Glass & Optics in Santa Ana, CA). The coverslips were then coated with fibrin using a previously described method [21].
2.2. Growth factor patterning
Patterns were printed with our custom inkjet-based bioprinting system [21] using a 20 μm diameter orifice drop-on-demand piezoelectric inkjet printhead (MicroFab Technologies, Inc. Plano, TX). The bioink used for all cell experiments consisted of 100 μg/ml HB-EGF (R&D Systems, Minneapolis, MN) diluted in 10 mM sodium phosphate, pH 7.4. The surface concentration of growth factor was modulated using an overprinting strategy described previously [21, 23]. The coverslips were then rinsed three times with PBS to remove unbound growth factor and stored in serum-free Base DMEM with 1% penicillin/streptomycin (PS) (Invitrogen, Carlsbad, CA) in a standard cell culture incubator (37°C, 5% CO2).
To verify that the patterns were retained on the fibrin substrates when placed in culture, experiments were also performed using an ink consisting of 300 μg/ml HB-EGF labeled with cyanine5 dye described previously [21, 23]. After printing, the Cy5-HB-EGF patterns were rinsed 3 times with PBS, stored in PBS for 3 days, and imaged using a Zeiss Axioplan 2 epifluorescence microscope with a Fluor 2.5×, 0.12 NA objective, AxioCam MRm CCD camera, and AxioVision acquisition software v. 4.3 (all microscope components from Carl Zeiss, Inc., Thornwood, NY).
The printed pattern used for these experiments is depicted in Fig. 1. Accurate placement of the patterns on the coverslips is critical to be able to form precise and reproducible cell starting lines which were established using a custom cell culture fixture described below. Therefore, computer vision-based targeting calibration of the jetting process was used so that the lower left corner of the first pattern was printed at a precise distance from the lower left corner of the printing substrate [29]. Groups of three patterns were printed on the fibrin-coated coverslips (from left to right): a uniform concentration pattern (13 overprints), a low-to-high concentration gradient (1 to 25 overprints), and a high-to-low gradient (25 to 1 overprints). A neighboring unprinted region left of the uniform pattern served as the unprinted control. The dimensions of the patterns and the drop spacing used for printing are shown in Fig. 1A. The spot size of the dried drops on the fibrin surface was between 50 and 60 μm in diameter. An area to the left of the uniform concentration pattern, where there was no growth factor printing, served as the control.
Fig. 1.
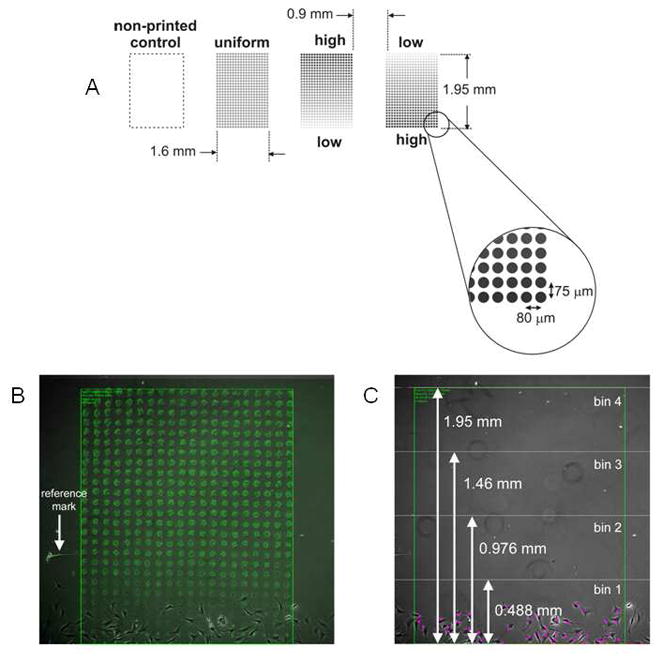
A. Printing layout on fibrin-coated glass coverslip for cell front experiments. The starting point for printing was determined using computer vision registration (see text for details). Figure not drawn to scale. Printed splats for uniform printed patterns contained 13 overprints. Low-to-high patterns ranged from 1 to 25 overprints. High to low ranged from 25 to 1 overprints. Light grey splats represent 1 overprint while black splats represent 25 overprints, with grey to black transition reflecting the direction of the printed gradient. Patterns were printed on an 18 × 18 mm coverslip. B. Image of the cell starting line in contact with the pattern. The patterns were printed so that a small portion of the pattern was exposed when the divider was positioned. The location of the printed pattern was determined in the cell image by overlaying the dried pattern image and using the reference marks scratched in the glass as reference points. C. For the bin analysis, after aligning the pattern image and the cell image, the pattern was divided into 4 bins of equal area. The cell count in each bin was determined every 24 hours for the duration of the time-lapse experiment.
After printing, reference marks were manually etched around each pattern and also in the upper left corner of the substrate using a diamond scribe, and then images of the dried patterns with the reference marks were obtained. The reference marks were used to register the patterns with the cell culture image sequences by overlaying the dried pattern image on top of the cell culture image and then aligning the scribed reference marks in both images by translating and rotating the pattern image.
2.3. Surface concentration and persistence of HB-EGF
To quantify the binding and desorption of growth factor from the fibrin surface, experiments were also performed with HB-EGF iodinated (125I-HB-EGF) using a chloramine T method [30]. The concentrations of the 125I-HB-EGF were selected so that the surface concentrations prepared using the blotting would be comparable to what was printed. A serial dilution of unlabeled growth factor was prepared and the same amount of 125I-HB-EGF was added to each unlabeled growth factor dilution. Fibrin-coated slides were patterned by placing 1 μl of the prepared bio-ink on the substrate and allowing it to dry. After determining the quantity of 125I-HB-EGF applied to each slide using a Cobra II auto-gamma counter (Perkin-Elmer, Wellesley, MA), the slides were rinsed three times in PBS and the amount of retained 125I-HB-EGF was determined again. The slides were then placed in serum free MEM-alpha medium with 25 mM HEPES, 0.02% sodium azide, and 1% penicillin/streptomycin (PS) (all media components from Invitrogen, Carlsbad, CA) and stored at 37°C for 24 hours. The radioactive counts were determined again and the serum-free medium was replaced with medium containing 0.2% calf serum, which was the serum concentration used in all of the cell culture experiments. Radioactive counts were acquired and the medium was replaced every 24 hours. All retention and surface concentration calculations assumed that the unlabeled HB-EGF was retained on the fibrin surface in the same manner as the 125I-HB-EGF and all acquired data was corrected to account for radioactive decay.
2.4. Cell culture and experimental setup
After rinsing and incubating the patterns for approximately 48 hours in serum-free media, the patterns were seeded with C3H10T1/2 mouse mesenchymal stem cells (clone 8) obtained from ATCC (American Type Culture Collection, Manassas, VA) and cultured in Base DMEM with 10% calf serum (CS) and 1% PS (Invitrogen, Carlsbad, CA). For the migration experiments, the cells were cultured in media containing 0.2% CS, 1% PS, and 1 μg/ml aprotinin. The cell starting lines were created using a custom stainless-steel fixture which located and held the patterned coverslip in place while an additional coverslip, perpendicular to the patterned coverslip, separated the patterned slide into two chambers; one side to retain the cells at the origin of the patterns while the cells attached and the other side for media without cells. The cell origin purposely overlapped the first part of the printed patterns so that seeded cells had initial pattern contact (Fig 1B). Cells were applied as 0.5 ml of a 25,000 cells/ml suspension in serum free media on the starting line side of the chamber. The cell suspension was pipetted up and down several times and the fixture carefully shaken from side-to-side to create as uniform a cell seeding as possible. After allowing the cells to settle for approximately 5 minutes, the fixtures were put into a glass container and placed in a standard cell culture incubator (37°C, 5% CO2) for 1.5 hours to allow the cells to attach. After the cells had attached to the coverslip, the fixture was disassembled and the patterned coverslip was removed, rinsed with serum-free Base DMEM, and secured to the bottom of a 35 mm Petri dish with sterile silicone grease. The dish was filled with 4 ml of media containing 0.2% CS, 1% PS, and 1 μg/ml aprotinin and imaged using time-lapse microscopy.
2.5. Time-lapse imaging and cell response quantification
Images of the cell responses to the patterns were obtained using a time-lapse imaging system which consists of a custom microscope stage incubator [23] modified to hold 4 separate 35 mm Petri dishes. The incubator was mounted on a Zeiss 135TV Axiovert microscope equipped with a Retiga EXi Fast 1394 12-bit CCD camera (Qimaging Corp., Surrey, BC, Canada) and a 5×, 0.15 NA phase I objective with phase optics (Carl Zeiss, Inc., Thornwood, NY). A 0.63× adapter (Diagnostic Instruments, Inc., Sterling Heights, MI) was used to mount the camera on the microscope and QED InVitro software (version 3.2.0, Media Cybernetics Inc., Bethesda, MD) was used to acquire the images. The locations of the patterns and control fields were logged, and images were acquired every 5 minutes for up to 5 days.
After acquiring the time-lapse movies of the cell responses to the patterns, the position and rotation of the growth factor pattern in the field-of-view was determined using the reference marks, and the image stacks were then processed and analyzed over time using both manual and automated methods. For each field, image stacks of the cell response every 24 hours were created using ImageJ software (v. 1.32j, National Institutes of Health) [31]. The location of the pattern in the image was determined using the etched reference mark (Fig. 1B), and the pattern area was divided into four bins of equal automated analysis. Manual analysis was performed to cell determine the number on the patterns area (Fig. 1C). The cells in each bin were then counted manually using ImageJ. The mitotic events in each of the bins throughout the course of the time-lapse video were also detected manually using a similar protocol. Automated cell tracking on the patterns was performed using our computer vision-based cell tracking system [32–34]. After tracking all of the cells in each of the image fields, the average velocity vector for all of the cells on the pattern throughout the course of the time-lapse video was determined.
For statistical comparisons, cell number and mitosis event data were subjected to ANOVA and post-hoc protected Fisher’s least significant difference test (Systat Statistical Software, Systat, San Jose, CA). Statistical significance was generally set p ≤ 0.05. All data used for analysis represented a minimum of 4 separate time-lapse experiments. For each experiment, printed patterns and the non-printed control, occurred as neighbors on the same substrate to reduce experimental error and to maximize imaging efficiency.
3. Results
3.1 HB-EGF patterning and retention
To verify the accuracy of the printing and to validate that the printed patterns maintained their shape when placed in culture, fluorescently-labeled HB-EGF patterns were printed. Examples of a printed uniform and gradient pattern are shown in Fig. 2A and 2B, where the images were acquired after 3 rinses in PBS followed by incubation in PBS for 3 days. The shapes of the patterns were maintained as indicated by the plots in Fig. 2C and 2D, which show the average pixel value of the dried drops in each column along the length of the patterns.
Fig. 2.
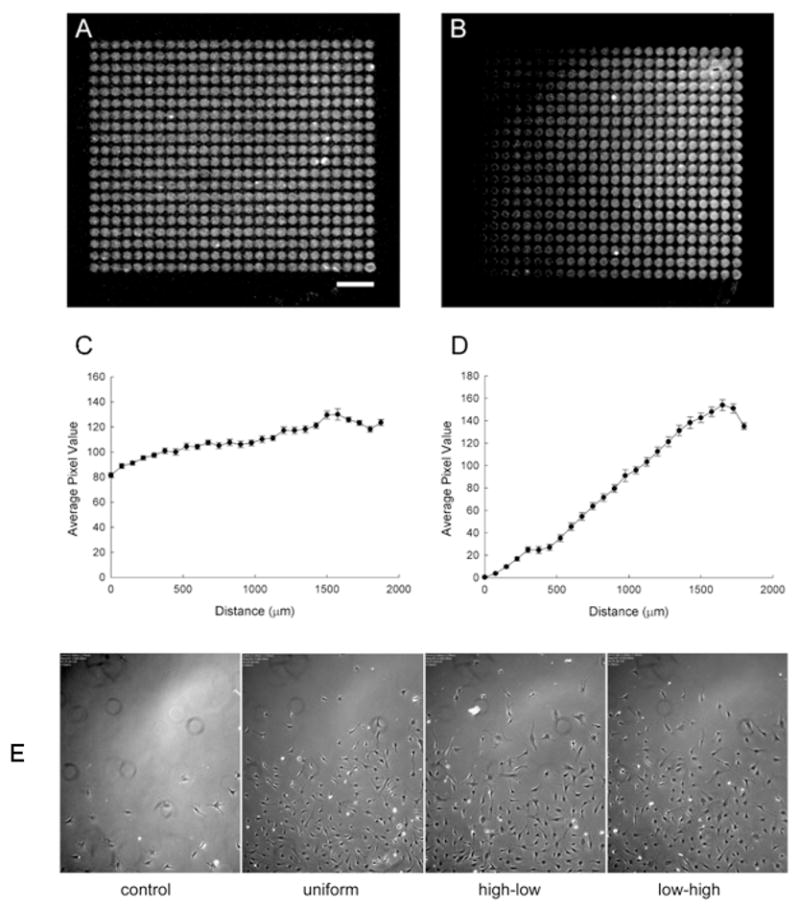
Validation of pattern accuracy and cell front responses to printed patterns. Patterns of Cy5-HB-EGF were printed on fibrin coated substrates and imaged after extensive rinsing of the patterns. A. Uniform pattern. B. Concentration gradient pattern. The average pixel value of the drops in each column along the length of the patterns was determined from the fluorescence images. C. Plot of uniform pattern. D. Plot of concentration gradient. Each data point represents mean ± SEM of the 20 drops in each column along the length of the patterns. The scale bar in A represents 250 μm and applies to B as well. E. C3H10T1/2 cells were seeded at the origin of the patterns and imaged over time. The images shown in are after 4 days in culture for control with no printed pattern, uniform pattern (13 overprints), high-to-low gradient (25 to 1 overprints) and low-to-high gradient (1 to 25 overprints).
The results of the radiolabeling experiments further demonstrate the persistence of the HB-EGF on the fibrin substrates (Fig 3). Approximately, 1% of the initial applied HB-EGF was retained on the fibrin following rinse steps prior to adding cells, however, this remaining HB-EGF was sufficient to direct both cell migration and proliferation. HB-EGF patterns persisted throughout the cell experimental period representing an average of ~3% HB-EGF desorption per day for a total of 12% desorption.
Fig. 3.

Adsorption residence profile of HB-EGF on fibrin substrates. Four different surface concentrations of HB-GF were initially applied to each substrate. 153,000 ± 5160 pg/mm2 (●); 20,000 ± 612 pg/mm2 (■); 2,890 ± 82 pg/mm2 (▲); 491 ± 13 pg/mm2 (not shown). Time zero represents the HB-EGF surface concentration after 3 PBS rinses. Time 24 hr represents surface concentration after an additional 24 hr PBS rinse period (This is the timepoint in which cells would be added to printed patterns and represent time zero of a cell experiment).
3.2. C3H10T1/2 response to printed patterns
Representative images of the cell response to the printed patterns, as well as to the control field with no pattern after 4 days in culture, are shown in Fig. 2E. The initial cell number at the starting line within bin 1, on patterned fields, was 12 ± 2 cells. In the control field, the cell front movement is minimal and the resulting cell density in the field is low. In contrast, the cell fronts on the uniform, high-to-low, and low-to-high patterns moved out significantly. At first glance each of the pattern responses appeared to be very similar. Therefore, metrics were derived to determine if there was a difference in the cellular response to the different spatial distributions of growth factor.
3.3. Manual analysis of cell population movement in response to printed patterns
Bin analysis was used to quantify the cell number on the patterns over time (Fig. 1C). Bin 1 was designated as the bin closest to the cell starting line and bin 4 was at the opposite end of the pattern. The experiments that were used for analysis were required to have 10 ± 6 cells in bin 1 at the start of the experiment. The results of the bin analysis for the C3H10T1/2 cells on the HB-EGF patterns and control field at 0, 48 and 96 hours after the start of the experiment are shown in Fig. 4. Each plot represents a different time point and the different pattern types are grouped together by bin number. There was no difference in cell numbers in bin 1 (i.e., the bin at the “starting line”) at initiation of migration experiments (0 hours) for all printed patterns and the non-printed control, as shown in Fig. 4A (Fisher’s F test, p = 0.675). An occasional cell was observed in bins 2 and 4 at the start of the experiment but this had no adverse effect on the experimental results.
Fig. 4.

Manual Analysis of cell responses to HB-EGF patterns. Graphs A–C represent a different timepoint in the experiment with the bins of the different treatments grouped together. HB-EGF patterns with A. 0 hrs, B. 48 hrs, C. 96 hrs. Each bar represents mean ± SEM of at least three different experiments. D. Manual mitotic event detection on printed patterns. Total number of mitotic events which occurred in each bin over a 5 day period. Each bar represents mean ± SEM of at least three different experiments.
The cell numbers in the HB-EGF printed pattern bins began to increase relative to cell numbers in unprinted control bins post-initiation of the experiment, with the level of significance dependent upon pattern and time point. The cell distributions, particularly in bin 1 and to a lesser part in bin 2, reflected the surface concentration of HB-EGF on each of the respective patterns at both 48 and 96 hours as seen in Fig. 4B and 4C, respectively.
At 48 hours and in comparison to cells on the unprinted control region, in bin 1 (Fig. 4B) there were significantly more cells on the high-to-low gradient (p=0.02), a trend for more cells on the uniform pattern (p=0.062), and no difference on the low-to-high gradient (p=0.365). However, there were no statistically significant differences between cell numbers on printed patterns. At the same time point in bin 2, there were significantly more cells on the high-to-low gradient (p=0.009) than on the control, and cell numbers on the uniform (p=0.101) and low-to-high (p=0.075) patterns became greater than on control. Again, there were no statistically significant differences between cell numbers on printed patterns. The responses for cells on patterns in bin 3 were similar to cell responses on patterns in bin 1. More cells were present in bin 3 for high-to-low compared to control (p=0.024).
At 96 hours (Fig. 4C), the responses on pattern were similar to those at 48 hours. However, cell numbers in bin 1 for both the high-to-low gradient and uniform patterns were significantly different from control (p=0.003, p=0.028, respectively), and the low-to-high pattern cell numbers continued their trend toward a significant difference from control (p=0.177). For bin 2, the cell numbers in the high-to-low, uniform and low-to-high patterns were different from control at p=0.002, p=0.02 and p=0.041, respectively. Similar results occurred for bin 3 where cell numbers on high-to-low, uniform and low-to-high patterns were different from control at p=0.064, p=0.086 and p=0.192, respectively. The high-to-low gradient pattern had a greater number of cells in bin 1 compared to the low-to-high gradient (p=0.049) pattern, but cell numbers were not different from the uniform (p=0.28) pattern. There was no difference in cell numbers between printed patterns in bin 2 or 3.
In bin 4 at 96 hours, there were a small number of cells on all patterns compared to no cells on the unprinted control. However, there were not sufficient numbers to perform a statistical analysis. This result was expected since the cells were cultured in a serum-deprived state and bin 4 was almost 1.5 mm away from the cell source. It was not clear from this bin analysis if there was a difference in cell movement behavior on the three different patterns. Based on the bin analysis alone, all three of the printed patterns tended to direct cell populations away from the initial cell population source compared to the non-printed control group.
To determine the role of cell proliferation in these experiments, the mitotic events in each of the bins was manually detected both on and off of the growth factor patterns over the total 96 hour experimental period. The differences in mitotic events on and off pattern, as shown in Fig. 4D, mirrored the differences in cell numbers shown in Fig. 4C. For bin 1, the mitotic events on the uniform, high-to-low gradient, and low-to-high gradient patterns were different from the control pattern at p=0.019, p=0.001, and p=0.152, respectively. The high-to-low gradient was different from low-to-high (p=0.024). For bin 2, uniform, high-to-low gradient, and low-to-high gradient patterns were different from control pattern at p=0.034, p=0.009, and p=0.15, respectively. There were no statistically significant differences between mitotic events on printed patterns. No cell mitosis occurred on control patterns in either bin 3 or 4. However, the relatively small number and variability between experiments for the printed patterns was such that mitosis on printed patterns was not different from unprinted control patterns. Both the cell division events as well as the cell number distribution corresponded to the surface concentration of HB-EGF on the printed patterns. These observations correspond to our previous results with FGF-2 and osteosarcoma cells [23] and with HB-EGF (data not shown), where dose-dependent proliferation in register with the applied surface concentration of growth factor occurs.
3.4. Automated analysis of cell population movement in response to printed patterns
The bin analysis could not be used to determine if there was a difference in the collective motion of the cells on each of the patterns. Due to the extended time length of the image sequences and the large number of cells in each image, a computer vision-based cell tracking method was used to help analyze the individual cell behaviors of all of the cells on the patterns or in the control field during the first 3 days of culture.
Automated cell tracking results are depicted for a representative experiment in Fig. 5A in which the cells and their migration trajectories over 72 hrs were plotted in different colors. Also shown for each pattern is the 90% cell migration front, which is defined by 90% of the total cell population being behind this line. Cells were also observed to migrate from spot-to-spot of printed HG-EGF as evidenced by the cell tracks. To visualize the general distribution of migration directions of the cell populations on patterns, the cell migration trajectories over 72 hrs per field were registered such that all ancestor cells (i.e. mother cells that have no recorded parent) start from a common origin as shown in Figure 5B. The trajectory of each cell was color-coded to indicate the instantaneous migration direction of the cell at each time point. Green indicates upward motion, i.e., moving perpendicularly away from the cell starting line at the bottom of the field, while magenta, orange, and blue indicate downward, leftward, and rightward motions, respectively. As the color codes indicate, the cells in all fields exhibited a general trend to migrate up-pattern as more trajectory segments appeared green, while the trajectories in the control fields were visibly more dispersed than those on growth factor patterns as indicated by the more diversified color distributions.
Fig. 5.

Automated assessment of cell migration trajectories on patterns. A. C3H101/2 cell migration trajectories after 72 hours for a representative experiment. Different colors represent different cell lineages. The colored dots represent the current cell centroids. The trailing curves represent trajectories of the corresponding cells. The cell trajectories fade out gradually over time. B. Migration trajectories on each pattern such that all cells have no recorded parent start from the common origin at the center of the image. The trajectory of each cell was color-coded to indicate the instantaneous migration direction of the cell at each time point. The interpretation of the color designations are displayed in the color dial on the bottom-left corner of each image. C and D. Automated assessment of cell migration front position and population expansion rates over time on entire patterns. C. The 90% cell migration front positions over time. D. The relative cell population expansion (the ratio between the current cell count and the initial cell count) over time. Individual lines represent the mean of three separate experiments for each pattern.
The relative positions of the cell migration fronts over 72 hrs in response to printed patterns and non-printed control are presented in Fig. 5C. Overall, the migration front advancements were relatively small and the resulting cell densities were relatively low within the control groups. The migration front for printed patterns moved out similarly, regardless of pattern type. Because C3CH101/2 cells exhibited a non-cell sheet behavior, cell count changes over time on patterns were determined (Fig. 5D). Cell population expansion rates were estimated by dividing the measured cell counts over time by the initial cell count for each pattern and plotting the results. In general the cell count changes were low on the control patterns with 3 times the initial cell count. In contrast, the cell counts were 7.9, 8.2 and 7.3 times the initial values on the uniform, high-to-low and low-to-high gradient patterns, respectively.
To analyze the directional migration response of cells to a pattern, the distribution of instantaneous cell migration directions in each of the four bins on each type of pattern over 72 hours was summarized using an angular histogram (rose plot diagram) shown in Fig. 6. Also shown in each plot is a unit vector indicating the mean migration direction for the corresponding cell response, as well as two dashed lines that indicate the range of one circular standard deviation [35, 36] on each side of the mean direction. The distributions of migration directions in all bins on all printed patterns or unprinted control patterns failed both the Rayleigh and Hodges-Ajne circular uniformity tests [35, 36], indicating there were preferred migration directions in all bins. The migration directions in bin 1–3 in the control field are presented. No data were available in bin 4 on any of the control patterns since no cells reached bin 4. The directions in bin 1–4 are presented for the 3 printed patterns. From the rose diagrams it is evident that cell migration directions generally became more and more concentrated toward 90° in bins 1–3. In bin 4, the directions became spread-out on the high-to-low gradient, where the cells were observed to start moving back toward the opposite direction.
Fig. 6.

Rose plot diagrams of instantaneous cell migration directions in four bins on different printed HB-EGF and non-printed control patterns. Bin 1 is closest to the cell source and Bin 4 farthest away. The black arrow in individual diagrams indicates the mean migration direction. The dashed lines indicate the range of one circular standard deviation on each side of the mean direction.
We evaluated differences between maximum cell migration distances over entire patterns by comparing the distance distributions of single cells for each pattern as well as the distance distributions of collective cell lineages. As illustrated in Fig. 7 the single cell maximum up-pattern migration distance, d, is defined as the maximum unsigned difference between the y-coordinate of the migration origin and y-coordinates of all points along the migration path of a cell. This is represents the maximum vertical distance (along the direction of the gradient) a cell has traveled during the course of its migration. For each cell lineage tree [32], the cell lineage maximum up-pattern migration distance, D, was computed as defined by the maximum unsigned difference between the y-coordinate of the migration origin of the ancestor cell and the y-coordinates of all points along the migration paths of all its’ progeny along their migration paths.
Fig. 7.
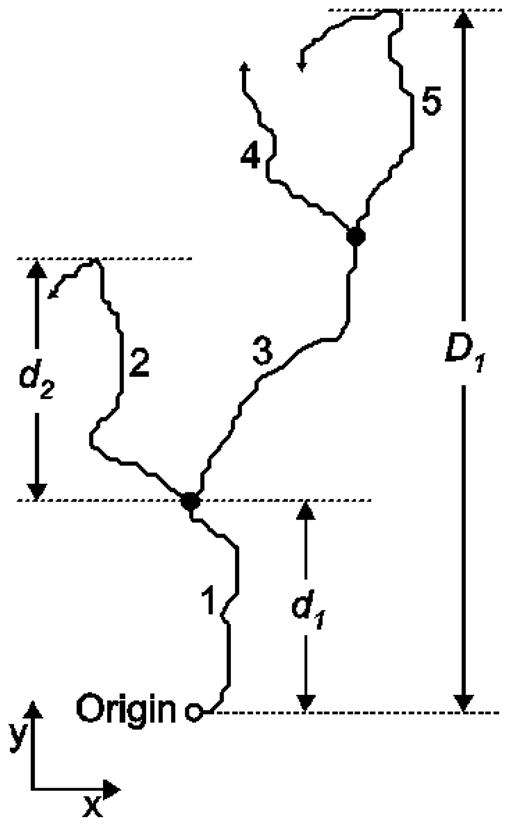
Definitions of the single cell maximum up-pattern migration distance and the cell lineage maximum up-pattern migration distance. Single cell maximum up-pattern migration distance for cell 1 and cell 2 are represented by d1 and d2, respectively. D1 represents the cell lineage maximum up-pattern migration distance for cell 1 and its progeny.
The measured maximum up-pattern migration distances of the cell populations are summarized in Table 1. Although there was an overall trend for single cell maximum up-pattern migration distance (d) to increase in the order of unprinted, uniform, high-to-low, to low-to-high, only low-to-high patterns resulted in significantly different maximum up-pattern migration distances. This trend continued when up-pattern cell lineage maximum migration distances (D) were considered. However, D on both gradient patterns was significantly longer than on the unprinted control. There were no differences between gradient patterns, regardless of track type evaluated. And, uniform patterns were not different from gradient patterns for D.
Table 1.
Maximum up-pattern (away from cell source) migration tracked distance on different HB-EGF patterns.
| Track Type (μm) | Unprinted Control | Uniform Pattern | Hi-Lo Gradient | Lo-Hi Gradient |
|---|---|---|---|---|
| Single Cell Maximum (d) | 206 ± 15a | 217 ± 10a | 234 ± 8ab | 254 ± 10b |
| (N) | 272 | 489 | 910 | 730 |
| Cell Lineage Maximum (D) | 251 ± 19a | 327 ± 22ab | 387 ± 13b | 385 ± 20b |
| (N) | 205 | 259 | 443 | 395 |
Values reported are mean ± SEM. N is number of observations per group. Within a distance type, values with differing superscript letters are significantly different p<0.05 (ANOVA with Tukey’s posthoc).
In addition to migration distance, cell migration velocities on patterns were determined. Similar to single cell migrations in Table 2, there was an overall trend for increasing velocity up pattern, vy, in the order of unprinted, uniform, high-to-low, to low-to-high. The overall speed (vx2+vy2)0.5, was not meaningfully different between patterns; from unprinted, uniform, high-to-low, to low-to-high patterns.
Table 2.
Statistics of C3H10T1/2 migration velocities on different HB-EGF patterns.
| Distance type (μm/hr) | Control | Uniform | High-low | Low-high |
|---|---|---|---|---|
| Vx | 0.126 ± 0.061a | 0.604 ± 0.044b | −0.737 ± 0.032c | 0.053 ± 0.034d |
| Vy | 5.732 ± 0.058a | 7.095 ± 0.051b | 7.357 ± 0.036c | 3.303 ± 0.037d |
| Speed | 20.318 ± 0.047a | 21.516 ± 0.039ab | 21.639 ± 0.027b | 20.94S ± 0.030ab |
Values reported are mean ± SEM. N were 93,000 observations per group. Within a distance type, values with differing superscript letters are significantly different p<0.05 (ANOVA with Tukey’s posthoc).
Similar to manual assessments, cell migration responses to patterns were also divided among bins (data not shown). The results indicated no marked changes in migration speed between patterns. Cell migration for all patterns appeared to increase between bin 1 and 2, likely representing loss of cell confinement pressure as cells moved outward from the cell source. Cells in Bin 4 for printed patterns appeared to decelerate. This may reflect a critical threshold of cell neighbor interactions.
4. Discussion
The work reported here demonstrates that forces responsible for HB-EGF directed stem cell population migration away from a cell source in vitro are: 1) immobilized spatial patterns of HB-EGF providing persistent directional cues for cell migration and cell proliferation signals; and 2) cell diffusion forces emanating away from the cell source that are maintained by HB-EGF stimulated cell proliferation. Importantly, it is cell diffusion maintained by HB-EGF and not directional migration gradients of HB-EGF that acts as the principle force directing cell population migration. This observation is in contrast to what has been reported previously for non-stem cells exposed to liquid-phase or solid-phase gradients of various signaling molecules over shorter time and length scales. Extensive evidence exists that demonstrates chemotactic gradients of a variety of growth factors direct the migration of numerous cell types in vitro [37–43]. The ability to control stem cell migration is of particular interest in tissue engineering where one goal is to deliver growth factors in scaffolds to direct endogenous stem cell movement into the wound site to restore the structure and function of damaged tissues [44]. However, liquid-phase growth factor delivery options for in vivo applications have been limited by issues related to controlling persistence and dosage. Creating immobilized growth factor patterns addresses some of the limitations of liquid-phase delivery [45]. Since immobilized growth factors are not continually cleared from the wound site, lower doses of growth factor can be used. And, unlike liquid-phase gradients that are transient, immobilized gradients retain their shape over time, which can provide a constant driving force to direct cellular ingrowth. While gradients of both liquid-phase and immobilized growth factors have been shown to occur in nature [18, 19], little work has been performed to determine how cells respond to immobilized growth factor patterns. Our bioprinting methodology provides one approach to investigate how cells respond to immobilized growth factor patterns.
The focus of this study was to investigate C3H10T1/2 mesenchymal stem cell population migration away from a cell source in response to a variety of immobilized spatial patterns of HB-EGF. Using bin analysis to quantify cell distributions on patterns over time, a clear overall difference in cell distributions occurred between the printed HB-EGF patterns and the unprinted control field with no growth factor. For all printed patterns, cells were observed to be in the bins further away from the cell source (bins 3 and 4) than in the control field, and cell numbers in bins 3 and 4 were similar at the end of each experiment (Fig. 4C). However, our expectation at the start of this study was that a low-to-high gradient would significantly enhance cell migration in comparison with the other patterns. This hypothesis was motivated by traditional chemotaxis experimentation where Boyden chamber assays were used to demonstrate that low-to-high liquid-phase gradients of HB-EGF and other growth factors enhance migration of human and rabbit bone marrow-derived mesenchymal stem cells [40]. However, our experimental outcomes were dramatically different from these chemotaxis experiments. Therefore, more in-depth analysis was required to explain our experimental results.
Cell populations are thought to invade a wound site from surrounding viable tissues as a result of a combination of directed cell migration and cell spreading due to proliferation, which lead to complex cell population group dynamics resulting in cell front movement away from the more crowded (physically constrained) expanding cell populations. Furthermore the timescale for these events is on the order of days. Such behavior has been previously described in wound-healing in vitro assays where a mock wound is scraped in a confluent cell monolayer and the resulting closure is dependent on “cell diffusion,” which encompasses cell migration and/or proliferation induced by near neighbor effects [7, 10, 46]. Our non-wounding approach reported here to create a spatially-defined cell source produced results similar to cell population outgrowths/migration observed in the scratch wounding technique, regardless of the pattern that was printed [5].
Therefore, cell behavior on patterns cannot be addressed simply by observing the cell number in each of the bins over time since cell movement can be influenced by the combination of complex interactions between spatially-directed growth factor cues and cell diffusion. One method to separate out the relative contribution of these mechanisms is to inhibit cell proliferation by treatment with mitomycin C (MMC) [47]. We performed experiments with MMC to determine if blocking proliferation would clarify the cellular response to the patterns (data not shown). While the cells still responded to the patterns, the MMC treatment resulted in significant cell death after 48 hours in culture. Consequently, the experiments could not be conducted for 5 days, and a direct comparison between the untreated and MMC-treated cells could not be performed. Prior studies using a wound migration assay approach used MMC to confirm that cell proliferation was not involved in cell population closure of wounds under their experimental conditions [5, 6]. These studies were conducted typically for less than 24 hrs. We similarly found that MMC does not affect cell population outgrowths at these early time points (data not shown), but cell proliferation must be considered for physiologically relevant longer timescales.
Since MMC treatment could not be used to remove proliferation bias, we decided to use a combination of automated computer vision-based cell tracking and manual mitosis detection to further quantify the cellular responses to the patterns. Each and every cell on the printed patterns and the control field were tracked to determine the average velocity vector of all of the cells on the pattern. These results, which are shown in Fig. 5B, demonstrated that the average vector on the low-to-high gradient was both larger and closer to 90° than the other patterns. Although the cells on all of the patterns had a tendency to align along the rows of the printed drops (as indicated using SEM – data not shown), the cell motion on the low-to-high gradient was directed towards the opposite end of the pattern more so than on the other patterns or control field. This result suggests that the cells on the low-to-high gradient were experiencing directed migration. The cells on the high-to-low gradient and uniform patterns, however, may be forced towards the ends of these patterns because of increased cell diffusion due to increased proliferation rates at the cell source as a result of higher surface concentrations of HB-EGF on patterns nearer the cell source. This conclusion is further supported by the results of the mitosis detection (Fig. 5D) which showed a higher number of mitotic events occurring at the origin of the high-to-low gradients and uniform patterns than on the low-to-high gradients.
These results suggest that stem cell population migration away from a cell source represents an interaction between: i. cell diffusion due to a loss of neighbor-to-neighbor physical constraints and cell proliferation associated with a loss of contact inhibition; ii. spatially controlled, proliferative growth factor cues; and, iii. spatially directed growth factor migrational cues. The question remains as to the relative contribution of each of these forces. Focusing on the 96 hour time point, if the average cell and mitosis numbers are independently summed for each bin across all patterns and then converted to percent mitosis events per total number of cells per bin, the results are 83%, 53% and 26% for bin 1, 2 and 3, respectively. This suggests that cell proliferation is the primary driving force for cells in bin 1 and that proliferation may play less of a role away from the cell source. The cells in bins 1 and 2 on the non-printed HB-EGF control indicate an underlying cell diffusion effect since no exogenous growth factor is added beyond what is already in the serum component of the media. The difference between printed patterns and controls in bin 1 is principally due to induction of cell proliferation by printed HB-EGF. As cell populations move out beyond bin 1, directed cell migration may actually play a more critical role.
The different conclusions between the aforementioned chemotaxis studies and our solid-phase patterning approach can now be explained in terms of differences in experimental design and implementation, including: pattern stability over time; length and time scales; growth factor delivery mechanism; pattern resolution; and, controls used. Diffusion gradients created using a finite source, such as with the Boyden chamber approach, are transient and do not persist over time. It was demonstrated in Fig. 2 and Fig. 3, as well as in previous studies [23, 24, 26], that the printed growth factor patterns persist over time, with an estimated total desorption of HB-EGF from patterns for the overall 4 days of cell culture at a rate of ~3% desorption/day for a total of ~12% desorption over the entire cell culture period. Consequently, the cells were sensing persistent growth factor surface concentrations of the printed patterns throughout the duration of the experiment. To address the stability issues of liquid-phase diffusion gradients in the Boyden chamber experiments, microfluidic systems have been developed which can create stable liquid-phase gradients [48, 49]. These systems have been used primarily to investigate how non-tissue forming cells respond to concentration gradients of chemokines and interleukins [48, 50]. Recent studies have demonstrated the use of such microfluidic systems to investigate directed chemotaxis of endothelial cells using vascular endothelial growth factor and/or fibroblast growth factor-2 [4, 49], but the focus of these experiments were primarily individual cell behavior within a gradient field and not cell populations moving out from a physically constrained cell population source. Several approaches, including microfluidics, have been utililized to create immobilized gradient patterns to study cell migration [51–54] and neural axonal outgrowth [55, 56]. However, to our knowledge no one has evaluated directed collective migration of stem cells populations on immobilized growth factor gradient patterns.
Our approach also differs in the manner of growth factor immobilization. In particular, our approach uses natural binding affinity between HB-EGF and fibrin, whereas other approaches require artificial chemical cross-linking strategies [51–53]. One fairly comparable approach was that of Stefonek and Masters [51] who used photoimmobilization to create gradients of EGF on polystyrene plates to study keratinocyte migration. Similar to our approach, they created a cell source and measured directed cell migration along low-to-high gradients over similar time and length scales. However, along with the difference in cell types, these experiments were performed in complete serum-free conditions, and uniform and counter-directional gradient patterns were not examined.
A small number of experimental variables were tested in the current study. Perhaps more dramatic differences between the patterns would be observed if additional pattern variables, growth factor types, combinations of growth factors, or cell types were used. We did conduct preliminary studies with steeper gradient designs; however cell responses (data not shown) showed qualitatively similar results. Other cell types to consider are neutrophils and macrophages, which are the first invaders into a wound site that clean-up the wounded area, followed by invasion of fibroblasts and endothelial cells [57]. Therefore, instead of using growth factor patterns which target tissue-forming cells, tissue engineers might also consider using immobilized patterns of growth factors targeted to direct macrophages into the wound site, which in-turn would direct the endothelial cells and the tissue-forming cells. Thus, a systematic study of additional pattern variables, growth factors, and cell types may be a topic for future studies.
The in vitro results presented here and the in vivo results reported previously by us [26], Schmoekel et al. [58, 59], and Ehrbar et al. [58, 59] demonstrate the effectiveness of immobilized growth factors to influence cell behaviors. And, as opposed to liquid-phase delivery, the solid-phase approach provides spatially and temporally fixed sources of growth factors [22] presented in extremely low dosages.
5. Conclusions
We have demonstrated that the migration of “non-sheet” forming tissue-based stem cells is governed by complex interactions between multiple forces and not by single cell directional growth factor cues alone. Dynamic interactions between cell population diffusion, proliferation and directed migration produce net movement of a stem cell population away from their source. This new knowledge has potential impact for design of next-generation tissue engineered scaffolds that will incorporate spatial patterning of growth factors. Based on the results presented here, a low-to-high concentration gradient of solid-phase HB-EGF may direct the migration of endogenous mesenchymal stem cells into a delivery scaffold. However, these results also suggest that persistent, simple uniform growth factor patterns may be just as effective in directing cell migration as more complex concentration gradient patterns.
Acknowledgments
The authors acknowledge support for their sited research as supported in part by the National Institutes of Health (R01 EB004343 and R01 EB007369), the Pennsylvania Infrastructure Technology Alliance (PITA) from the Pennsylvania Department of Community and Economic Development, the Health Resources and Services Administration (Grant No. 1C76 HF 00381-01), the Scaife Foundation, and the Philip and Marsha Dowd Engineering Seed Fund. The authors declare that they have no competing financial interests.
Footnotes
Competing interests statement. The authors declare that they have no competing financial interests.
Publisher's Disclaimer: This is a PDF file of an unedited manuscript that has been accepted for publication. As a service to our customers we are providing this early version of the manuscript. The manuscript will undergo copyediting, typesetting, and review of the resulting proof before it is published in its final citable form. Please note that during the production process errors may be discovered which could affect the content, and all legal disclaimers that apply to the journal pertain.
References
- 1.Friedl P, Hegerfeldt Y, Tusch M. Collective cell migration in morphogenesis and cancer. Int J Dev Biol. 2004;48:441–9. doi: 10.1387/ijdb.041821pf. [DOI] [PubMed] [Google Scholar]
- 2.Rorth P. Collective guidance of collective cell migration. Trends Cell Biol. 2007;17:575–9. doi: 10.1016/j.tcb.2007.09.007. [DOI] [PubMed] [Google Scholar]
- 3.Bindschadler M, McGrath JL. Sheet migration by wounded monolayers as an emergent property of single-cell dynamics. J Cell Sci. 2007;120:876–84. doi: 10.1242/jcs.03395. [DOI] [PubMed] [Google Scholar]
- 4.Barkefors I, Le Jan S, Jakobsson L, Hejll E, Carlson G, Johansson H, et al. Endothelial cell migration in stable gradients of vascular endothelial growth factor A and fibroblast growth factor 2: effects on chemotaxis and chemokinesis. J Biol Chem. 2008;283:13905–12. doi: 10.1074/jbc.M704917200. [DOI] [PubMed] [Google Scholar]
- 5.Block ER, Matela AR, SundarRaj N, Iszkula ER, Klarlund JK. Wounding induces motility in sheets of corneal epithelial cells through loss of spatial constraints: role of heparin-binding epidermal growth factor-like growth factor signaling. J Biol Chem. 2004;279:24307–12. doi: 10.1074/jbc.M401058200. [DOI] [PubMed] [Google Scholar]
- 6.Farooqui R, Fenteany G. Multiple rows of cells behind an epithelial wound edge extend cryptic lamellipodia to collectively drive cell-sheet movement. J Cell Sci. 2005;118:51–63. doi: 10.1242/jcs.01577. [DOI] [PubMed] [Google Scholar]
- 7.Simpson MJ, Landman KA, Hughes BD, DFN Looking inside an invasion wave of cells using continuum models: proliferation is the key. J Theor Biol. 2006;243:343–60. doi: 10.1016/j.jtbi.2006.06.021. [DOI] [PubMed] [Google Scholar]
- 8.Poujade M, Grasland-Mongrain E, Hertzog A, Jouanneau J, Chavrier P, Ladoux B, et al. Collective migration of an epithelial monolayer in response to a model wound. Proc Natl Acad Sci U S A. 2007;104:15988–93. doi: 10.1073/pnas.0705062104. [DOI] [PMC free article] [PubMed] [Google Scholar]
- 9.Bianco A, Poukkula M, Cliffe A, Mathieu J, Luque CM, Fulga TA, et al. Two distinct modes of guidance signalling during collective migration of border cells. Nature. 2007;448:362–5. doi: 10.1038/nature05965. [DOI] [PubMed] [Google Scholar]
- 10.Maini PK, McElwain DL, Leavesley DI. Traveling wave model to interpret a wound-healing cell migration assay for human peritoneal mesothelial cells. Tissue Eng. 2004;10:475–82. doi: 10.1089/107632704323061834. [DOI] [PubMed] [Google Scholar]
- 11.Gov NS. Collective cell migration patterns: follow the leader. Proc Natl Acad Sci U S A. 2007;104:15970–1. doi: 10.1073/pnas.0708037104. [DOI] [PMC free article] [PubMed] [Google Scholar]
- 12.Boyden S. The chemotactic effect of mixtures of antibody and antigen on polymorphonuclear leucocytes. J Exp Med. 1962;115:453–66. doi: 10.1084/jem.115.3.453. [DOI] [PMC free article] [PubMed] [Google Scholar]
- 13.Gee AP. Advantages and limitations of methods for measuring cellular chemotaxis and chemokinesis. Mol Cell Biochem. 1984;62:5–11. doi: 10.1007/BF00230072. [DOI] [PubMed] [Google Scholar]
- 14.Zigmond SH, Foxman EF, Segall JE. Chemotaxis assays for eukaryotic cells. Curr Protoc Cell Biol. 2001;Chapter 12(Unit 12):1. doi: 10.1002/0471143030.cb1201s00. [DOI] [PubMed] [Google Scholar]
- 15.Lawrence PA, Struhl G. Morphogens, compartments, and pattern: lessons from drosophila? Cell. 1996;85:951–61. doi: 10.1016/s0092-8674(00)81297-0. [DOI] [PubMed] [Google Scholar]
- 16.Gurdon JB, Bourillot PY. Morphogen gradient interpretation. Nature. 2001;413:797–803. doi: 10.1038/35101500. [DOI] [PubMed] [Google Scholar]
- 17.Teleman AA, Strigini M, Cohen SM. Shaping morphogen gradients. Cell. 2001;105:559–62. doi: 10.1016/s0092-8674(01)00377-4. [DOI] [PubMed] [Google Scholar]
- 18.Ruhrberg C. Growing and shaping the vascular tree: multiple roles for VEGF. Bioessays. 2003;25:1052–60. doi: 10.1002/bies.10351. [DOI] [PubMed] [Google Scholar]
- 19.Ruhrberg C, Gerhardt H, Golding M, Watson R, Ioannidou S, Fujisawa H, et al. Spatially restricted patterning cues provided by heparin-binding VEGF-A control blood vessel branching morphogenesis. Genes Dev. 2002;16:2684–98. doi: 10.1101/gad.242002. [DOI] [PMC free article] [PubMed] [Google Scholar]
- 20.Rifkin DB, Mazzieri R, Munger JS, Noguera I, Sung J. Proteolytic control of growth factor availability. Apmis. 1999;107:80–5. doi: 10.1111/j.1699-0463.1999.tb01529.x. [DOI] [PubMed] [Google Scholar]
- 21.Campbell PG, Miller ED, Fisher GW, Walker LM, Weiss LE. Engineered spatial patterns of FGF-2 immobilized on fibrin direct cell organization. Biomaterials. 2005;26:6762–70. doi: 10.1016/j.biomaterials.2005.04.032. [DOI] [PubMed] [Google Scholar]
- 22.Campbell PG, Weiss LE. Tissue engineering with the aid of inkjet printers. Expert Opin Biol Ther. 2007;7:1123–7. doi: 10.1517/14712598.7.8.1123. [DOI] [PubMed] [Google Scholar]
- 23.Miller ED, Fisher GW, Weiss LE, Walker LM, Campbell PG. Dose-dependent cell growth in response to concentration modulated patterns of FGF-2 printed on fibrin. Biomaterials. 2006;27:2213–21. doi: 10.1016/j.biomaterials.2005.10.021. [DOI] [PubMed] [Google Scholar]
- 24.Miller ED, Phillippi JA, Fisher GW, Campbell PG, Walker LM, Weiss LE. Inkjet printing of growth factor concentration gradients and combinatorial arrays immobilized on biologically-relevant substrates. Comb Chem High Throughput Screen. 2009;12:604–18. doi: 10.2174/138620709788681907. [DOI] [PubMed] [Google Scholar]
- 25.Phillippi JA, Miller E, Weiss L, Huard J, Waggoner A, Campbell P. Microenvironments engineered by inkjet bioprinting spatially direct adult stem cells toward muscle- and bone-like subpopulations. Stem Cells. 2008;26:127–34. doi: 10.1634/stemcells.2007-0520. [DOI] [PubMed] [Google Scholar]
- 26.Cooper GM, Miller ED, Decesare GE, Usas A, Lensie EL, Bykowski MR, et al. Inkjet-based biopatterning of bone morphogenetic protein-2 to spatially control calvarial bone formation. Tissue Eng Part A. 2010;16:1749–59. doi: 10.1089/ten.tea.2009.0650. [DOI] [PMC free article] [PubMed] [Google Scholar]
- 27.Krampera M, Pasini A, Rigo A, Scupoli MT, Tecchio C, Malpeli G, et al. HB-EGF/HER-1 signaling in bone marrow mesenchymal stem cells: inducing cell expansion and reversibly preventing multilineage differentiation. Blood. 2005;106:59–66. doi: 10.1182/blood-2004-09-3645. [DOI] [PubMed] [Google Scholar]
- 28.Marikovsky M, Breuing K, Liu PY, Eriksson E, Higashiyama S, Farber P, et al. Appearance of heparin-binding EGF-like growth factor in wound fluid as a response to injury. Proc Natl Acad Sci U S A. 1993;90:3889–93. doi: 10.1073/pnas.90.9.3889. [DOI] [PMC free article] [PubMed] [Google Scholar]
- 29.Weiss LE, Schultz L, Miller ED. Inkjet Deposition System with Computer Vision-Based Calibration for Targeting Accuracy. Pittsburgh: Carnegie Mellon University; 2006. [Google Scholar]
- 30.Campbell PG, Skaar TC, Vega JR, Baumrucker CR. Secretion of insulin-like growth factor-I (IGF-I) and IGF-binding proteins from bovine mammary tissue in vitro. J Endocrinol. 1991;128:219–28. doi: 10.1677/joe.0.1280219. [DOI] [PubMed] [Google Scholar]
- 31.Abramoff MD, Magelhaes PJ, Ram SJ. Image processing with ImageJ. Biophotonics International. 2004;11:36–42. [Google Scholar]
- 32.Li K. Large-Scale Stem Cell Population Tracking in Phase Constrast and DIC Microscopy Image Sequences. Pittsburgh, PA: Carnegie Mellon University; 2009. [Google Scholar]
- 33.Li K, Kanade T. Nonnegative Mixed-Norm Preconditioning for Microscopy Image Segmentation. Proceedings of Information Processing in Medical Imaging Springer Lecture Notes in Computer Science; 2009. pp. 362–73. [DOI] [PubMed] [Google Scholar]
- 34.Li K, Miller E, Weiss L, Campbell P, Kanade T. Online Tracking of Migrating and Proliferating Cells Imaged with Phase-Contrast Microscopy. Proceedings of the 2006 Conference on Computer Vision and Pattern Recognition Workshop; 2006. pp. 65–72. [Google Scholar]
- 35.Fisher NI. Statistical Analysis of Circular Data. Cambridge University Press; 1993. [Google Scholar]
- 36.Zar JH. Biostatistical Analysis. 5. Prentice Hall; 2009. [Google Scholar]
- 37.Seppa H, Grotendorst G, Seppa S, Schiffmann E, Martin GR. Platelet-derived growth factor in chemotactic for fibroblasts. J Cell Biol. 1982;92:584–8. doi: 10.1083/jcb.92.2.584. [DOI] [PMC free article] [PubMed] [Google Scholar]
- 38.Garcia-Olivas R, Vilaro S, Reina M, Castel S. PDGF-stimulated cell proliferation and migration of human arterial smooth muscle cells. Colocalization of PDGF isoforms with glycosaminoglycans. Int J Biochem Cell Biol. 2007;39:1915–29. doi: 10.1016/j.biocel.2007.05.011. [DOI] [PubMed] [Google Scholar]
- 39.Bussolino F, Di Renzo MF, Ziche M, Bocchietto E, Olivero M, Naldini L, et al. Hepatocyte growth factor is a potent angiogenic factor which stimulates endothelial cell motility and growth. J Cell Biol. 1992;119:629–41. doi: 10.1083/jcb.119.3.629. [DOI] [PMC free article] [PubMed] [Google Scholar]
- 40.Ozaki Y, Nishimura M, Sekiya K, Suehiro F, Kanawa M, Nikawa H, et al. Comprehensive analysis of chemotactic factors for bone marrow mesenchymal stem cells. Stem Cells Dev. 2007;16:119–29. doi: 10.1089/scd.2006.0032. [DOI] [PubMed] [Google Scholar]
- 41.Forte G, Minieri M, Cossa P, Antenucci D, Sala M, Gnocchi V, et al. Hepatocyte growth factor effects on mesenchymal stem cells: proliferation, migration, and differentiation. Stem Cells. 2006;24:23–33. doi: 10.1634/stemcells.2004-0176. [DOI] [PubMed] [Google Scholar]
- 42.Fiedler J, Leucht F, Waltenberger J, Dehio C, Brenner RE. VEGF-A and PlGF-1 stimulate chemotactic migration of human mesenchymal progenitor cells. Biochem Biophys Res Commun. 2005;334:561–8. doi: 10.1016/j.bbrc.2005.06.116. [DOI] [PubMed] [Google Scholar]
- 43.Fiedler J, Roderer G, Gunther KP, Brenner RE. BMP-2, BMP-4, and PDGF-bb stimulate chemotactic migration of primary human mesenchymal progenitor cells. J Cell Biochem. 2002;87:305–12. doi: 10.1002/jcb.10309. [DOI] [PubMed] [Google Scholar]
- 44.Langer R, Vacanti JP. Tissue engineering. Science. 1993;260:920–6. doi: 10.1126/science.8493529. [DOI] [PubMed] [Google Scholar]
- 45.Weiss L, Amon C, Finger S, Miller E, Romero D, Verdinnli I, et al. Bayesian computer-aided experimental design of heterogeneous scaffolds for tissue engineering. Computer-Aided Design. 2005;37:1127–3. [Google Scholar]
- 46.Cai AQ, Landman KA, Hughes BD. Multi-scale modeling of a wound-healing cell migration assay. J Theor Biol. 2007;245:576–94. doi: 10.1016/j.jtbi.2006.10.024. [DOI] [PubMed] [Google Scholar]
- 47.Tomasz M. Mitomycin C: small, fast and deadly (but very selective) Chem Biol. 1995;2:575–9. doi: 10.1016/1074-5521(95)90120-5. [DOI] [PubMed] [Google Scholar]
- 48.Li Jeon N, Baskaran H, Dertinger SK, Whitesides GM, Van de Water L, Toner M. Neutrophil chemotaxis in linear and complex gradients of interleukin-8 formed in a microfabricated device. Nat Biotechnol. 2002;20:826–30. doi: 10.1038/nbt712. [DOI] [PubMed] [Google Scholar]
- 49.Shamloo A, Ma N, Poo MM, Sohn LL, Heilshorn SC. Endothelial cell polarization and chemotaxis in a microfluidic device. Lab Chip. 2008;8:1292–9. doi: 10.1039/b719788h. [DOI] [PubMed] [Google Scholar]
- 50.Lin F, Butcher EC. T cell chemotaxis in a simple microfluidic device. Lab Chip. 2006;6:1462–9. doi: 10.1039/b607071j. [DOI] [PubMed] [Google Scholar]
- 51.Stefonek TJ, Masters KS. Immobilized gradients of epidermal growth factor promote accelerated and directed keratinocyte migration. Wound Repair Regen. 2007;15:847–55. doi: 10.1111/j.1524-475X.2007.00288.x. [DOI] [PubMed] [Google Scholar]
- 52.Liu L, Ratner BD, Sage EH, Jiang S. Endothelial cell migration on surface-density gradients of fibronectin, VEGF, or both proteins. Langmuir. 2007;23:11168–73. doi: 10.1021/la701435x. [DOI] [PubMed] [Google Scholar]
- 53.DeLong SA, Moon JJ, West JL. Covalently immobilized gradients of bFGF on hydrogel scaffolds for directed cell migration. Biomaterials. 2005;26:3227–34. doi: 10.1016/j.biomaterials.2004.09.021. [DOI] [PubMed] [Google Scholar]
- 54.Smith JT, Tomfohr JK, Wells MC, Beebe TP, Jr, Kepler TB, Reichert WM. Measurement of cell migration on surface-bound fibronectin gradients. Langmuir. 2004;20:8279–86. doi: 10.1021/la0489763. [DOI] [PubMed] [Google Scholar]
- 55.Lang S, von Philipsborn AC, Bernard A, Bonhoeffer F, Bastmeyer M. Growth cone response to ephrin gradients produced by microfluidic networks. Anal Bioanal Chem. 2008;390:809–16. doi: 10.1007/s00216-007-1363-3. [DOI] [PMC free article] [PubMed] [Google Scholar]
- 56.von Philipsborn AC, Lang S, Loeschinger J, Bernard A, David C, Lehnert D, et al. Growth cone navigation in substrate-bound ephrin gradients. Development. 2006;133:2487–95. doi: 10.1242/dev.02412. [DOI] [PubMed] [Google Scholar]
- 57.Singer AJ, Clark RA. Cutaneous wound healing. N Engl J Med. 1999;341:738–46. doi: 10.1056/NEJM199909023411006. [DOI] [PubMed] [Google Scholar]
- 58.Schmoekel HG, Weber FE, Schense JC, Gratz KW, Schawalder P, Hubbell JA. Bone repair with a form of BMP-2 engineered for incorporation into fibrin cell ingrowth matrices. Biotechnol Bioeng. 2005;89:253–62. doi: 10.1002/bit.20168. [DOI] [PubMed] [Google Scholar]
- 59.Ehrbar M, Djonov VG, Schnell C, Tschanz SA, Martiny-Baron G, Schenk U, et al. Cell-demanded liberation of VEGF121 from fibrin implants induces local and controlled blood vessel growth. Circ Res. 2004;94:1124–32. doi: 10.1161/01.RES.0000126411.29641.08. [DOI] [PubMed] [Google Scholar]