

Abstract
Collagen fibrils are the main constituent of the extracellular matrix surrounding eukaryotic cells. Although the assembly and structure of collagen fibrils is well characterized, very little appears to be known about one of the key determinants of their biological function—namely, the physico-chemical properties of their surface. One way to obtain surface-sensitive structural and chemical data is to take advantage of the near-field nature of surface- and tip-enhanced Raman spectroscopy. Using Ag and Au nanoparticles bound to Collagen type-I fibrils, as well as tips coated with a thin layer of Ag, we obtained Raman spectra characteristic to the first layer of collagen molecules at the surface of the fibrils. The most frequent Raman peaks were attributed to aromatic residues such as phenylalanine and tyrosine. In several instances, we also observed Amide I bands with a full width at half-maximum of 10–30 cm−1. The assignment of these Amide I band positions suggests the presence of 310-helices as well as α- and β-sheets at the fibril's surface.
Introduction
Collagen is the most abundant protein in the human body, where it is the main constituent of connective tissues and of the extracellular matrix surrounding most cells (1). Currently, there are 29 members of the human collagen protein family (2). Among these, Collagen I is the most abundant and assembles into fibrils of ∼100 nm in diameter with a distinctive 67-nm banding pattern both in vitro and in vivo (3). These fibrils assemble in the extracellular space after cleavage of procollagen molecules that have first undergone a variety of posttranslational modifications. These include the hydroxylation of certain proline and lysine residues and the glycosylation of hydroxylysine residues (4). These posttranslational modifications affect the stability and function of collagen, as revealed by a variety of human diseases. Collagen diseases such as Osteogenesis Imperfecta and Scurvy are a result of overglycosylation (5) and underhydroxylation (6) of the collagen molecule, respectively.
After these modifications, the procollagen molecules assemble into trimers initiated by the formation of di-sulfide bonds in the C-terminal propeptide (7). The procollagen trimers are then secreted into the extracellular space where they are converted into collagen by the cleavage of the C- and N-terminal propeptides (8). The collagen molecules then aggregate into collagen fibrils several tens of microns in length and with a diameter of ∼100 nm. These fibrils interact with proteoglycans, other proteins, and molecules to form the so-called extracellular matrix. Electron tomography of corneal collagen fibrils that are coassemblies of Collagen I and V revealed the intrafibrillar organization of collagen as well as the presence of macromolecules binding to the fibril's surface (9).
What makes these fibrils unique is the collagen molecule's relatively uncommon characteristic secondary structure called the 310-helix or triple helix. The structure of the 310 helix has been characterized by x-ray diffraction patterns of bulk tendons (10,11) and of collagen-like peptides (12). This helix has three residues per turn and a rise per residue of 0.29 nm (13). It is actually unstable in its single-stranded form and is only observed in a triple helix (8). In contrast, the most prevalent secondary structures in proteins are the α-helix followed by the β-sheet. The α-helix is far less tightly wound than the 310-helix with 3.6 residues per turn and a rise per residue of 0.15 nm, and occurs in a single-stranded form (14).
To obtain surface-sensitive structural and chemical information on collagen fibrils, we decided to take advantage of the spatial and chemical specificity of surface-enhanced Raman spectroscopy (15). Raman scattering is an inelastic process that suffers from a small scattering cross-section (16). However, by coupling the molecule or macromolecular assembly of interest with a metallic nanostructure such as a Ag nanoparticle or a Ag-coated atomic force microscopy (AFM) tip, it is possible to achieve signal enhancement of up to 1014 (17) and 109 (18), respectively. Both approaches, named surface-enhanced Raman scattering (SERS) and tip-enhanced Raman scattering (TERS), have been applied to the characterization of viruses, cells, DNA, single amino acids, and amyloid fibrils (19–23). With the enhancement effect being due to a coupling between the metal nanostructure and the sample, the penetration depth is limited to 3 nm (24,25), making SERS and TERS surface-sensitive techniques.
In this study, we demonstrate (to our knowledge) the first characterization of the surface of in vitro-assembled rat tail Collagen I fibrils by both SERS and TERS. The observed spectra differ strongly from bulk Raman microspectroscopy spectra and are mainly sensitive to the distribution of aromatic residues at the fibril's surface. We also observed in many instances the presence of narrow, <30 cm−1, Amide I bands that were attributed to the presence of 310-helices as well as α-helices and β-sheets at the fibril's surface. All our data indicates that both SERS and TERS are very promising techniques for the structural and chemical characterization of the collagen fibril surface in physiological and pathological situations.
Materials and Methods
Collagen sample preparation
Rat tail Collagen I was purchased (Sigma, St. Louis, MO). For enhanced Raman experiments, assembly was induced by diluting Collagen I to 0.1 mg/mL in phosphate-buffered saline (PBS). One-milliliter samples were incubated in a 37°C water bath for 1 h. A 0.5 mL aliquot was deposited on a clean glass-bottom petri dish. After 30 min, the sample was washed with deionized water and dried with nitrogen gas. For diffraction-limited Raman experiments, Collagen I was diluted to 0.45 mg/mL in PBS and incubated 17 h to form a clump of fibrils. Every other step remained unchanged. To form a sheet of collagen, collagen was diluted to 0.5 mg/mL in a 20 mM Tris, 100 mM NaCl buffer. A 20 μL aliquot was deposited on a clean glass-bottom petri dish. The sample was washed and dried after 17 h.
SERS sample preparation
SERS samples were prepared in a variety of ways. Dried Collagen I fibrils adsorbed onto glass were covered with either a solution of either citrate-stabilized polydisperse Ag nanoparticles (100 μL), citrate-stabilized 65 nm Au nanoparticles (100 μL), or 30 nm Ag nanoparticles stabilized in a 2 mM citrate solution (10 μL) (nanoComposix, San Diego, CA) and deionized water.
The silver polydisperse nanoparticles were formed by heating 150 mL of a 0.02% AgNO3 (Sigma) solution to a boil and adding 3 mL of 1% sodium citrate (Alfa Aesar, Karlsruhe, Germany). The solution was stirred at 300 rpm for 6 min. When the nanoparticles formed, the transparent solution turned yellow.
Gold nanoparticles were formed by heating 100 mL of a 0.01% HAuClO2·3H2O (Alfa Aesar) solution to a boil and adding 0.5 mL of 1% sodium citrate solution. In 10 min, nanoparticles formed and the solution changed from colorless to reddish purple.
The formed nanoparticles ranged in size, with an average diameter of 45 ± 25 nm and 65 ± 11 nm for Ag and Au nanoparticles, respectively, as determined by scanning electron microscopy.
Other samples were assembled in the presence of nanoparticles. Collagen I was diluted to 0.1 mg/mL in a 0.5 mL solution of PBS and Ag nanoparticles (100 μL of the Ag polydisperse nanoparticles or 10 μL of 30 nm nanoComposix Ag nanoparticles). The samples were incubated in a 37°C water bath for 1 h. The samples were then deposited on clean glass-bottom petri dishes. All SERS experiments were performed in liquid.
Tip preparation
TERS tips were prepared using evaporated Ag films. Silicon AFM tips were coated with 30 nm of Ag via thermal evaporation deposition. The evaporation was preformed in an evaporator (Model 4; Edwards, West Sussex, UK) with a background pressure between 10−5 and 10−6 Torr. Ag was heated in a tungsten basket with the cantilevers 12–15cm above the Ag source. The average deposition rate was ∼10 nm/min with the thickness being monitored by a quartz microbalance. Tips were used within one week of deposition.
Raman spectroscopy
The transmission tip-enhanced Raman setup consisted of an inverted microscope (1X71; Olympus, Center Valley, PA), an atomic force microscope (Bioscope II; Veeco, Santa Barbara, CA), and an iHR550 Raman Spectrometer (Horiba Jobin Yvon, Edison, NJ). The samples were excited by a 532-nm (far-field, Ag SERS, TERS) or a 660-nm (Au SERS) solid-state laser (Ventus Vis, Laser Quantum, Cheshire, UK) focused into a 1 μm spot with a 1.3 NA, 100× oil-immersion objective lens. For diffraction-limited Raman experiments, the power on the sample was adjusted to 5 mW and the scattered light was collected for 75 s per 600 cm−1 wavenumber window. For enhanced Raman experiments, the power was reduced to 100 μW and the scattered light was collected for 10, 20, or 100 s per 1000 cm−1 wavenumber window for Au SERS, Ag SERS, and TERS, respectively.
Atomic force microscopy
All samples were imaged in contact- or tapping-mode in air. For contact-mode imaging, MSNL cantilevers (Veeco) with 0.03 and 0.1 N/m nominal spring constants were used as well as CONT cantilevers (Nanoworld, Neuchâtel, Switzerland) with a 0.2 N/m nominal spring constant. For tapping mode imaging, we used a TESP-SS cantilever (Veeco) with a 42 N/m nominal spring constant and a resonance frequency of 300 kHz. The amplitude of oscillation was set to 10 nm for both imaging and Raman scattering data collection. A scan rate of 1Hz was used to produce 512 × 512 pixel images. A closed-loop feedback system in the x, y, and z directions was used for all scans. All the images were analyzed with the program Gwyddion (http://gwyddion.net/).
Spectral data processing
Spectra were fitted in LabSpec (Horiba Jobin Yvon) using Gaussian functions to determine position, intensity, and widths of the peaks. The diffraction-limited Raman spectrum of Collagen I fibrils underwent background subtraction as well as smoothing by a filtration of degree 2 and size 9 in LabSpec. The spectrum of a sheet of collagen underwent background subtraction. The Amide I band of this spectrum was then fit with multiple Gaussian functions. The enhanced Raman spectra were not altered with smoothing or background subtraction. The enhancement factor (M) of a Raman spectrum was calculated from the enhanced peak intensity (Ienhanced) and the nonenhanced noise intensity (Inonenhanced) as well as the scattering area radius for enhanced (renhanced) and nonenhanced scattering (rnonenhanced) in Eq. 1 (26). The nonenhanced scattering radius was estimated to be 500 nm and the enhanced scattering radius was estimated to be 30 nm for TERS, 23 nm for SERS with polydisperse Ag nanoparticles, and 33 nm for Au SERS, as
| (1) |
Results
Reference spectrum of Collagen I fibrils
Collagen I fibrils adsorbed onto glass were imaged by AFM in air. We observed two types of structure, dense networks of fibrils (Fig. 1 A) and sheets of fibrils several microns in thickness (Fig. 1 B). Both spectra were dominated by the Raman scattering of the glass substrate. Subtracting a spectrum of clean glass allowed us to obtain spectra with a typical collagen fingerprint (Fig. 1 C), characterized by five bands. The Amide III and I bands were observed at 1268 ± 22 and 1655 ± 3cm−1 (27–29). The 1447 ± 2 and 2933 ± 5 cm−1 bands are associated with CH2 and CH3 deformations and the 3320 ± 10 cm−1 band is attributed to NH stretching (27–29).
Figure 1.
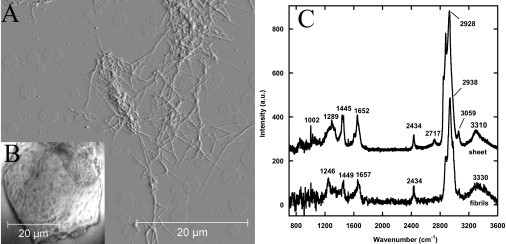
Far-field Raman spectrum of Collagen I fibrils. (A) Contact-mode AFM deflection image in air of a dense network of fibrils obtained with a 0.01 N/m MSNL cantilever. (B) Optical image of a sheet of Collagen I fibrils. (C) Raman difference spectra of the sheet and a dense network of fibrils. Positions of the major bands are indicated. The 2432 cm−1 band is attributed to glass. The FWHM of the Amide I bands are 90 cm−1.
Surface-enhanced Raman spectroscopy
As a first step to obtain enhanced Raman spectra, silver nanoparticles were attached to Collagen I fibrils in water. Fibrils with well-attached nanoparticles (Fig. 2, A and B) were used for SERS experiments. Typically, the SER spectra of a Collagen I fibrils had many intense bands in the 1000–1800 cm−1 region (Fig. 2 C). The spectra of the silver nanoparticles in water on clean glass did not reveal any distinct peaks (see Fig. S1 in the Supporting Material). Even so, most of the PBS in which fibrils were assembled was washed before the SERS experiments, and we did observe in most spectra a weak contribution of PBS with peaks at ∼936 and 1022 cm−1 (30). A histogram of peak positions observed in the 600–1800 cm−1 region (Fig. 2 D) revealed two common bands. These peaks, located at ∼1585 and 1605 cm−1, can be attributed to ring vibrations (29,31) of either phenylalanine or tyrosine residues and were each observed in roughly 30% of all SER spectra.
Figure 2.
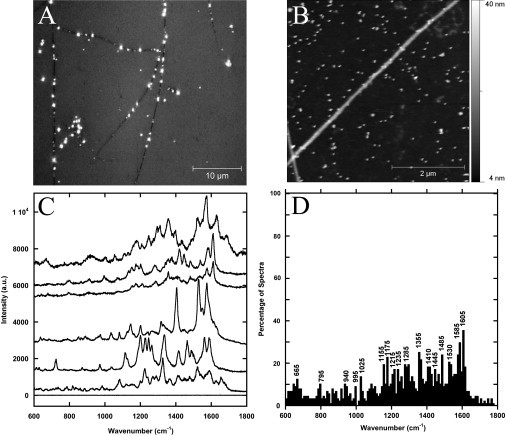
Silver-surface-enhanced Raman spectrum of Collagen I fibrils. (A) Differential interference contrast image of several Collagen I fibrils coated with polydisperse Ag nanoparticles. Each bright dot corresponds to at least one nanoparticle. (B) AFM contact mode height image of 30 nm Ag nanoparticles attached to collagen fibrils on glass obtained in air with a 0.03 N/m MSNL cantilever. (C) Raman spectra single Collagen I fibrils with Ag nanoparticles attached and a spectrum of a fibril without nanoparticles (bottom spectra). The Raman scattering signal was enhanced by a factor of 104. (D) Histogram of peak positions observed in 87 silver SERS spectra of Collagen I fibrils.
Interestingly the fingerprint modes of phenylalanine and tyrosine residues at 1000 and 828 cm−1 (32), respectively, were not observed in any spectrum. Using uncoated regions of the fibrils as a reference, the polydisperse Ag nanoparticles were found to enhance the Raman scattering signal by a factor of 104. This number is much lower than SERS enhancement factors of roughened metallic surfaces due to the lack of intense hot spots regularly found on these surfaces (33). This is also a conservative estimate. Considering that these peaks were not present in the nonenhanced spectra, the noise was used as the intensity of the peak.
As an attempt to observe the fingerprint modes of phenylalanine and tyrosine residues, 65-nm gold nanoparticles were also attached to Collagen I fibrils in water. The Au nanoparticles had a high affinity to the collagen fibrils (Fig. 3 A). The particles often attached to the fibrils in register with the 67-nm banding pattern (Fig. 3 B). The gold SER spectra of Collagen I fibrils had many peaks in the 1000–1800 cm−1 region, with a distinctive 1000 cm−1 phenylalanine peak in nearly every spectrum (Fig. 3 C). The 828 cm−1 tyrosine peak was much less common, but still apparent.
Figure 3.
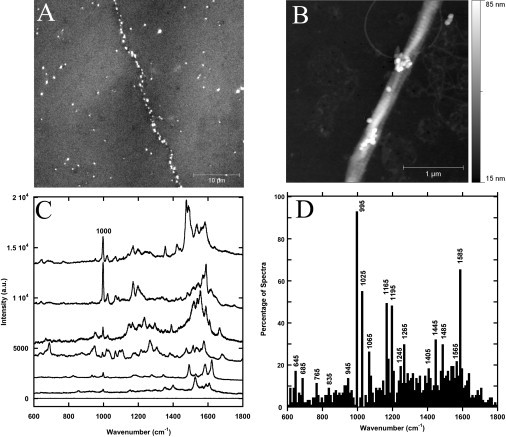
Gold-surface-enhanced Raman spectrum of Collagen I fibrils. (A) Differential interference contrast image of several Collagen I fibrils coated with 65 nm Au nanoparticles. Each bright dot corresponds to at least one nanoparticle. (B) AFM tapping mode height image in air of 65 nm Au nanoparticles attached to collagen fibrils on glass obtained with a TESP-SS cantilever. (C) Raman spectra single Collagen I fibrils with Au nanoparticles attached and a spectrum of a fibril without nanoparticles (bottom). The Raman scattering signal was enhanced by a factor of 105. (D) Histogram of peak positions observed in 87 gold SERS spectra of Collagen I fibrils.
The spectra of the gold nanoparticles in water on clean glass did not reveal any distinct peaks (Fig. S1). A histogram of peak positions observed between 600 and 1800 cm−1 revealed four more very common peaks at ∼1025, 1165, 1195, and 1585 cm−1 that each appeared in >40% of all spectra. These peaks can all be attributed to phenylalanine (22,29,32,34–36). However, the 1025 cm−1 may also arise from PO43− attached to the fibrils (30). Using uncoated fibrils as a reference, the Au nanoparticles were found to increase the Raman scattering signal by a factor of 105.
Tip-enhanced Raman spectroscopy
To control the position of the Raman probe, we used TERS tips coated with a 30-nm Ag layer in air. These coated AFM tips were put in contact with Collagen I fibrils to collect enhanced spectra (Fig. 4 A). The TERS tips also did not have a very intense background spectrum (Fig. S1). The TER spectra of fibrils had fewer peaks per spectra than SERS but still had many intense peaks evident in a histogram of the TERS peak positions between 1150 and 1750 cm−1 (Fig. 4 B). The peaks between 600 and 1150 cm−1 were not common (Fig. S2 in the Supporting Material). The ring vibrations at 1585 and 1610 cm−1 were also common peaks in the TER spectra. When compared with an out-of-contact spectrum of the fibril, the tip was found to enhance the Raman scattering signal by a factor of 8000.
Figure 4.
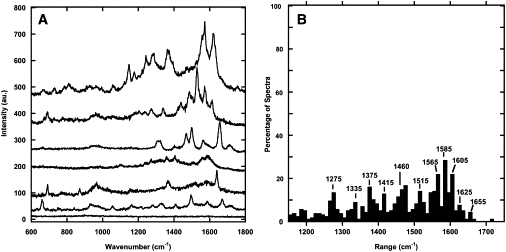
Tip-enhanced Raman spectrum of Collagen I fibrils. (A) Raman spectra of a single Collagen I fibril with Ag-coated tips in contact with the fibril and out of contact (bottom). The Raman scattering signal was enhanced by a factor of 8000. (B) Histogram of peak positions observed in 154 TERS spectra taken on 15 Collagen I fibrils.
These silver-coated tips were used to make a line profile across a collagen fibril. A 1.14-μm line across a fibril was scanned on an AFM image with spectra taken every 39 nm (Fig. 5 A). Spectra taken at points on the fibril contained a 1330 cm−1 peak not observed in the other spectra (Fig. 5 B) that can be attributed to either a tyrosine ring vibration or a CH vibration (see Table 2). The spectra taken on the fibril were homogeneous (see Fig. S3 in the Supporting Material). Similar spectra with shifted peaks and an absent 1330 cm−1 peak were observed in a region next to the fibril on what could possibly be a small aggregate of collagen molecules (Fig. S3). A plot of the intensity of the 1330 cm−1 peak along the scan was comparable to the AFM height profile of the fibril. The full width at half-maximum (FWHM) of the fibril along the line was found to be 100 nm in both the height map and the 1330 cm−1 peak intensity map.
Figure 5.
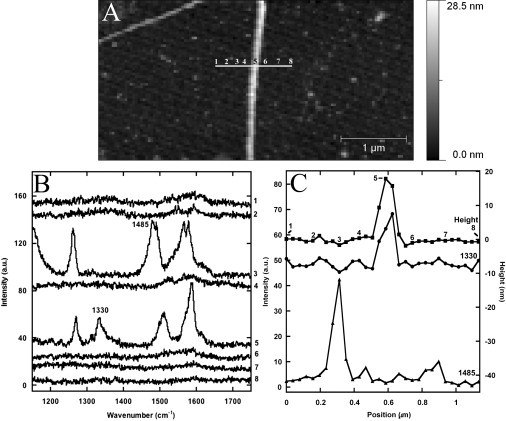
Tip-enhanced Raman line scan of a Collagen I fibril collected in tapping mode in air at an oscillation amplitude of 10 nm. (A) AFM height image of the Collagen I fibril obtained with a TESP-SS cantilever before Raman line scanning. (White horizontal line across the fibril) The 1.14 μm path of the Raman line scan. (B) The tip-enhanced Raman spectra at different points along the 30 point path. (C) Height profile of the Collagen I fibril after Raman profile (squares) and the intensities of the 1330 (circles) and 1485 cm−1 (triangles) peaks along the Raman line scan. The height profile and the intensity profile at 1330 cm−1 both have a FWHM of 100 nm.
Table 2.
Amino acid composition
| Gly | Pro | Ala | Arg | Glu | Ser | Lys | Asp | Gln |
| 32.8% | 22.3% | 10.9% | 5.0% | 4.6% | 4.2% | 3.6% | 3.2% | 2.9% |
| Leu | Thr | Val | Phe | Asn | Met | Ile | Tyr | His |
| 1.9% | 1.9% | 1.9% | 1.3% | 1.3% | 0.8% | 0.7% | 0.5% | 0.2% |
Analysis of the Amide I band
Several spectra of Collagen I fibrils obtained with TERS (Fig. 6 A) and SERS (Fig. 6 B) presented Amide I peaks. We observed narrow peaks that were similar in position to the 1655 cm−1 reference Amide I band. The reference Amide I band from the collagen sheet (Fig. 7 A) was fit with a convolution of narrower Gaussian functions with a FWHM of 25 or 30 cm−1. The Gaussian fitting function positions were comparable to a histogram of Amide I peak positions found in SERS and TERS (Fig. 7 B). The mean width of the SERS and TERS Amide I peaks was 22 ± 12 cm−1. The SERS and TERS peaks were also more similar in width to the Gaussian fitting functions, 25 and 30 cm−1, than the 90 cm−1 wide Raman Amide I band itself.
Figure 6.
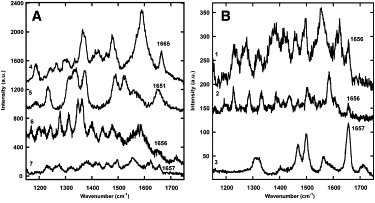
Spectra of Collagen I fibrils with peaks in the Amide I region generated using TERS and SERS. (A) Tip-enhanced spectra of Collagen I fibrils obtained with a silver-coated 0.01 N/m MSNL tip (1 and 3) and a CONT tip (2). (B) Surface-enhanced spectra of Collagen I fibrils obtained with polydisperse Ag nanoparticles (4), 30 nm Ag nanoparticles (5 and 7), and 65 nm Au nanoparticles (6).
Figure 7.
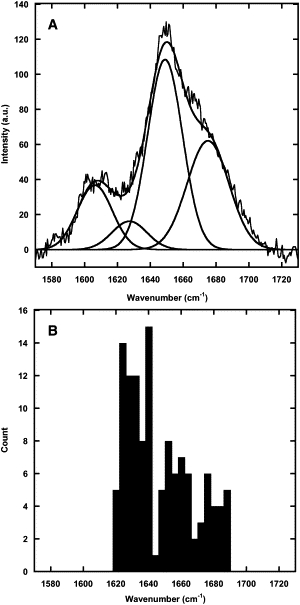
Comparison of the diffraction-limited and enhanced Raman Amide I peaks for Collagen I fibrils. (A) Peak fitting of the Amide I band observed in a sheet of collagen presented in Fig. 1B. The positions, height, and FWHM of the Gaussians are presented in Table 1. (B) Histogram of the Amide I peak positions observed in SERS and TERS. The average FWHM of the Amide I band in 42 silver SERS, 37 gold SERS, and 29 silver TERS spectra used were 27 ± 12 cm−1, 22 ± 11 cm−1, and 15 ± 7 cm−1, respectively.
Discussion
Differences between enhanced and normal Raman techniques
In the diffraction-limited Raman spectrum of collagen fibrils (Fig. 1 B), only contributions from C-H, N-H, Amide I, and III bands were visible in both spectra. A 1000 cm−1 phenyl ring vibration, commonly observed in published collagen spectra (27,28), was, however, visible in our spectrum of collagen fibrils arranged in microns-thick sheets.
Enhanced Raman techniques are sensitive to the surface of the fibril, and in enhanced Raman, we observed peaks not seen in diffraction-limited Raman. In a previous study using an oscillating cantilever, the Raman intensity of a sample was found to decay exponentially with increasing tip-sample separation with a decay length of 2.8 nm (24). Note that SERS has a sensing volume within a few nanometers of the surface (25), and collagen molecules have a diameter between 1 and 2 nm (8). This means that our enhanced Raman experiments only probed bonds in the first layer of collagen molecules on the surface of the fibril.
Another advantage of enhanced Raman techniques is the spatial resolution. We were able to make 1-μm line scans across fibrils with a resolution comparable to that of AFM profiling (Fig. 5). Because of their surface sensitivity, SERS and TERS could be used to characterize the surface of naturally occurring collagen fibrils. It should be possible, for example, to detect posttranslational modifications such as glycosylation and hydroxylation on the fibrils' surface. We could also use this approach to detect the presence of uncleaved propeptides at the surface of the fibrils by using their high disulfide content.
Observation of ring modes
The commonly observed peaks in both SERS and TERS spectra included ring vibrations, amide bands, and C-H and COO− vibrations (Table 1). The CH vibrations were understandably frequent due to the plethora of CH bonds present in the collagen chain. The COO− vibrations arise from the ionized carboxyl groups in the residues of aspartic and glutamic acid (31) which account for 7.8% of the collagen peptide chain (Table 2). But most importantly, amino acids with aromatic side groups give rise to strong Raman bands. It has been observed that the SER spectra of di- and tri-peptides are dominated by amide bands and aromatic side-chain vibrations (31). Although collagen is mostly comprised of glycine, proline, and alanine, the helical sequence contains the aromatic amino acids phenylalanine and tyrosine (Table 2). Therefore, we chose to focus our assignment and discussion on the aromatic residues (see the Supporting Material for a detailed discussion).
Table 1.
Spectral peak assignments
| Far field | Gold SERS | Silver SERS | Silver TERS | Proposed assignment |
|||
|---|---|---|---|---|---|---|---|
| Phenylalanine ring (Wilson vibration number, group, and range) (22,29,34–37,39) | Tyrosine ring (Wilson vibration number, group, and range) (22,29,34–37,39) | Amide (27,28,40,42,43) | Other (22,27,28,34–36) | ||||
| 645 | 665 | — | 6b, B3g (630 ± 20) | COO− wag. | |||
| 685 | — | 4, B1 (690 ± 10) | 4, B2g (700 ± 35) | ||||
| 765 | — | ||||||
| 795 | — | A1 (725 ± 75) | Ag (820 ± 50) | ||||
| 835 | — | 10a, A2 (835 ± 25) | 10a, B1g (820 ± 30) | CH | |||
| 945 | 940 | — | 17a, A1 (960 ± 20) | 17a, Au (960 ± 30) | C-COO− | ||
| 1002 | 995 | — | 12, A1 (1000 ± 10) | ||||
| 1025 | 1025 | — | 18a, A1 (1024 ± 6) | 18a, B1u (1012 ± 9) | |||
| 1065 | — | 18b, B2 (1074 ± 8) | |||||
| 1165 | 1155 | 15, B2 (1156 ± 5) | 9a, Ag (1166 ± 24) | ||||
| 1195 | 1175 | 9a, A1 (1175 ± 5) | |||||
| 1215 | A1 (1205) | Ag (1210 ± 15) | |||||
| 1245 | 1235 | B1u (1250 ± 15) | Amide III | ||||
| 12461289 | Amide III | CH | |||||
| 1265 | 1285 | 1275 | 3, B2 (1275 ± 20) | 3, B3g (1286 ± 26) | Amide III | CH | |
| 1355 | 1335 | 14, B2u (1310 ± 70) | CH | ||||
| 1405 | 1410 | 1415 | 19b, B2u (1420 ± 50) | COO− sym. (1390 ± 50) | |||
| 14451449 | 1445 | 1445 | 1460 | 19b, B2 (1455 ± 16) | CH | ||
| 1485 | 1485 | 1515 | 19a, A1 (1492 ± 22) | 19a, B1u (1495 ± 35) | |||
| 1530 | |||||||
| 1565 | 1565 | Amide II | |||||
| 1585 | 1585 | 1585 | 8b, B2 (1579 ± 18) | 8b, B3g (1578 ± 26) | COO− asym. | ||
| 1605 | 1605 | 8a, A1 (1594 ± 20) | 8a, Ag (1600 ± 29) | COO− asym. | |||
| 1627 | 1632∗ | Amide I (310-helix) | COO- asym.† (1620 ± 70) | ||||
| 1649 | 1656 | Amide I (α-helix) | COO− asym. | ||||
| 1675 | 1675 | Amide I (β-sheet) | COO− asym. | ||||
The modes of ring vibrations are categorized into groups that have different polarizability components. In general, a mode is strongly enhanced if its polarizability component is perpendicular to the metal's surface (37). This is in contrast to far-field techniques, where, in a randomly oriented sample, all of the Raman active modes will be observed. For this reason, the orientation of the rings, with respect to the metal surface, greatly affects the observed spectra. The phenylalanine and tyrosine residues each have a group of modes, A1 and Ag (34), respectively, that have polarizability components in all directions, x, y, and z (Fig. 8) (38). These modes should be enhanced regardless of the orientation of the ring. The 1000 and 1605 cm−1 modes are of this kind—the first one for just phenylalanine, and the second one for phenylalanine and tyrosine (Table 1).
Figure 8.
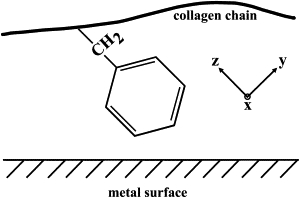
Proposed orientation of the phenylalanine residue with respect to the metal surface. The coordinate system of the phenyl molecule is shown.
The other groups of modes will only be enhanced in particular orientations. The B1 and B2g modes would be ideally enhanced if the face of the ring was tilted toward the metal's surface due to their polarizability in the x,z direction of the ring. The only mode of this kind was observed at 685 cm−1 in the gold SERS experiments. The B2 and B3g modes would be optimally enhanced if the edge of the ring was tilted toward the surface due to their polarizability in the y,z direction (Fig. 8). The 1585 cm−1 peak that was strongly observed in all methods is of this kind. The A2 and B1g modes would be greatly enhanced if the face of the ring was tilted toward the metal surface as well as the edge due to their polarizability in the x,y direction. The 828 cm−1 band characteristic of tyrosine is a B1g mode and was only rarely observed in the gold SERS experiments.
In the gold SERS experiments, the symmetric 1000 cm−1 peak was visible in almost every spectrum but was also regularly of a lower intensity than the other peaks (Fig. 3, and see Fig. S4 in the Supporting Material). This has also been observed in previous gold SERS experiments with phenyl-containing samples (37,39). Because the 1000 cm−1 peak arises from an A1 mode, it will always be expressed regardless of the orientation of the phenyl ring. The other groups of modes will only be expressed in certain orientations. In far-field Raman, where the sample is randomly oriented and there are many rings probed, this will result in an intense 1000 cm−1 peak (Fig. S4). However, if there are a few rings probed that are in an orientation favorable to one of the other groups, the modes of these groups will be observed at a greater intensity. With the strength of the 1585 cm−1 peak compared to the 1000 cm−1 peak, it is probably that, on average, the rings are upright to the metal surface with the edge of the ring tilted toward the metal surface (Fig. 8).
Interestingly, the 1000 cm−1 peak was not observed in the silver experiments. The absence of this peak was also observed in a previous silver TERS experiment (36). In addition to orientation, the number of rings close to the surface will also affect the observed spectra. Each collagen triple strand is 300 nm long and 1–2 nm in diameter. It contains 3168 amino acids, 42 of which are phenylalanine and 15 of which are tyrosine. The Raman intensity of a mode decays exponentially from the surface with a decay length of 2.8 nm (24). To be conservative, we assume that only the top-half of the triple strand is enhanced enough to be detected. That places a phenylalanine every 14 nm along the strand and a tyrosine every 40 nm. The diameters of probes used in these experiments were 30 and 45 nm for silver SERS and 65 nm for gold SERS. With the larger probes used in the gold experiments, it is likely that more rings were in contact with the surface. Because the 1000 cm−1 peaks observed in gold SERS were often weak, it is likely that there were not enough rings in contact with the silver nanoparticles for the 1000 cm−1 peak to be observable. This weakening would also be exaggerated if the rings had a higher affinity to gold than silver.
Amide I band
The Amide I band arises mainly from the C=O stretching mode of the peptide bond with minor contributions from the C-N stretching and N-H bending modes (34). Because of this coupling between the C=O and N-H modes, the Amide I band is sensitive to the hydrogen-bonding pattern within a polypeptide. In other words, changes in position of the Amide I band indicate different secondary structures such as α-helix or β-sheet. Based on sequence analysis of Collagen type-I chains, the most frequent secondary structure is the 310-helix, which has a characteristic Amide I peak at 1630 cm−1 (40). According to a secondary structure prediction algorithm by Chou and Fasman (41), 18% of the chain should in the α-helix conformation and 19% of the chain should be in the β-sheet conformation with peaks at 1650 (42) and 1672 cm−1 (43), respectively.
Interestingly the far-field Raman spectra of Collagen I fibrils shows an Amide I band centered at 1655 cm−1, characteristic of an α-helix, with shoulders at ∼1630 and 1675 cm−1 characteristic of the 310-helix and β-sheets, respectively. Deconvolution using Gaussian peaks yielded peak positions at 1627, 1649, and 1675 cm−1 (Fig. 7 A). In comparison, enhanced Raman spectra showed narrow Amide I bands with widths at ∼20 cm−1 and a wide range of peak positions between 1620 and 1690 cm−1 (Fig. 7 B). Furthermore, the distribution of peak positions had three distinct clusters at ∼1632, 1656, and 1675 cm−1 (Fig. 7 B), in good agreement with the far-field spectrum deconvolution (Fig. 7 A). The presence of narrow Amide I bands in the enhanced Raman spectra indicates that we are observing one type of secondary structure at a given location. This allows us to assign secondary structures without the need of any deconvolution. Our results also confirm the presence of α-helix and β-sheets structures at the surface of the fibril as expected.
Conclusion
In this study, we have demonstrated the ability of nanoscale Raman techniques to obtain spatially localized surface spectra of collagen fibrils assembled in vitro. Both SERS and TERS techniques can also be applied to samples harvested from tissues to investigate naturally occurring changes in the structure and chemical composition of collagen fibrils. The next step is to obtain Raman maps along the fibril axis to reveal chemical motifs associated with the 67-nm banding pattern. Our approach, potentially, could be applied to other issues in the field of collagen research such as the structural/mechanical relationship (44) of various types of fibrils, the effect of heat on collagen structure, and the impact of aging.
Acknowledgments
L.K. and K.H. acknowledge funding from the National Sciences and Engineering Research Council of Canada and the Canada Foundation for Innovation.
Supporting Material
References
- 1.Bonifacio A., Sergo V. Effects of sample orientation in Raman microspectroscopy of collagen fibers and their impact on the interpretation of the Amide III band. Vib. Spectrosc. 2010;53:314–317. [Google Scholar]
- 2.Heino J., Huhtala M., Johnson M.S. Evolution of collagen-based adhesion systems. Int. J. Biochem. Cell Biol. 2009;41:341–348. doi: 10.1016/j.biocel.2008.08.021. [DOI] [PubMed] [Google Scholar]
- 3.Kadler K.E., Holmes D.F., Chapman J.A. Collagen fibril formation. Biochem. J. 1996;316:1–11. doi: 10.1042/bj3160001. [DOI] [PMC free article] [PubMed] [Google Scholar]
- 4.Myllyharju J. Intracellular post-translational modifications of collagens. Top. Curr. Chem. 2005;247:115–147. [Google Scholar]
- 5.Dominguez L.J., Barbagallo M., Moro L. Collagen overglycosylation: a biochemical feature that may contribute to bone quality. Biochem. Biophys. Res. Commun. 2005;330:1–4. doi: 10.1016/j.bbrc.2005.02.050. [DOI] [PubMed] [Google Scholar]
- 6.Peterkofsky B. Ascorbate requirement for hydroxylation and secretion of procollagen: relationship to inhibition of collagen synthesis in scurvy. Am. J. Clin. Nutr. 1991;54(Suppl):1135S–1140S. doi: 10.1093/ajcn/54.6.1135s. [DOI] [PubMed] [Google Scholar]
- 7.Fessler L.I., Burgeson R.E., Fessler J.H. Collagen synthesis: a disulfide-linked collagen precursor in chick bone. Proc. Natl. Acad. Sci. USA. 1973;70:2993–2996. doi: 10.1073/pnas.70.10.2993. [DOI] [PMC free article] [PubMed] [Google Scholar]
- 8.Shoulders M.D., Raines R.T. Collagen structure and stability. Annu. Rev. Biochem. 2009;78:929–958. doi: 10.1146/annurev.biochem.77.032207.120833. [DOI] [PMC free article] [PubMed] [Google Scholar]
- 9.Holmes D.F., Gilpin C.J., Kadler K.E. Corneal collagen fibril structure in three dimensions: structural insights into fibril assembly, mechanical properties, and tissue organization. Proc. Natl. Acad. Sci. USA. 2001;98:7307–7312. doi: 10.1073/pnas.111150598. [DOI] [PMC free article] [PubMed] [Google Scholar]
- 10.Rich A., Crick F.H.C. The molecular structure of collagen. J. Mol. Biol. 1961;3:483–506. doi: 10.1016/s0022-2836(61)80016-8. [DOI] [PubMed] [Google Scholar]
- 11.Okuyama K., Xu X.Z., Noguchi K. Revision of collagen molecular structure. Biopolymers. 2006;84:181–191. doi: 10.1002/bip.20381. [DOI] [PubMed] [Google Scholar]
- 12.Cowan P.M., McGavin S., North A.C.T. The polypeptide chain configuration of collagen. Nature. 1955;176:1062–1064. doi: 10.1038/1761062a0. [DOI] [PubMed] [Google Scholar]
- 13.Bhattacharjee A., Bansal M. Collagen structure: the Madras triple helix and the current scenario. IUBMB Life. 2005;57:161–172. doi: 10.1080/15216540500090710. [DOI] [PubMed] [Google Scholar]
- 14.Zagrovic B., Jayachandran G., Pande V.S. How large is an α-helix? Studies of the radii of gyration of helical peptides by small-angle x-ray scattering and molecular dynamics. J. Mol. Biol. 2005;353:232–241. doi: 10.1016/j.jmb.2005.08.053. [DOI] [PubMed] [Google Scholar]
- 15.Hudson S.D., Chumanov G. Bioanalytical applications of SERS (surface-enhanced Raman spectroscopy) Anal. Bioanal. Chem. 2009;394:679–686. doi: 10.1007/s00216-009-2756-2. [DOI] [PubMed] [Google Scholar]
- 16.Sakamoto K., Mizutani G., Ushioda S. Absolute Raman-scattering cross section of a surface-adsorbed layer: amorphous nitrobenzene on Ni111. Phys. Rev. B Condens. Matter. 1993;48:8993–9005. doi: 10.1103/physrevb.48.8993. [DOI] [PubMed] [Google Scholar]
- 17.Nie S.M., Emory S.R. Probing single molecules and single nanoparticles by surface-enhanced Raman scattering. Science. 1997;275:1102–1106. doi: 10.1126/science.275.5303.1102. [DOI] [PubMed] [Google Scholar]
- 18.Neacsu C.C., Dreyer J., Raschke M.B. Scanning-probe Raman spectroscopy with single-molecule sensitivity. Phys. Rev. B. 2006;73:193406. [Google Scholar]
- 19.Shanmukh S., Jones L., Tripp R.A. Rapid and sensitive detection of respiratory virus molecular signatures using a silver nanorod array SERS substrate. Nano Lett. 2006;6:2630–2636. doi: 10.1021/nl061666f. [DOI] [PubMed] [Google Scholar]
- 20.Premasiri W.R., Moir D.T., Ziegler L.D. Characterization of the surface enhanced Raman scattering (SERS) of bacteria. J. Phys. Chem. B. 2005;109:312–320. doi: 10.1021/jp040442n. [DOI] [PubMed] [Google Scholar]
- 21.Kneipp K., Kneipp H., Feld M.S. Detection and identification of a single DNA base molecule using surface-enhanced Raman scattering (SERS) Phys. Rev. E. 1998;57:R6281–R6284. [Google Scholar]
- 22.Stewart S., Fredericks P.M. Surface-enhanced Raman spectroscopy of amino acids adsorbed on an electrochemically prepared silver surface. Spectrochim. Acta [A] 1999;55:1641–1660. [Google Scholar]
- 23.Deckert-Gaudig T., Deckert V. Tip-enhanced Raman scattering (TERS) and high-resolution bio nano-analysis—a comparison. Phys. Chem. Chem. Phys. 2010;12:12040–12049. doi: 10.1039/c003316b. [DOI] [PubMed] [Google Scholar]
- 24.Ichimura T., Fujii S., Kawata S. Subnanometric near-field Raman investigation in the vicinity of a metallic nanostructure. Phys. Rev. Lett. 2009;102:186101. doi: 10.1103/PhysRevLett.102.186101. [DOI] [PubMed] [Google Scholar]
- 25.Camden J.P., Dieringer J.A., Van Duyne R.P. Controlled plasmonic nanostructures for surface-enhanced spectroscopy and sensing. Acc. Chem. Res. 2008;41:1653–1661. doi: 10.1021/ar800041s. [DOI] [PubMed] [Google Scholar]
- 26.Wu X.B., Zhang M.Q., Tian Q. Experimental research on double-walled carbon nanotubes by using tip-enhanced Raman spectroscopy. Journal of the Korean Physical Society. 2010;56:1103–1108. [Google Scholar]
- 27.Frushour B.G., Koenig J.L. Raman scattering of collagen, gelatin, and elastin. Biopolymers. 1975;14:379–391. doi: 10.1002/bip.1975.360140211. [DOI] [PubMed] [Google Scholar]
- 28.Jastrzebska M., Wrzalik R., Cwalina B. Raman spectroscopic study of glutaraldehyde-stabilized collagen and pericardium tissue. J. Biomater. Sci. Polym. Ed. 2003;14:185–197. doi: 10.1163/156856203321142605. [DOI] [PubMed] [Google Scholar]
- 29.Lin-Vien D. Academic Press; Boston, MA: 1991. The Handbook of Infrared and Raman Characteristic Frequencies of Organic Molecules. [Google Scholar]
- 30.Eysel H.H., Lim K.T. Raman intensities of phosphate and diphosphate ions in aqueous-solution. J Raman Spectrosc. 1988;19:535–539. [Google Scholar]
- 31.Stewart S., Fredericks P.M. Surface-enhanced Raman spectroscopy of peptides and proteins adsorbed on an electrochemically prepared silver surface. Spectrochim. Acta [A] 1999;55:1615–1640. [Google Scholar]
- 32.De Gelder J., De Gussem K., Moens L. Reference database of Raman spectra of biological molecules. J Raman Spectrosc. 2007;38:1133–1147. [Google Scholar]
- 33.Stranahan S.M., Willets K.A. Super-resolution optical imaging of single-molecule SERS hot spots. Nano Lett. 2010;10:3777–3784. doi: 10.1021/nl102559d. [DOI] [PubMed] [Google Scholar]
- 34.Dollish F.R., Fateley W.G., Bentley F.F. Wiley; New York: 1974. Characteristic Raman Frequencies of Organic Compounds. [Google Scholar]
- 35.Jeffers R.B., Cooper J.B. FT-surface-enhanced Raman scattering of phenylalanine using silver-coated glass fiber filters. Spectrosc. Lett. 2010;43:220–225. [Google Scholar]
- 36.Deckert-Gaudig T., Rauls E., Deckert V. Aromatic amino acid monolayers sandwiched between gold and silver: a combined tip-enhanced Raman and theoretical approach. J. Phys. Chem. C. 2010;114:7412–7420. [Google Scholar]
- 37.Joo S.W., Kim K. Adsorption of phenylacetylene on gold nanoparticle surfaces investigated by surface-enhanced Raman scattering. J Raman Spectrosc. 2004;35:549–554. doi: 10.1366/000370204322842968. [DOI] [PubMed] [Google Scholar]
- 38.Ferraro J.R., Nakamoto K. Academic Press; Boston, MA: 1994. Introductory Raman Spectroscopy. [Google Scholar]
- 39.Anema J.R., Brolo A.G., Bittencourt C. Surface-enhanced Raman scattering from polystyrene on gold clusters. J Raman Spectrosc. 2010;41:745–751. [Google Scholar]
- 40.Pande J., Pande C., Kägi J.H. Raman, infrared, and circular dichroism spectroscopic studies on metallothionein: a predominantly “turn”-containing protein. Biochemistry. 1986;25:5526–5532. doi: 10.1021/bi00367a027. [DOI] [PubMed] [Google Scholar]
- 41.Chou P.Y., Fasman G.D. Prediction of protein conformation. Biochemistry. 1974;13:222–245. doi: 10.1021/bi00699a002. [DOI] [PubMed] [Google Scholar]
- 42.Copeland R.A., Spiro T.G. Ultraviolet Raman hypochromism of the tropomyosin amide modes—a new method for estimating α-helical content in proteins. J. Am. Chem. Soc. 1986;108:1281–1285. [Google Scholar]
- 43.McColl I.H., Blanch E.W., Barron L.D. A new perspective on β-sheet structures using vibrational Raman optical activity: from poly(L-lysine) to the prion protein. J. Am. Chem. Soc. 2003;125:10019–10026. doi: 10.1021/ja021464v. [DOI] [PubMed] [Google Scholar]
- 44.Staple D.B., Loparic M., Kreplak L. Stretching, unfolding, and deforming protein filaments adsorbed at solid-liquid interfaces using the tip of an atomic-force microscope. Phys. Rev. Lett. 2009;102:128302. doi: 10.1103/PhysRevLett.102.128302. [DOI] [PubMed] [Google Scholar]
Associated Data
This section collects any data citations, data availability statements, or supplementary materials included in this article.