

Abstract
Increasing experimental evidence has shown that membrane protein functionality depends on molecular composition of cell membranes. However, the origin of this dependence is not fully understood. It is reasonable to assume that specific lipid-protein interactions are important, yet more generic effects due to mechanical properties of lipid bilayers likely play a significant role too. Previously it has been demonstrated using models for elastic properties of membranes and lateral pressure profiles of lipid bilayers that the mechanical properties of a lipid bilayer can contribute as much as ∼10 kBT to the free energy difference associated with a change in protein conformational state. Here, we extend those previous approaches to a more realistic model for a large mechanosensitive channel (MscL). We use molecular dynamics together with the MARTINI model to simulate the open and closed states of MscL embedded in a DOPC bilayer. We introduce a procedure to calculate the mechanical energy change in the channel gating using a three-dimensional pressure distribution inside a membrane, computed from the molecular dynamics simulations. We decompose the mechanical energy to terms associated with area dilation and shape contribution. Our results highlight that the lateral pressure profile of a lipid bilayer together with the shape change in gating can induce a contribution of ∼30 kBT on the gating energy of MscL. This contribution arises largely from the interfacial tension between hydrophobic and hydrophilic regions in a lipid bilayer.
Introduction
It is known that the functionality of many membrane proteins is sensitive to the lipid environment (1). Mechanosensitive channels and rhodopsin are classical examples of such proteins (2,3). However, although some of these cases can be explained by specific interactions between lipids and proteins, often the generic mechanical properties of lipid bilayers play a significant role too (1,4). In the same spirit it has been suggested (5,6) that anesthetics may work by modifying the mechanical properties of cell membranes.
The effect of mechanical properties of membranes on embedded proteins has been studied using the elastic deformation model (4,7–12). In such a model, lipid bilayer deformation energies are usually divided into four components: thickness deformations due to hydrophobic mismatch, area dilation, midplane bending, and curvature frustration. An alternative way to analyze the mechanical energy is to use the so-called lateral pressure profile (13–16), which depicts the nonuniform pressure distribution in a lipid bilayer to arise from the inhomogenous nature of lipid bilayers (17,18). The main idea in this approach is that, when a protein goes through a transition where its cross-sectional area profile across the membrane is changed, work has to be done against the pressure profile of the bilayer. For small area changes, this work can be written as a function of elastic coefficients, and it can be shown that the elastic deformation model is then just a lower-order approximation of the pressure profile model (9,14,16).
In the elastic model, the deformation energy is related to the membrane's elastic coefficients, which are measurable quantities. Using known elastic coefficients and a simple approximation for the cross-sectional area change, deformation energies have been estimated to be ∼10 kBT (9,10). Similar estimates have been made using lateral pressure profiles calculated from molecular dynamics (MD) simulations, and the results have been observed to vary (1–10) kBT (19–22). Yet, it has been previously noted (20) that the resulting energy is very sensitive to inaccuracies in the cross-sectional area of membrane proteins. In practice, there are no membrane proteins for which the structure of both the closed and the open states are known with sufficient accuracy. For this reason, previous studies have been forced to use simple approximations for protein shape and thus the results have only hinted at the possibility of the protein shape change having a significant contribution to the transformation energy.
The open-closed transition of one particular membrane protein, the mechanosensitive channel of large conductance (MscL) is, however, amenable through coarse-grained MD simulations (23). In this work, we calculate the energy cost of the shape change associated with the activation of this channel, based on the changes in cross-sectional area and lateral pressure profiles during the simulated gating of MscL. In contrast to previous approximations, we find complex cross-sectional area changes that lead to a ∼30 kBT shape contribution in the gating process, significantly higher than previously expected.
Theory
In this section, we give a short overview of the existing theoretical framework used to analyze the contribution of a membrane to the energetics of channel gating. We also provide, according to our understanding, a new way to decompose the gating energy to contributions that result from different physical factors—particularly those highlighting the role of the shape change of a protein.
Membrane contribution to channel gating energetics
The ratio between the probability of MscL to be open (Po) or closed (Pc) can been written as
| (1) |
where ΔG = Gopen – Gclosed is the free energy cost of channel opening (4,8,24,25). The free energy cost can be decomposed into an area dilation term γΔA, a membrane deformation term ΔGmembrane, and a change in protein's energy ΔGprotein (4),
| (2) |
The change in direct interaction energy between a membrane and a protein is included here in ΔGprotein to make the analysis consistent with patch-clamp studies (24,26) Using patch-clamp experiments, it is possible to measure the ratio Po/Pc in Eq. 1 as well as the surface tension γ in Eq. 2 (24,26). However, ΔA, ΔGmembrane, and ΔGprotein are difficult to determine independently. Values for ΔA and ΔGprotein have been achieved (24,25) by neglecting ΔGmembrane and then fitting experimental data for Po/Pc and γ into Eqs. 1 and 2. The results vary roughly between ΔA ≈ (6.5–20) nm2 and ΔGprotein ≈ (18.6–51) kBT depending on the fitting procedure (24,25). In an alternative approach, the ΔGmembrane term is also neglected, and the gating tensions and sensitivities to tension are gathered from several different studies. By doing so, one has found an approximative result of ΔGprotein ≈ 14 kBT (26). Note that, in this approach, one assumes a two-state model for the channel. According to patch-clamp studies, this assumption is reasonable for wild-type MscL but not necessarily for MscL mutants or other channels (25,27).
The possible significance of ΔGmembrane has been widely recognized recently (4,7–12,14–16,19–21). In several studies (4,7–12), the membrane deformation component has been decomposed to separate contributions that are then approximated from known elastic properties of lipid bilayers. The separate contributions to ΔGmembrane in these studies are usually the hydrophobic mismatch energy, midplane bending energy due to asymmetric lipid bilayer or protein shape, and curvature frustration energy due to lipid spontaneous curvature and protein shape. Using elastic properties, these components have been predicted to have a significant contribution to the free energy of membrane protein conformations (for a review, see (4)).
In other studies (14–16,19–22), the membrane deformation energy has been analyzed using pressure profiles of lipid bilayers. The lateral pressure profile p(z) shows the distribution of lateral pressure across an interface as a function of the normal coordinate z. Due to the inhomogenous nature of a lipid bilayer, the lateral pressure profile of a lipid membrane is markedly nonuniform with a characteristic profile. On the one hand, the water-lipid interface of a membrane wants to shrink due to the interfacial tension between water and hydrophobic lipid parts. On the other hand, headgroup and tail regions want to expand due to entropic, electrostatic, and steric interactions (17,18). When embedded in a lipid bilayer, a protein feels the nonuniform pressure from the membrane. If the change in cross-sectional area is known between two states of the protein, the work W done against the pressure profile can be calculated from (14–16)
| (3) |
If the cross-sectional area ΔA(z) is expanded using a Taylor series, Eq. 3 can also be written in terms of elastic coefficients (14,16). Thus, the elastic deformation model is a lower-order approximation of the pressure profile model, instead of being an independent one (14,16,9). It is also important to point out that the work calculated using Eq. 3 contains also the pure area expansion, i.e., γΔA in Eq. 2.
Previously, the membrane deformation energy arising from a change in the protein shape has been approximated by taking the pressure profile from simulations and assuming a simple geometrical shape transformation, e.g., from a cylinder to a cone, for the protein (15,19–21). The calculated energies for MscL vary (1–10) kBT, which is in agreement with the approximation from the elastic theory as discussed above.
Membrane deformation energy decomposed into area dilation, shape contribution, and hydrophobic mismatch terms
Our goal is to analyze the shape dependence of MscL gating energy without approximations with regard to elastic properties, or any assumptions of a simple shape change. For this purpose, we decompose the free energy cost of gating (Eq. 2) in a new way, as
| (4) |
where ΔEpp is the work done against the pressure profile, ΔEmp is the change in midplane bending energy, and ΔEmm is the change in hydrophobic mismatch energy. ΔGrest contains all other free energy changes, including ΔGprotein from Eq. 2, and any changes in specific lipid-protein interactions. As is shown below, ΔEpp contains area dilation and curvature frustration components.
To calculate ΔEpp, we first use Eq. 3 to calculate the mechanical work of creating a cavity with cross-sectional area A(z) into a bilayer having the pressure profile p(z) (14,19),
| (5) |
Then we decompose the cross-sectional area A(z) into two components: a constant average area Ao and a z-dependent shape variation δA(z) around Ao:
| (6) |
Inserting this decomposition into Eq. 5, we get
| (7) |
By using the connection (28) between the pressure profile and the surface tension of a membrane
and by defining
we arrive at
| (8) |
The first term gives the work done against a cylindrical inclusion with an area of Ao, and the second term gives the work done against shape variations δA(z). It should be noted that because both A(z) and p(z) depend on the total tension γ, also Wshape depends implicitly on γ.
To estimate ΔEpp we first have to calculate the mechanical work of insertion for both closed and open states separately using Eq. 5,
| (9) |
Then we need to calculate the work −Wclosed done when a closed channel is removed from a membrane and the work Wopen done when an open channel is inserted back into the membrane. ΔEpp is then equal to the net work done in the process, given by
| (10) |
where the decomposition of Eq. 8 has been applied. Now we see that ΔEpp indeed contains the area dilation term of Eq. 2. The second term ΔEshape (γ) corresponds to the curvature frustration term in elastic models. In this work, we calculate these terms from MD simulation models without the assumptions underlying the elastic theory. We also give order-of-magnitude estimates for the midplane-bending term ΔEmp and for the hydrophobic mismatch term ΔEmm. All other energy terms which we do not analyze are joined together and described through ΔGrest. (Note that only ΔEpp, ΔEmp, and ΔEmm are assumed to depend on tension.)
We determine Ao, A(z), and p(z) for both the open and the closed states of MscL using MD simulations as described in Methods. Then we can calculate γΔAo and ΔEpp using Eqs. 9 and 10. Finally, we can also determine the shape contribution using Eq. 10.
Methods
The objective of the work is to study the components of mechanical work in MscL gating using Eqs. 9 and 10. To do so, we need to calculate the cross-sectional area A(z) and the pressure p(z) felt by the protein under different tensions γ for both the open and the closed states. We will also need to determine the average change of the cross-sectional area ΔAo in the closed-open transition.
Simulated systems
The MARTINI coarse-grained (CG) model (29,30) and GROMACS 4.0 simulation package (31) were used for all the MD simulations. All simulation systems were coupled to a Berendsen temperature bath at 310 K and surface tension was kept constant by using a semiisotropic Berendsen pressure coupling (32). Periodic boundary conditions were used in all simulations. A MARTINI CG model of MscL has been shown to activate when the membrane is subjected to a high enough tension (23,33). In this work, we have used the model to analyze the release of mechanical energy in a lipid bilayer when the channel is opened.
A closed state of MscL from Tuberculosis mycobacterium has been resolved (34) by x-ray crystallography (PDB: 2OAR) and was used as the basis for the CG model. The protein was first inserted into a symmetric bilayer of 504 DOPC lipids. To preserve the equal distribution of lipids in both leaflets, the insertion was done in four steps:
-
Step 1.
Placing the protein at a correct membrane-spanning position judged from the trans-membrane helices,
-
Step 2.
Radially shifting all lipids away from the protein's center-of-mass to make room for the protein, while preserving the original membrane area,
-
Step 3.
Solvating the system with 17,565 water beads, and
-
Step 4.
Simulating the system for 12 ns to equilibrate it.
Note that the times reported in this article are scaled by a factor of 4, to account for the faster effective sampling in MARTINI, as judged by a higher diffusion rate in the liquid phase (29). To open the channel, the tension was gradually increased in a stepwise manner from 0 mN/m to 60 mN/m, in 10 mN/m steps. Simulation time in each step was 12 ns. Then the tension was further increased to 65 mN/m and the activation of MscL was observed after simulation of 1.88 μs. The system with the open channel was solvated with 6995 additional water beads (totaling 24,560 water beads) to avoid any interaction between periodic images, as the system gets thinner at higher tensions. The final structures obtained at each level of tension were subsequently used as starting points for two sets of simulations: one for the closed (Set 1), and one for the open state (Set 2).
In Set 1, the closed structure was simulated for 2.4 μs at tension levels of 0, 10, 20, 30, and 40 mN/m. Small tension-induced changes in the protein structure were observed during the simulation, but the protein stayed inactive in all cases. By inactive, we mean that there is no significant water flux through the channel.
In Set 2, the postactivation, i.e., the open state of MscL, was simulated for the same range of tensions (0, 10, 20, 30, and 40 mN/m). The length of the simulation was 1.92 μs for the tensions 30 and 40 mN/m, and it was extended to 3.84 μs for the lower tensions 0, 10, and 20 mN/m due to longer equilibration time. Once more, some changes in the protein structure occurred in response to the tension, but the protein stayed active as judged from a significant water flow through the channel.
The systems were considered to be in a metastable state after the area of the membrane and the radius of gyration of the protein converged. This state was reached after ∼400–500 ns in most cases, except for the open channel at low tension which required (2–2.5) μs equilibration time. The analysis of area and pressure profiles was performed after this time point in each case.
Calculation of the area profile
To exploit Eq. 9, we need the cross-sectional area profile which the membrane protein complex occupies in the bulk bilayer. The cross-sectional area (for each membrane-normal coordinate value) was defined to contain the protein itself and all the water and lipid components interposed between the protein-lipid boundary (as defined in the following paragraph) and the center of the protein.
In practice, using this definition the area as a function of the position along the membrane normal was determined in the following way. First, the system was divided into a three-dimensional grid of 0.3-nm cubic cells. Each cell was then labeled either as type 0 for empty cells, as type 1 for cells that contain at least one protein bead, or as type 2 for occupied cells that do not contain protein beads. All type 0 cells that were next to a type 1 cell were then switched to type 1 to include possible empty cells between bulk bilayer and the protein. Then for each position z along the membrane normal, the protein-lipid boundary was determined. This was done by tracking the path from the center of the protein to the edge of the system to locate the farthest type 1 cell. All the cells in this path up to the farthest cell of type 1 were then also marked as type 1. This procedure was repeated for all possible directions. The area of all type 1 cells was then added up and defined as the cross-sectional area of the protein with the corresponding z coordinate. This procedure was repeated for all values of z.
The rotation of the protein in the x,y plane was removed from the simulation trajectory before the above analysis. The resolution used for the grid was rather low (0.3 nm). A higher resolution would be questionable due to the coarse-grained nature of the model used. However, to estimate the dependence of the results on the grid size, we performed the analysis also with a grid size of 0.15 nm. We found that the shape did not change. The cross-sectional area decreased roughly 15%, the insertion energies decreased ∼10%, and the energy differences between the states lowered ∼20%. However, because the shape is not affected, the conclusions about shape change-induced effects are not affected.
The constant average area Ao defined in Eq. 6 was calculated as the average cross-sectional area over all z that were considered to be in the bilayer region. In this work, the bilayer region is defined as the one where lipid density is larger than water density.
Calculation of pressure profiles
Generally, the pressure field of a system is defined as the pressure tensor P(r), which depends on all spatial coordinates (35). From geometrical symmetry and the mechanical stability condition ∇ · P = 0, it follows that P is diagonal, Pzz is constant, and lateral components are equal and depend only on the normal coordinates Pxx (z) = Pyy (z) for a homogeneous fluid bilayer (28). The so-called lateral pressure profile used in Eqs. 3, 5, and 9 is defined as (28)
An inclusion, such as a protein, breaks the symmetry in the (membrane) x,y plane. Protein-lipid interactions generate line tension between the protein and the lipids, which leads to different lateral pressures (and tensions) in the protein and lipid regions (36). In principle, the line tension could be determined from the tension difference between the inside of the inclusion and the bulk bilayer (36). However, it is not possible to define a clear bulk region inside a realistic protein inclusion due to the small size and the complex structure of the object. Thus, in practice the line tension between a protein and a lipid membrane is hard to define.
Instead, we assume that a protein inclusion is put into a bulk bilayer, where Pxx (z) = Pyy (z). Then we calculate the pressure in the bulk membrane and use this pressure in Eqs. 3, 5, and 9 to calculate the work done when a protein is included into the membrane. The advantage of this approach is that we do not need to take into account the direction of the membrane-protein boundary because the lateral components are equal and the pressure is equal in all directions in the plane. The protein shape is taken implicitly into account in the calculation of the cross-sectional area.
Nonetheless, this assumption is valid only if the protein does not change the pressure profile of a lipid bilayer in its close vicinity. This could happen, for example, if the protein would generate an ordered lipid domain around itself. However, we have already demonstrated in our previous work that the pressure profile and the related physical quantities reach their bulk values very close to the MscL boundary in a DOPC bilayer (35).
To calculate the pressure in the bulk bilayer region, the system was first divided into a three-dimensional grid with an edge-length of 0.3 nm. The local pressure tensor was then analyzed for each grid point using a recently developed method (35). The pressure profile in the bulk membrane was obtained by averaging over the x and y coordinates located in the bilayer region. The bilayer region is defined to start where the cross-sectional area of the protein inclusion ends, as defined in the previous section. This method is essentially identical to the one in traditional lateral pressure profile calculations for a bulk lipid bilayer (37,38), with the exception that averages are now taken only over the bulk membrane phase instead of the whole system. In principle, it is possible that one combines a pressure profile from a pure membrane simulation with an area profile from a membrane protein simulation to achieve the same results.
Results and Discussion
Below, we first describe the different states of the protein together with the calculated shape and pressure profiles. Next, we calculate the work associated with embedding the channel in its different states into the membrane, followed by the calculation of the mechanical energy contribution to the gating process. Further, we move on by dividing the mechanical energy into the area-dilation and shape-change contributions, also making a link between the shape change and interfacial tension. Finally, we discuss the effect of hydrophobic mismatch.
Protein states used in analysis
Because our goal is to calculate ΔEpp as defined in Eq. 10, the relevant properties we need to quantify are the cross-sectional area of the protein and the pressure felt by the protein. The cross-sectional area profiles and the pressure exerted on the protein are shown in Fig. 1 for both the open and closed states at tensions between 0 and 40 mN/m.
Figure 1.
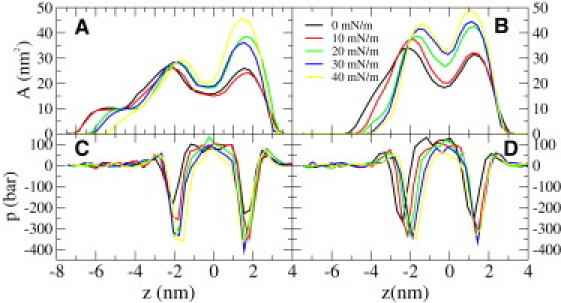
(A and B) Cross-sectional area profiles for the closed∗ and the open channel under different tensions, respectively. (C and D) Pressure profiles felt by the closed∗ and the open channel under different tensions, respectively. The black line in panel A corresponds to the initial closed state. Negative z values denote the cytoplasmic side. The z axis is set such that the center of mass of the protein lies at z = 0 for all the systems.
A first observation is that in both states the largest cross-sectional area is found at the location of the interfacial peak on the extracellular side in the pressure profile. In addition to the basic shape of the protein, a plausible explanation for this is that the protein adapts to the pressure distribution (exerted by the bilayer) by expanding itself in the interfacial region. This expansion lowers the energy of the bilayer because the area of close contact between water and hydrophobic parts shrinks.
From Fig. 1 A we see that the area profile changes immediately when tension is increased above 10 mN/m, even though the channel remains closed (i.e., there is no significant flux through the channel). In particular, we see a tension-dependent area increase on the extracellular side of the protein whereas the cross-sectional area on the cytoplasmic side is almost constant, varying between 25 and 30 nm2 for all tensions. Intriguingly, by comparing Fig. 1, A and B, we see that the largest cross-sectional area difference between the open and the closed states is on the cytoplasmic side. The cross-sectional area for the open state is between 35 and 45 nm2 for all tensions.
These observations suggest that the expansion of the extracellular side is not sufficient for the gating of MscL but that it requires the expansion of the cytoplasmic side as well. This observation is in agreement with the idea of a hydrophobic lock located in the cytoplasmic region (39), and with the observation that asymmetric inclusion of lysolipids on the extracellular side opens the channel (40). When lipids are added to the extracellular side, the relative tension of the extracellular side will decrease and the relative tension on the cytoplasmic side will increase (41). Increased tension would prefer expansion of the cytoplasmic side of the protein, which according to our results is indeed required for gating.
Inspired by the results shown in Fig. 1, we divide the tension-induced gating into two steps:
-
Step 1.
An immediate expansion of the periplasmic side that does not open the channel.
-
Step 2.
An eventual expansion of the cytoplasmic side that opens the channel.
Thus, we see three different states of MscL in our simulations:
-
State 1.
Initial closed state.
-
State 2.
Expanded closed state (denoted here as closed∗).
-
State 3.
Open state.
These steps and states are illustrated in Fig. 2. The closed∗ state corresponds to the one which is deformed due to membrane tension but is still closed. This state is not necessarily experimentally relevant, because it differs from the initial closed state only for tensions above 20 mN/m. Even then, it may not be stable, but instead an unstable configuration that is opening slowly. For this reason, we think that the energy difference between the initial closed state and the open state is more comparable to the experimental free energy difference between the closed and open structures. We have analyzed the data for all tensions up to 60 mN/m, since the precise gating tension of the simulation model is uncertain.
Figure 2.
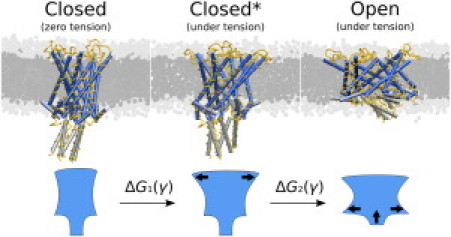
The gating process divided into immediate deformation after an increase in tension (Step 1) and the actual gating (Step 2). A schematic presentation of the shape change of the protein during the close-to-open transition is shown at the bottom. The ΔGn(γ) denotes the total free energy change during a transition n (n being either one or two).
In the next section, we calculate for step (transition) 1 and for transition 2. In the same manner, we denote changes in the average cross-sectional area of a protein during the two transitions: and , the total change being . This two-stage opening is in full accordance with earlier models, suggesting an initial tilting of trans-membrane helices, followed by lateral expansion of the channel core (3,24).
Mechanical work for protein insertion
The pressure profiles and cross-sectional area profiles, shown in Fig. 1, were used to calculate (Eq. 9) the mechanical work exerted by a bilayer when the MscL protein is embedded into a bilayer. Three different states of the protein were considered, namely the closed, closed∗, and open states (compare to Fig. 2). The cross-sectional area for the initial closed state is, by definition, the area under zero tension. The cross-sectional areas for the closed∗ and open structures were calculated from simulations under different tensions and are shown in Fig. 1, A and B. In addition, the pressure profiles felt by the protein were calculated under each tension (see Fig. 1, C and D).
To calculate the work for the initial closed state under each tension, we take its area from the zero tension simulation and use the pressure profiles from the simulations for each tension. For the closed∗ and open states, both the area and the pressure profile are taken from corresponding tensions. Given these, we can calculate the mechanical work for insertion for all defined states as Wclosed, Wclosed∗, and Wopen. Furthermore, we can compute the mechanical energy changes separately for both steps, getting and . This description corresponds to an idea where a closed protein first rapidly expands (Step 1) and then slowly opens (Step 2) when put under tension. The total change in bilayer mechanical energy in gating would then be the sum of the energy changes during the two steps. This energy is expected to decrease when tension is increased, because MscL is known to open with increasing tension.
The calculated energies are shown in Fig. 3 A from which we see that those are negative. What is more, they become even more negative when tension is increased, which means that the bilayer energy decreases when an inclusion such as MscL is inserted. Under tension, this is expected because any inclusion that decreases the bilayer area would release energy by γA0 (8). However, we see a significant negative energy even without a tension when the area dilation component is clearly zero. This is due to the large area of the protein at the interfacial region, which decreases contacts between water and hydrophobic parts of the membrane. Our results suggest that there is a significant decrease in energy if a protein adapts to bilayer stress by increasing its area in the interfacial region. This behavior might also play an important role, e.g., in membrane-protein folding, which at least for some proteins is known to depend on bilayer properties (42,43).
Figure 3.
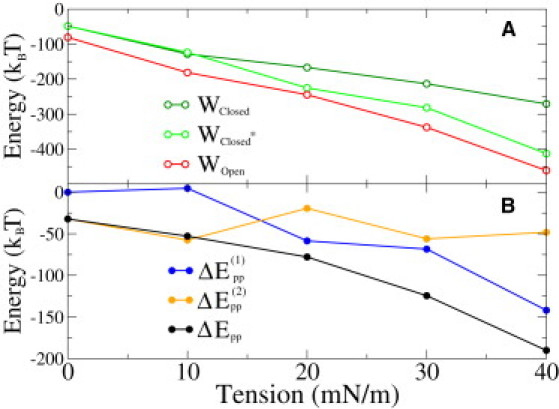
(A) Release of mechanical energy due to an inclusion of MscL in different states under different tensions as calculated by Eq. 9. (B) Change of mechanical energy between different states under different tensions as given by Eq. 10.
Mechanical energy of gating
The results shown in Fig. 3 A enable us to calculate (Eq. 10) the mechanical work done by the bilayer in both gating steps, and . The results are shown in Fig. 3 B, along with the total work . According to our results, the total mechanical work done by a bilayer is negative for all tensions, which means that the bilayer energy is favorable for the open state under all tensions, even at zero tension (Fig. 3).
From Eq. 1 we see that when Po/Pc = 1, then ΔG = 0 and the probability to be in the open state is equal to the probability to be in the closed state. Experimentally the tension for which Po/Pc = 1, i.e., the gating tension, is ∼10 mN/m (24,25). By neglecting the ΔGmembrane term from Eq. 2 and by fitting to experimental data, one has found a result of ΔGprotein ≈ (18.6–51) kBT (24,25). Based on our results, we can now try to make a more accurate estimate.
Although the gating tension is ∼10 mN/m in experiments, in simulations we need higher tensions (65 mN/m) to observe the opening of the channel within timescales that are feasible in simulations. If the simulation timescale could be extended considerably, then the tension required for opening the channel would likely decrease; yet the current computational resources limit us to enforce gating to take place at the microsecond timescale instead of the natural, millisecond timescale of MscL gating (27), warranting the use of a higher tension. Although we do not know the exact MscL gating tension in the MARTINI model, we expect it to be smaller than 65 mN/m.
Nevertheless, if we assume a 10 mN/m gating tension and neglect the ΔEmp and ΔEmm terms from Eq. 4, we see from the results in Fig. 3 B that ΔGrest ≈ 50 kBT. The neglect of the midplane bending ΔEmp and hydrophobic mismatch terms ΔEmm is justified in the Supporting Material. The ΔGrest contains contributions for changes in protein's internal energy and specific lipid-protein interactions ΔGprotein. Under these assumptions, we arrive at a gating energy that is similar to the largest energies achieved by fitting to experimental data. The difference is that our area difference is smaller than previously suggested (25), and that almost half of the energy originates from the shape deformation as detailed in the next section.
Gating work divided into area and shape contributions
In experimental studies where the gating energy ΔGprotein was calculated, it was assumed that the tension-dependent free energy release arises completely from area dilation (24–26). However, in our analysis we take into account both the area dilation and the shape change contribution (see Eq. 10). Using our results, we can calculate both contributions separately.
The pure area dilation component in Eq. 10, γΔA0, can be calculated if the change in the average cross-sectional area is known. Average cross-sectional areas have been calculated as described in Methods, and they are shown for the closed∗ and open states under different tensions in Fig. 4 A. The cross-sectional area for the initial closed state is given by the profile of a closed protein under zero tension. Fig. 4 B depicts the changes in average area for both steps separately and also for the complete gating process.
Figure 4.
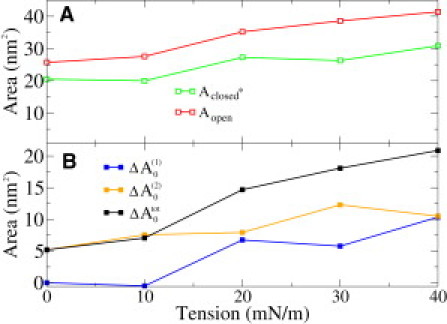
(A) Average areas of closed∗ and open states under different tensions. Average area for the initial closed state is Aclosed ≈ 21 nm2, which is the area of the closed state under zero tension. (B) Changes in average areas in different steps.
The left-hand side of Eq. 10, ΔEpp, has already been calculated in the previous section (compare to Fig. 3 B), allowing us to extract the shape contribution of the mechanical work ΔEshape. In Fig. 5 we show the area dilation γΔA, the shape contribution ΔEshape (γ), and the total bilayer mechanical work ΔEpp (γ).
Figure 5.
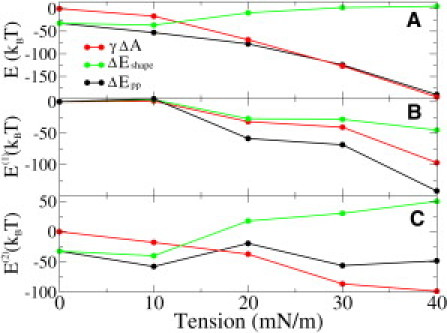
Gating work divided into area and shape contributions: (A) for complete gating, (B) for Step 1, and (C) for Step 2.
At zero tension, the area component is obviously zero. Thus the ∼30 kBT preference for the open state under these stress-free conditions must result from the shape contribution as clearly noticed from Fig. 5 A. As expected, when tension is increased the area dilation contribution becomes more negative, because tension prefers the open state due to its larger area. However, the shape contribution behaves in an opposite fashion. From Fig. 5 A we see that, with increasing tension, the shape preference for the open state becomes weaker, and at a tension of 20 mN/m, the preference is practically lost. Due to competition between these contributions, the dependence of work on tension is weaker than expected only by looking at the area dilation component. In an experimental fit, this slope is related to the area change in gating (24,25). Our results thus suggest that the area change and the gating energy calculated from the experimental fit are too small because the shape energy is not taken into account. The slight nonlinearity in tension dependence found recently (25) could arise from the shape dependence of the opening probability.
By comparing Fig. 5, B and C, we see that at 0 mN/m and 10 mN/m most of the work is done in Step 2. The reason for this is that the closed state does not deform under these tensions (compare to Fig. 1 A). With a higher tension, there is an immediate deformation of the closed state (Step 1) and also work related to that. In Step 1, the area and shape contributions are close to each other, being negative and becoming more negative with increasing tension. This is understandable, because in Step 1 the extracellular side undergoes considerable expansion with higher tensions, leading to significant area and shape contributions (compare to Fig. 1). However, the energetics of Step 2 behaves differently. The area component decreases nearly linearly from 0 to ∼100 kBT, but the shape component behaves almost in an opposite manner, weakening the tension dependence of ΔEpp (γ).
Significant shape contribution comes from interfacial tension
In the previous section we argued that the energy contribution from a shape change of a protein, in our case MscL, can be as large as 30 kBT. This is significantly higher than previous estimates, which vary (0–10) kBT (9,10,19–22). The main reason for the difference is that in previous studies one assumed simple cylinder-cone-like shape transitions. In our simulations we see large area changes at the location of the interface between the hydrophobic interior of the bilayer and the aqueous surroundings. When the area of the protein is increased at this region, it reduces the contact between water and the hydrophobic part of a bilayer, thus lowering the hydrophobic energy of the bilayer.
To give an order-of-magnitude approximation for the hydrophobic energy change associated with a nanoscopic area change, we calculate the energy release when the area of an interface under a tension of 30 mN/m is decreased by 5 nm2. A value of 30 mN/m is a reasonable approximation for the hydrophobic energy density of the hydrocarbon water interface (17), and 5 nm2 is a realistic local change for the protein area (see our results above and (24,25)). The released energy can be simply approximated by
This demonstrates that small area changes at the lipid-water interface can have a significant energetic effect.
Midplane bending and hydrophobic mismatch
In previous sections we have omitted the changes related to the midplane bending energy ΔEmp and the hydrophobic mismatch energy ΔEmm. In the Supporting Material, we make order-of-magnitude estimates of these energetic changes in the gating of MscL by using simple models introduced in Wiggins and Phillips (7) and Marsh (44). According to our results, the tension-induced changes in midplane bending energy and hydrophobic mismatch energy are negligible compared to the energy arising from the pressure profile component. Thus, neglect of ΔEmp and ΔEmm terms in Eq. 4 is justified.
Conclusions
Based on coarse-grained simulations of the gating of a mechanosensitive membrane protein, MscL, we calculated the differences in bilayer mechanical energy during the gating process. We decomposed this energy into an area dilation component and a component associated with protein shape. These components were calculated using the cross-sectional area of the protein and the pressure felt by the protein. We found that the bilayer prefers an open state even at zero tension due to a large energetic component of 30 kBT arising from shape changes. This contribution is possibly important when interpreting, for example, patch-clamp experiments to any protein which undergoes changes in its cross-sectional area. When tension is increased, this component decreases, but then the area dilation component gives a significant preference for the open state.
Our results show that the shape of a protein is likely to have an even larger influence on protein energetics than what has been previously estimated ((0–10) kBT (9,10,19–22)). The reason for the difference is the assumption of very simple protein shapes used in previous studies. We observed that MscL adapts to the pressure profile of a lipid bilayer by taking a shape which is expanded at the interfacial regions. This shape change causes a significant energy release, reducing the interfacial energy between the lipid bilayer interior and the aqueous surroundings.
We conclude that the pressure profile can have an important role in triggering conformational changes of membrane proteins. It is important to note that the analysis performed in this work does apply not only to MscL but also to any protein which undergoes similar conformational changes. Even transformations under zero tension can have significant mechanical energy components due to nonuniform protein shape changes within the bilayer.
The methodology presented in this work can be used to calculate the mechanical contribution of gating energy also in bilayers with different lipid compositions. For example, if the functionality of MscL and rhodopsin depended on lipid composition due to a change in pressure profiles, as suggested before (2,3), then one should be able to see the differences by performing an analysis similar to the one conducted in this work. In general, if membrane protein structures are known in active as well as in-active states, then we can predict how protein activation depends on lipid composition if it is dominated by the mechanics of a lipid bilayer.
Acknowledgments
CSC-IT Center for Science and the HorseShoe computing cluster at the University of Southern Denmark are thanked for computing resources.
We acknowledge the support given by the Academy of Finland (OHSO, IV), the Finnish National Graduate School in Nanoscience (OHSO), and the Finnish Cultural Foundation (OHSO). The Netherlands Organisation for Scientific Research supported this work through Top grant No. 700-57-303 (S.J.M. and M.L.).
Supporting Material
References
- 1.Lee A.G. How lipids affect the activities of integral membrane proteins. Biochim. Biophys. Acta. 2004;1666:62–87. doi: 10.1016/j.bbamem.2004.05.012. [DOI] [PubMed] [Google Scholar]
- 2.Brown M.F. Modulation of rhodopsin function by properties of the membrane bilayer. Chem. Phys. Lipids. 1994;73:159–180. doi: 10.1016/0009-3084(94)90180-5. [DOI] [PubMed] [Google Scholar]
- 3.Perozo E., Kloda A., Martinac B. Physical principles underlying the transduction of bilayer deformation forces during mechanosensitive channel gating. Nat. Struct. Biol. 2002;9:696–703. doi: 10.1038/nsb827. [DOI] [PubMed] [Google Scholar]
- 4.Phillips R., Ursell T., Sens P. Emerging roles for lipids in shaping membrane-protein function. Nature. 2009;459:379–385. doi: 10.1038/nature08147. [DOI] [PMC free article] [PubMed] [Google Scholar]
- 5.Cantor R.S. The lateral pressure profile in membranes: a physical mechanism of general anesthesia. Biochemistry. 1997;36:2339–2344. doi: 10.1021/bi9627323. [DOI] [PubMed] [Google Scholar]
- 6.Cantor R.S. The lateral pressure profile in membranes: a physical mechanism of general anesthesia. Toxicol. Lett. 1998;100-101:451–458. doi: 10.1016/s0378-4274(98)00220-3. [DOI] [PubMed] [Google Scholar]
- 7.Wiggins P., Phillips R. Membrane-protein interactions in mechanosensitive channels. Biophys. J. 2005;88:880–902. doi: 10.1529/biophysj.104.047431. [DOI] [PMC free article] [PubMed] [Google Scholar]
- 8.Ursell T., Kondev J., Phillips R. The role of lipid bilayer mechanics in mechanosensation. In: Kamkin A., Kiseleva I., editors. Mechanosensitivity in Cells and Tissues 1: Mechanosensitive Ion Channels. Springer-Verlag; Berlin, Germany: 2008. pp. 37–70. [Google Scholar]
- 9.Reeves D., Ursell T., Phillips R. Membrane mechanics as a probe of ion-channel gating mechanisms. Phys. Rev. E Stat. Nonlin. Soft Matter Phys. 2008;78:041901. doi: 10.1103/PhysRevE.78.041901. [DOI] [PMC free article] [PubMed] [Google Scholar]
- 10.Ursell T., Huang K.C., Phillips R. Cooperative gating and spatial organization of membrane proteins through elastic interactions. PLOS Comput. Biol. 2007;3:e81. doi: 10.1371/journal.pcbi.0030081. [DOI] [PMC free article] [PubMed] [Google Scholar]
- 11.Andersen O.S., Koeppe R.E., 2nd Bilayer thickness and membrane protein function: an energetic perspective. Annu. Rev. Biophys. Biomol. Struct. 2007;36:107–130. doi: 10.1146/annurev.biophys.36.040306.132643. [DOI] [PubMed] [Google Scholar]
- 12.Turner M.S., Sens P. Gating-by-tilt of mechanically sensitive membrane channels. Phys. Rev. Lett. 2004;93:118103. doi: 10.1103/PhysRevLett.93.118103. [DOI] [PubMed] [Google Scholar]
- 13.Cantor R.S. Lateral pressures in cell membranes: a mechanism for modulation of protein function. J. Phys. Chem. B. 1997;101:1723–1725. [Google Scholar]
- 14.Cantor R.S. The influence of membrane lateral pressures on simple geometric models of protein conformational equilibria. Chem. Phys. Lipids. 1999;101:45–56. doi: 10.1016/s0009-3084(99)00054-7. [DOI] [PubMed] [Google Scholar]
- 15.Cantor R.S. Size distribution of barrel-stave aggregates of membrane peptides: influence of the bilayer lateral pressure profile. Biophys. J. 2002;82:2520–2525. doi: 10.1016/S0006-3495(02)75595-1. [DOI] [PMC free article] [PubMed] [Google Scholar]
- 16.Marsh D. Lateral pressure profile, spontaneous curvature frustration, and the incorporation and conformation of proteins in membranes. Biophys. J. 2007;93:3884–3899. doi: 10.1529/biophysj.107.107938. [DOI] [PMC free article] [PubMed] [Google Scholar]
- 17.Marsh D. Lateral pressure in membranes. Biochim. Biophys. Acta. 1996;1286:183–223. doi: 10.1016/s0304-4157(96)00009-3. [DOI] [PubMed] [Google Scholar]
- 18.Israelachvili J.N. Academic Press; London, UK: 1985. Intermolecular and Surface Forces. [Google Scholar]
- 19.Gullingsrud J., Schulten K. Lipid bilayer pressure profiles and mechanosensitive channel gating. Biophys. J. 2004;86:3496–3509. doi: 10.1529/biophysj.103.034322. [DOI] [PMC free article] [PubMed] [Google Scholar]
- 20.Ollila O.H.S., Rog T., Vattulainen I. Role of sterol type on lateral pressure profiles of lipid membranes affecting membrane protein functionality: comparison between cholesterol, desmosterol, 7-dehydrocholesterol and ketosterol. J. Struct. Biol. 2007;159:311–323. doi: 10.1016/j.jsb.2007.01.012. [DOI] [PubMed] [Google Scholar]
- 21.Niemelä P.S., Ollila O.H.S., Vattulainen I. PLOS Comput. Biol. 2007;3:304–312. doi: 10.1371/journal.pcbi.0030034. [DOI] [PMC free article] [PubMed] [Google Scholar]
- 22.Jerabek H., Pabst G., Stockner T. Membrane-mediated effect on ion channels induced by the anesthetic drug ketamine. J. Am. Chem. Soc. 2010;132:7990–7997. doi: 10.1021/ja910843d. [DOI] [PubMed] [Google Scholar]
- 23.Yefimov S., van der Giessen E., Marrink S.J. Mechanosensitive membrane channels in action. Biophys. J. 2008;94:2994–3002. doi: 10.1529/biophysj.107.119966. [DOI] [PMC free article] [PubMed] [Google Scholar]
- 24.Sukharev S.I., Sigurdson W.J., Sachs F. Energetic and spatial parameters for gating of the bacterial large conductance mechanosensitive channel, MscL. J. Gen. Physiol. 1999;113:525–540. doi: 10.1085/jgp.113.4.525. [DOI] [PMC free article] [PubMed] [Google Scholar]
- 25.Chiang C.-S., Anishkin A., Sukharev S. Gating of the large mechanosensitive channel in situ: estimation of the spatial scale of the transition from channel population responses. Biophys. J. 2004;86:2846–2861. doi: 10.1016/S0006-3495(04)74337-4. [DOI] [PMC free article] [PubMed] [Google Scholar]
- 26.Hamill O.P., Martinac B. Molecular basis of mechanotransduction in living cells. Physiol. Rev. 2001;81:685–740. doi: 10.1152/physrev.2001.81.2.685. [DOI] [PubMed] [Google Scholar]
- 27.Anishkin A., Chiang C.-S., Sukharev S. Gain-of-function mutations reveal expanded intermediate states and a sequential action of two gates in MscL. J. Gen. Physiol. 2005;125:155–170. doi: 10.1085/jgp.200409118. [DOI] [PMC free article] [PubMed] [Google Scholar]
- 28.Rowlinson J.S., Widom B. Clarendon Press; Oxford, UK: 1982. Molecular Theory of Capillarity. [Google Scholar]
- 29.Marrink S.J., Risselada H.J., de Vries A.H. The MARTINI force field: coarse grained model for biomolecular simulations. J. Phys. Chem. B. 2007;111:7812–7824. doi: 10.1021/jp071097f. [DOI] [PubMed] [Google Scholar]
- 30.Monticelli L., Kandasamy S.K., Marrink S.-J. The MARTINI coarse-grained force field: extension to proteins. J. Chem. Theory Comput. 2008;4:819–834. doi: 10.1021/ct700324x. [DOI] [PubMed] [Google Scholar]
- 31.Hess B., Kutzner C., Lindahl E. GROMACS 4: algorithms for highly efficient, load-balanced, and scalable molecular simulation. J. Chem. Theory Comput. 2008;4:435–447. doi: 10.1021/ct700301q. [DOI] [PubMed] [Google Scholar]
- 32.Berendsen H.J.C., Postma J.P.M., Haak J.R. Molecular dynamics with coupling to an external bath. J. Chem. Phys. 1984;81:3684–3690. [Google Scholar]
- 33.Louhivuori M., Risselada H.J., Marrink S.J. Release of content through mechano-sensitive gates in pressurized liposomes. Proc. Natl. Acad. Sci. USA. 2010;107:19856–19860. doi: 10.1073/pnas.1001316107. [DOI] [PMC free article] [PubMed] [Google Scholar]
- 34.Steinbacher S., Bass R., Rees D.C. Structures of the prokaryotic mechanosensitive channels MscL and MscS. Curr. Top. Membranes. 2007;58:1–24. [Google Scholar]
- 35.Ollila O.H.S., Risselada H.J., Marrink S.J. 3D pressure field in lipid membranes and membrane-protein complexes. Phys. Rev. Lett. 2009;102:078101. doi: 10.1103/PhysRevLett.102.078101. [DOI] [PubMed] [Google Scholar]
- 36.Markin V.S., Sachs F. Thermodynamics of mechanosensitivity. Phys. Biol. 2004;1:110–124. doi: 10.1088/1478-3967/1/2/007. [DOI] [PubMed] [Google Scholar]
- 37.Lindahl E., Edholm O. Spatial and energetic-entropic decomposition of surface tension in lipid bilayers from molecular dynamics simulations. J. Chem. Phys. 2000;113:3882–3893. [Google Scholar]
- 38.Ollila O.H.S., Vattulainen I. Lateral pressure profiles in lipid membranes: dependence on molecular composition. In: Sansom M., Biggin P., editors. Molecular Simulations and Biomembranes: From Biophysics to Function. Royal Society of Chemistry; London, UK: 2010. pp. 26–55. [Google Scholar]
- 39.Yoshimura K., Sokabe M. Mechanosensitivity of ion channels based on protein-lipid interactions. J. R. Soc. Interface. 2010;7(Suppl 3):S307–S320. doi: 10.1098/rsif.2010.0095.focus. [DOI] [PMC free article] [PubMed] [Google Scholar]
- 40.Perozo E., Rees D.C. Structure and mechanism in prokaryotic mechanosensitive channels. Curr. Opin. Struct. Biol. 2003;13:432–442. doi: 10.1016/s0959-440x(03)00106-4. [DOI] [PubMed] [Google Scholar]
- 41.Esteban-Martín S., Risselada H.J., Marrink S.J. Stability of asymmetric lipid bilayers assessed by molecular dynamics simulations. J. Am. Chem. Soc. 2009;131:15194–15202. doi: 10.1021/ja904450t. [DOI] [PubMed] [Google Scholar]
- 42.Booth P.J. The trials and tribulations of membrane protein folding in vitro. Biochim. Biophys. Acta. 2003;1610:51–56. doi: 10.1016/s0005-2736(02)00714-9. [DOI] [PubMed] [Google Scholar]
- 43.Minetti C.A., Remeta D.P. Energetics of membrane protein folding and stability. Arch. Biochem. Biophys. 2006;453:32–53. doi: 10.1016/j.abb.2006.03.023. [DOI] [PubMed] [Google Scholar]
- 44.Marsh D. Energetics of hydrophobic matching in lipid-protein interactions. Biophys. J. 2008;94:3996–4013. doi: 10.1529/biophysj.107.121475. [DOI] [PMC free article] [PubMed] [Google Scholar]
Associated Data
This section collects any data citations, data availability statements, or supplementary materials included in this article.