

Abstract
The N-terminal extension and phosphorylation of the myosin regulatory light chain (RLC) independently improve Drosophila melanogaster flight performance. Here we examine the functional and structural role of the RLC in chemically skinned fibers at various thick and thin filament lattice spacings from four transgenic Drosophila lines: rescued null or control (Dmlc2+), truncated N-terminal extension (Dmlc2Δ2-46), disrupted myosin light chain kinase phosphorylation sites (Dmlc2S66A,S67A), and dual mutant (Dmlc2Δ2-46; S66A,S67A). The N-terminal extension truncation and phosphorylation sites disruption mutations decreased oscillatory power output and the frequency of maximum power output in maximally Ca2+-activated fibers compressed to near in vivo inter-thick filament spacing, with the phosphorylation sites disruption mutation having a larger affect. The diminished power output parameters with the N-terminal extension truncation and phosphorylation sites disruption mutations were due to the reduction of the number of strongly-bound cross-bridges and rate of myosin force production, with the larger parameter reductions in the phosphorylation sites disruption mutation additionally related to reduced myosin attachment time. The phosphorylation and N-terminal extension-dependent boost in cross-bridge kinetics corroborates previous structural data, which indicate these RLC attributes play a complementary role in moving and orienting myosin heads toward actin target sites, thereby increasing fiber and whole fly power generation.
Introduction
Muscle contraction is driven by the cyclical interaction of the myosin II motor domain with actin. A regulatory light chain (RLC or myosin light chain 2, MLC2) and an essential light chain (ELC or MLC1 or MLC3) attach to the long α-helical region in the S1 subunit of each myosin molecule. The RLC phosphorylation state and ELC N-terminal extension play important roles in myosin function, as discussed below.
Phosphorylation of the RLC, although required to activate myosin in smooth muscle (1), modulates the force-generating acto-myosin interaction in vertebrate striated (skeletal and cardiac) muscle (reviewed in (2)). RLC phosphorylation in vertebrate striated muscle causes the myosin heads to move away from the thick filament backbone toward the thin filament (3,4) and potentiates force by increasing maximal isometric tension (4–7), Ca2+ sensitivity of force (4–9), and the rate of force redevelopment (ktr) at intermediate (4,6,8,9) and maximal (4,6) Ca2+ activation levels. These observations suggest that RLC phosphorylation places myosin closer to the thin filament, leading to increased acto-myosin interaction, altered myosin kinetics and, presumably, enhanced power output in vertebrate striated muscle.
RLC phosphorylation studies have primarily been performed in demembranated (skinned) fibers with a swollen thick and thin filament lattice (compared to in vivo), due to the loss of intracellular colloidal pressure after plasma membrane removal (10). Osmotic compression of the swollen lattice by adding a large, neutral long-chain polymer (dextran T-500, 1–6% w/v) produces effects similar to RLC phosphorylation in vertebrate striated muscle fibers. The effects that mimic RLC phosphorylation include an increase in maximal isometric tension (11–13), Ca2+ sensitivity of force (14–16), and rate of force development at intermediate and maximal Ca2+ activation (13,17). Because RLC phosphorylation decreases lattice spacing in skinned cardiac fibers (4), effects attributed to RLC phosphorylation may result from decreased lattice spacing. Notably, compressing the lattice by increasing sarcomere length or adding dextran T-500 eliminates the shift in Ca2+ sensitivity of force induced by RLC phosphorylation (18). Altogether, these results indicate that experiments performed at in vivo lattice spacing would help elucidate the in vivo role of RLC phosphorylation.
The indirect flight muscle (IFM) of Drosophila melanogaster is an ideal system for determining in vivo myofilament lattice spacing because small angle x-ray diffraction (the only technique able to provide this measure under native, hydrated conditions) can be performed in living flies (19). The effects of RLC phosphorylation disruption have been functionally studied using skinned fibers from Dmlc2S66A,S67A flies, which have both MLC kinase-dependent phosphorylation sites (Ser66 and Ser67) mutated to nonphosphorylatable alanines (20,21). However, the swollen lattice of the skinned fiber may have reduced the ability of myosin to interact with actin, by increasing the distance between thick and thin filaments, thereby confounding the results. This study addresses this concern by using small angle x-ray diffraction and small amplitude sinusoidal analysis on control and Dmlc2S66A,S67A fibers compressed over a range of inter-thick filament spacings (including near in vivo) to provide a precise interpretation of the role of RLC phosphorylation in insect flight muscle.
In addition to phosphorylation, RLCs are characterized by the presence of an N-terminal extension that ranges in length, depending upon species, from a few amino acids to the ∼50 found in Drosophila (22). The RLC N-terminal extension in Drosophila and the long ELC N-terminal extensions (MLC1) in mammalian skeletal and cardiac muscle have similar lysine and proline/alanine-rich regions, suggesting these extensions have analogous functions across species. Transgenic Drosophila expressing an RLC lacking the N-terminal extension (Dmlc2Δ2-46) have been functionally studied in swollen skinned fibers (23), which may cause functional alterations not related to the mutation. Thus, single Dmlc2Δ2-46 fibers have also been structurally and functionally examined at various inter-thick filament spacings in this study.
The physical proximity of the RLC phosphorylation sites and N-terminal extension in Drosophila raises the possibility of their acting mechanistically in concert in dictating myosin properties. To test this possibility, we recently created a dual mutant line, Dmlc2Δ2-46; S66A,S67A, which contains both the RLC phosphorylation disruption and truncated N-terminal extension mutations (24). We found in live flies that the structural phenotype of the dual mutant line appears to be a summation of the two individual mutations. Specifically, the disrupted phosphorylation sites line had reduced myosin head orientation with respect to the thin filament and the truncated N-terminal extension line had decreased myosin head alignment with respect to the thin filament target zones, whereas the dual mutant line showed both alterations. We further characterize the dual mutant line in this study by examining whole fly performance as well as single fiber function and structure at various inter-thick filament spacings.
Materials and Methods
Drosophila lines
Four myosin regulatory light chain (MLC2) lines were examined (Fig. 1): a rescued null control (Dmlc2+ or +), one with a truncated N-terminal extension (Dmlc2Δ2-46 or Δ2-46), one with disrupted myosin-light-chain-kinase phosphorylation sites (Dmlc2S66A,S67A or S66A,S67A), and one dual mutant (Dmlc2Δ2-46; S66A,S67A or Δ2-46; S66A,S67A). For details, see the Supporting Material.
Figure 1.
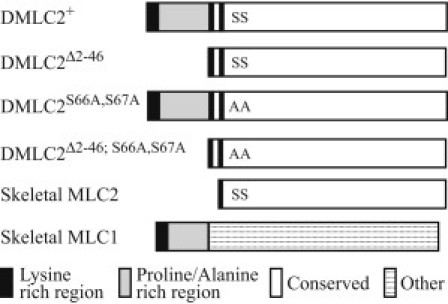
Schematic representation comparing the MLC2 sequences of Drosophila IFM (DMLC2) to MLC1 and MLC2 sequences of vertebrate skeletal muscle. Note that DLMC2Δ2-46 is similar to skeletal MLC2 and that the DMLC2+ N-terminal extension is similar to the skeletal MLC1 N-terminal extension. All representations are aligned with N-terminus to the left and C-terminus to the right. + = control; Δ2-46 = truncated N-terminal extension; S66A,S67A = disrupted phosphorylation sites and Δ2-46; S66A,S67A = truncated N-terminal extension and disrupted phosphorylation sites. S = serine, A = alanine.
Flight performance
Flight tests and wing beat frequency measurements were performed on 2–3-day-old female flies at room temperature (22°C) using previously published methods (25).
Solutions
Concentrations are in mmol/L (mM) unless otherwise expressed. Relaxing solution: pCa 8, 20 BES, 15 creatine phosphate, 300 units/mL creatine phosphokinase, 1 DTT, 5 EGTA, 1 Mg2+, 5 MgATP, 8 Pi, ionic strength of 200 mEq adjusted with sodium methane sulfate, and pH 7.0. Activating solution: same as relaxing except with pCa 4.5. Storage solution: pCa 8, 20 BES, 10 DTT, 5 EGTA, 1 Mg2+, 5 MgATP, 0.25 Pi, a protease inhibitor cocktail (Roche, Pleasanton, CA), ionic strength of 175 mEq adjusted with sodium methane sulfate, and pH 7.0 with 50% w/v glycerol added. Skinning solution: same as storage except with 0.5% Triton X-100. Dextran T-500 (% w/v) was added to relaxing and activating solutions.
X-ray diffraction
Live flies and single fibers were prepared and x-ray diffraction patterns obtained and analyzed as previously described (24,25) (see also the Supporting Material). The distance between the lattice planes of the thick filaments (d1,0) was converted to inter-thick filament spacing (d1,0 × 2/√3), giving the center-to-center distance between thick filaments. Inter-thick filament spacing in single fibers was measured in the presence of 0–10% (w/v) dextran T-500 and osmotic compressive pressure calculated from a previously published pressure-concentration relation (26). The bulk modulus, or elastic modulus for compression, was calculated by substituting inter-thick filament spacing for fiber width into previously derived equations (see the Supporting Material).
Single muscle fiber mechanics
Single muscle fibers were prepared, stored, and mounted on equipment as previously described (25) (see also the Supporting Material). To perform sinusoidal analysis, small amplitude sinusoidal length changes (0.125% muscle length) were applied to the fiber at 50 frequencies (0.5–650 Hz) while measuring the force response (21). Length and force were normalized to determine strain (ΔL/L) and tension (F/CSA) by dividing the length change (ΔL) by total fiber length (L), and by dividing force (F) by fiber cross-sectional area (CSA). Elastic (Ee) and viscous (Ev) moduli were calculated from the tension transient by determining the magnitudes of the in-phase and out-of-phase components (with 0° and 90° strain, respectively).
The complex modulus (plotted as viscous versus elastic modulus) was characterized, or fit, by
where A, B, and C are magnitudes (kN/m2), b and c are characteristic frequencies (Hz), f is the length perturbation frequency (Hz), i = −11/2, α = 1 Hz (α used to remove the dimension, or unit, of f), and k is a unitless exponent (21). The A-process (A, k) reflects the relaxed viscoelastic properties of the fiber's structural elements, including a portion that increases with Ca2+ ascribed to attached myosin heads (27,28). For the B-process (B, b), B is proportional to the number of myosin heads strongly bound to actin and the cross-bridge stiffness (29) and 2πb is hypothesized to represent the apparent (observed) rate of myosin force production or, in other words, the rate of myosin transition between the weakly- and strongly-bound states (12). For the C-process (C, c), C is equivalent to the number of myosin heads strongly bound to actin multiplied by the cross-bridge stiffness, and is therefore proportional to B, and (2πc)−1 represents the average myosin attachment time to actin, ton (30).
Statistical analysis
All data are reported as mean ± SE. Statistical analyses were performed using SPSS v.16.0 (SPSS, Chicago, IL) and considered significant at the p < 0.05 level. For details, see the Supporting Material. Notably, when referring to the two-way ANOVA results, the phrases “N-terminal extension truncation mutation” (or Ext effect) and “phosphorylation sites disruption mutation” (or Phos effect) will be used. In contrast, when referring to the different Drosophila lines the terms “control line”, “truncated N-terminal extension line”, “disrupted phosphorylation sites line”, and “dual mutant line” will be used.
Results
Flight performance
The truncated N-terminal extension line (Δ2-46) showed no effect on the number of Drosophila able to fly or beat their wings compared to the control line (+), but had decreased wing beat frequency and slightly reduced flight index (Table 1). The disrupted phosphorylation sites line (S66A,S67A) had decreased wing beat frequency and greatly decreased number of Drosophila able to beat their wings or fly, causing a large reduction in flight index, in agreement with previous studies (20,21). The dual mutant line (Δ2-46; S66A,S67A) was unable to fly or beat its wings, suggesting that truncating the N-terminal extension and disrupting the phosphorylation sites have an additive effect on flight performance. Both mutations decrease flight performance, as indicated by the Ext (normal versus N-terminal extension truncation mutation) and Phos (normal versus phosphorylation sites disruption mutation) effects in flight index and wing beat frequency. The Phos by Ext interaction in wing beat frequency is due to the inability of the dual mutant line to beat its wings, causing a large decrease compared to the individual mutation lines.
Table 1.
Summary of flight characteristics
| Line | Flight index (0–6%) | Able to fly (%) | Wing beat frequency (Hz) | Able to beat wings (%) |
|---|---|---|---|---|
| + (Control) | 5.1 ± 0.1 (60) | 100 | 202 ± 3 (52) | 100 |
| Δ2-46 | 4.6 ± 0.2 (60)∗ | 98 | 165 ± 2 (44)∗ | 100 |
| S66A,S67A | 0.1 ± 0.1 (53)∗ | 10 | 158 ± 3 (11)∗ | 20 |
| Δ2-46; S66A,S67A | 0.0 ± 0.0 (55)∗ | 0 | 0 ± 0 (30)∗† | 0 |
| Significant difference | Ext, Phos | NA | Ext, Phos, Phos by Ext | NA |
All values are mean ± SE. Numbers in parentheses indicate number of flies tested. Temperature = 22°C. NA indicates not applicable. Ext, Phos, and Phos by Ext indicate a significant difference between the N-terminal extension length (normal versus truncated); between phosphorylation sites state (normal versus disrupted); and a significant interaction, respectively.
Significant difference from + (control).
Significant difference from Δ2-46 and S66A,S67A.
X-ray diffraction
Inter-thick filament spacing of IFM from resting, live flies, calculated from previously reported d1,0 values (24), was similar between the individual mutation (truncated N-terminal extension or disrupted phosphorylation sites) and control lines, but reduced in the dual mutant line (Fig. 2 A). Inter-thick filament spacing of single-skinned IFM fibers bathed in relaxing solution (0% dextran T-500) was 11–16% greater than the live fly, due to plasma membrane removal (10,12). Adding dextran T-500 osmotically compresses the inter-thick filament spacing, with in vivo values restored at concentrations slightly above 4%.
Figure 2.
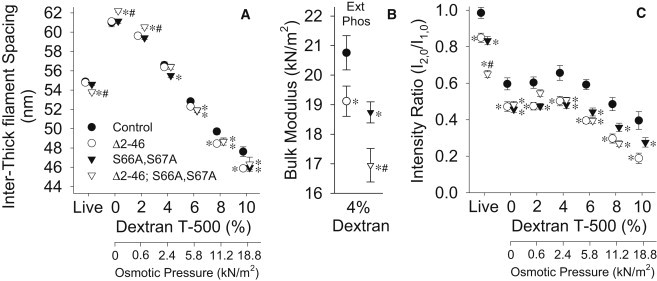
Inter-thick filament spacing (A) and intensity ratio, or I2,0/I1,0 (C) of IFM from resting, live flies and relaxed fibers compressed with dextran T-500 (% w/v) for RLC mutants and control. Note that some symbols are hidden (e.g., control at 2% dextran) behind overlapping measurements. Bulk modulus (B), or compressive elastic modulus, calculated at 4% dextran T-500 from the relationship between inter-thick filament spacing and osmotic compression for relaxed fibers. Within dextran concentration: asterisk (∗) indicates a significant difference from control; pound sign (#) indicates a significant difference from Δ2-46 and S66A,S67A; and Ext and Phos indicate significant differences between N-terminal extension length (normal versus truncated) and phosphorylation sites state (normal versus disrupted), respectively. Fibers examined: Δ2-46 = 15; S66A,S67A = 15; Δ2-46; S66A,S67A = 10; and control = 12.
Inter-thick filament spacings for the individual mutation lines were similar to control at low dextran concentrations (0–2%), but were smaller at higher concentrations (8–10%), indicating that fibers from the individual mutation lines were easier to compress radially than the control line. The dual mutant line had inter-thick filament spacings larger than all other lines at low dextran (0–2%), with similar spacings compared to individual mutation lines and lower spacings compared to the control line at high dextran (8–10%), suggesting these fibers were more radially compliant than all other lines. At near in vivo inter-thick filament spacing (4% dextran T-500), the bulk modulus indicates a similar radial stiffness reduction in the individual mutation lines (Fig. 2 B). As with flight performance, the individual mutation lines appear to have an additive effect because the dual mutant line had the smallest bulk modulus.
Equatorial intensity ratios (I2,0/I1,0) of IFM for resting, live flies were previously reported (24) and found to be reduced (14–16%) for the individual mutation lines compared to the control line with a larger reduction (31%) in the dual mutant line (Fig. 2 C). This indicates that one or both myosin heads were further from the thin filaments in the mutant lines. The intensity ratios of single-skinned IFM fibers bathed in different dextran concentrations were reduced in all mutant lines compared to the control line, except for the dual mutant line at 2% dextran. Notably, all skinned fiber intensity ratios were lower than their live values, whether compressed or not. This intensity ratio decrease most likely occurred because of a reduction in thin filament effective density as part of the skinning process, either due to the loss of glycolytic enzymes that associate with the thin filament (31) or to reduced constraints on the filaments resulting from lattice swelling, an effect known as “temperature factor disorder” (32).
Because the dual mutant line was unable to beat its wings, x-ray diffraction was restricted to the resting (wings folded) condition in whole flies and, for consistency, to low Ca2+ relaxing solution (pCa 8) in single fibers. Lattice spacing under resting conditions (low Ca2+) approximates that in the fully activated fiber (high Ca2+) because inter-thick filament spacing decreases only slightly (∼0.8%) from relaxed to full activation in wild-type flies (19). Thus, minimal, if any, differences are expected between active and relaxed conditions in the amount of dextran T-500 necessary to compress the fiber lattice back to in vivo. The equatorial intensity ratio, I2,0/I1,0, under relaxed conditions is a predictor of Ca2+-activated binding because the proximity of myosin heads to the thin filament in the resting fiber affects the probability of cross-bridge formation in the activated fiber (4,16,24). Although the increase in I2,0/I1,0, from resting (wings folded) to active (wings beating) in living flies is significant (4.8%), the change is small, consistent with the close proximity of myosin heads to the thin filament in resting fibers (19). Altogether, these results indicate that low Ca2+ x-ray diffraction measurements of inter-thick filament spacing and equatorial intensity ratio can be used to interpret high Ca2+ fiber mechanics results.
Skinned muscle fiber mechanics
At 0% dextran, maximum power output of skinned fibers at peak calcium activation was similar to control for the truncated N-terminal extension line, but decreased (67–89%) for the disrupted phosphorylation sites and dual mutant lines (Fig. 3 A). However, at near in vivo inter-thick filament spacing (4% dextran), power output more than doubled for the disrupted phosphorylation sites and dual mutant lines compared to uncompressed. At 4% dextran, power output was similar between the individual mutation and control lines, yet remained decreased in the dual mutant line compared to all other lines. When inter-thick filament spacing was compressed to slightly less than in vivo (6% dextran), power output decreased dramatically for all lines, by more than half the 4% dextran values, and continued to decrease with reduced inter-thick filament spacing (8–10% dextran). The large reductions in power output that occur for all lines (∼60%) when decreasing inter-thick filament spacing from slightly above (4% dextran) to below (6% dextran) in vivo values demonstrate the critical role lattice spacing has in determining myosin's success in binding and moving the thin filament.
Figure 3.
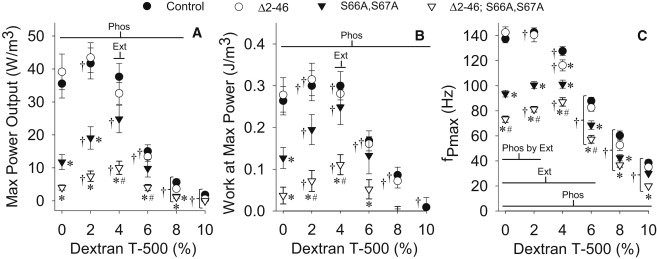
Maximum power output (A), work at maximum power output (B), and frequency of maximum power output (C) for active IFM fibers compressed with dextran T-500 (% w/v) for RLC mutants and control. Within dextran concentration: asterisk (∗) indicates a significant difference from control; pound sign (#) indicates a significant difference from Δ2-46 and S66A,S67A; and Ext, Phos, and Phos by Ext indicate a significant difference between N-terminal extension length (normal versus truncated), between phosphorylation sites state (normal versus disrupted), and a significant interaction, respectively. Between dextran concentrations: dagger symbol (†) indicates a significant difference from the 0% dextran T-500 value. Fibers examined: Δ2-46 = 8; S66A,S67A = 8; Δ2-46; S66A,S67A = 16; and control = 19.
Because maximum power output (Pmax) is proportional to the work produced at maximum power output per one sine cycle (WPmax) multiplied by the frequency of maximum power output (fPmax), or Pmax (W/m3) = WPmax (J/m3, where J = W/s) × fPmax (Hz), these parameters can be used to understand how the different fly lines and osmotic compression affect Pmax. WPmax showed a similar overall pattern to Pmax, in terms of differences between lines and changes with compression (Fig. 3 B). For uncompressed fibers, fPmax was similar to control for the truncated N-terminal extension line, but was decreased for the disrupted phosphorylation sites and dual mutant lines (Fig. 3 C), similar to maximum power output. However, compression to near in vivo inter-thick filament spacing values caused fPmax to behave differently than Pmax and WPmax, because fPmax decreased for control and truncated N-terminal extension lines but remained unchanged for the disrupted phosphorylation sites line and increased for the dual mutant line compared to uncompressed. The only condition where fPmax was statistically different for each line (in Hz: 128 ± 4 for +; 116 ± 4 for Δ2-46; 101 ± 3 for S66A,S67A; 87 ± 3 for Δ2-46; S66A,S67A) was at near in vivo inter-thick filament spacing, suggesting that the myosin kinetics of each line is different.
The phosphorylation sites disruption mutation (Phos effect) produced differences at almost every dextran concentration for maximum power output, work produced at maximum power, and frequency of maximum power output. The N-terminal extension truncation mutation (Ext effect) produced a difference in maximum power output and work produced at maximum power at 4% dextran, whereas fPmax differences were at 0–6% dextran.
For the remainder of the fiber mechanics results, we focus on the 4% dextran data, because this condition closely reproduces in vivo inter-thick filament spacing. The elastic modulus increased with the phosphorylation sites disruption mutation in 4% dextran at frequencies above 130 Hz (Phos in Fig. 4 D). The viscous modulus and power output were different with the N-terminal extension truncation mutation from 80 to 160 Hz and with the phosphorylation sites disruption mutation from 85 to 255 Hz (Ext and Phos, Fig. 4, E and F). The viscous modulus had a Phos by Ext interaction at frequencies above 345 Hz because the dual mutant line was similar to the control line within this range and did not increase as much as the individual mutant lines.
Figure 4.
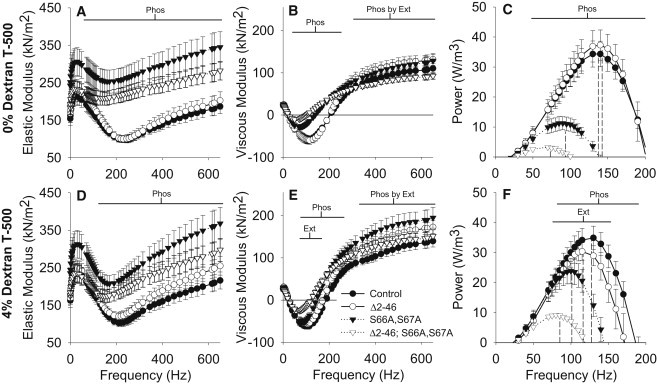
Elastic modulus (A and D), viscous modulus (B and E), and power output (C and F) from active IFM fibers across fiber oscillation frequencies for skinned (0% w/v dextran T-500, A–C) and near in vivo inter-thick filament spacing (4% dextran T-500, D–F) for RLC mutants and control. (Dashed lines in C and F) The fPmax (frequency of maximum power output) from Fig. 3. Ext, Phos, and Phos by Ext indicate a significant difference between N-terminal extension length (normal versus truncated), between phosphorylation sites state (normal versus disrupted), and a significant interaction, respectively. Fibers examined: Δ2-46 = 8; S66A,S67A = 8; Δ2-46; S66A,S67A = 16; and control = 19.
Increasing osmotic compression from 0% to 4% dextran subtly, but significantly, increased elastic modulus for the control line from 5 to 115 Hz and above 255 Hz (Fig. 4, panel A versus panel D). High frequency elastic modulus (>150 Hz) increased with compression for the N-terminal extension truncation mutation. In contrast, the disrupted phosphorylation sites disruption mutation caused a decreased elastic modulus in the midfrequency range (110–265 Hz) with compression. All lines had an increased viscous modulus magnitude with compression at low frequencies (1–15 Hz) and above 170 Hz (Fig. 4, panel B versus panel E). Compression increased viscous modulus (Fig. 4, panel B versus panel E) and power (Fig. 4, panel C versus panel F) in both lines with disrupted phosphorylation sites from 40 to 115 Hz, which increased maximum power output (Fig. 3 A). Notably, the control line had increased viscous modulus and power from 70 to 110 Hz without an increase in maximum power output.
At 4% dextran, the fitted parameters and calculated ton values were similar for the truncated N-terminal extension and control lines (Fig. 5, A–F). The k values were decreased for the disrupted phosphorylation sites line compared to control, whereas the dual mutant line had decreased values for B, C, k, 2πb, and ton. Importantly, the two-way ANOVAs show that N-terminal extension truncation mutation caused a decrease in B, C, and 2πb (Ext effect), whereas phosphorylation sites disruption mutation reduced all fitted parameters (Phos effect) at 4% dextran. The A-process changes indicate that RLC phosphorylation sites disruption mutation is altering the mechanical properties of the underlying lattice structure as A and k change in opposite directions, because increasing the number of attached myosin heads due to increasing the Ca2+ concentration leads to an increase in both A and k (28).
Figure 5.
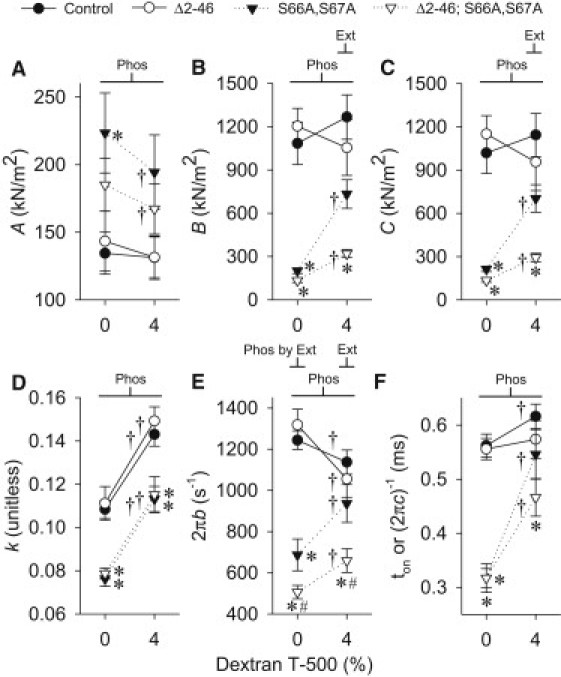
Dependence of fitted parameters A, B, C, k, 2πb, and ton (A–F, respectively) from active IFM fibers on osmotic compression from skinned (0% w/v dextran T-500) to near in vivo inter-thick filament spacing (4% dextran T-500) for RLC mutants and control. Within dextran concentration: the asterisk symbol (∗) indicates a significant difference from control; the pound symbol (#) indicates a significant difference from Δ2-46 and S66A,S67A; and Ext, Phos, and Phos by Ext indicate a significant difference between N-terminal extension lengths (normal versus truncated), between phosphorylation sites state (normal versus disrupted) and a significant interaction, respectively. Between dextran concentrations: dagger symbol (†) indicates a significant difference between the 0% and 4% dextran T-500 value. Fibers examined: Δ2-46 = 8; S66A,S67A = 8; Δ2-46; S66A,S67A = 12; and control = 19.
The value 2πb was altered in all lines with compression (0–4% dextran), with the control and N-terminal extension lines decreasing, and the disrupted phosphorylation sites and dual mutant lines increasing. The ton value increased dramatically in both lines with disrupted phosphorylation sites and slightly in the control with compression. Notably, all fitted parameters were changed with compression, becoming closer to the control line values, in the lines with disrupted phosphorylation sites.
Discussion
In this study, the functional roles of the RLC N-terminal extension and phosphorylation were examined in chemically skinned IFM fibers from Drosophila melanogaster at different thick and thin filament lattice spacings. The RLC N-terminal extension and phosphorylation were found to enhance power output, alter myosin kinetics, and increase the number of strongly bound cross-bridges at maximum Ca2+-activation when osmotic compression was used to return the inter-thick filament spacing to near in vivo values. As discussed below, these functional results corroborate previous structural studies from our laboratories that indicate the N-terminal extension aids in aligning myosin with its binding sites on the thin filament and phosphorylation helps orient the myosin with the thin filament by restricting their range of angles relative to the thick filament (24).
An important aspect of this study is the use of 4% dextran T-500 to osmotically compress the inter-thick filament spacing of skinned IFM fibers to values approximating those in resting, live Drosophila. By returning lattice spacing to near in vivo values, phenotypic functional differences for the RLC N-terminal extension and phosphorylation were evident and, in some cases, quite different from single fiber results without compression. Therefore, the results at 4% dextran T-500 will be used to examine the functional changes the RLC N-terminal truncation and phosphorylation sites mutations engender, unless otherwise noted.
Role of the RLC N-terminal extension in insect IFM
The most prominent change in the RLC truncated N-terminal extension line (Δ2-46) at near in vivo inter-thick filament spacing is the decrease in frequency of maximum power output, or fPmax (Fig. 3 C), which indicates an alteration in myosin kinetics compared to the control line. A strength of our study is the creation of the dual mutant line (Δ2-46; S66A,S67A) which permits statistical analyses, such as two-way ANOVAs, that can extract subtle effects of the N-terminal extension truncation (i.e., Ext effect) and phosphorylation sites disruption (i.e., Phos effect) mutations as well as their interaction (i.e., Phos by Ext effect). These analyses indicate that the RLC N-terminal extension truncation mutation slightly, but significantly, reduces work at maximum power output (WPmax) (Ext in Fig. 3 B). Because maximum power output (Pmax) is proportional to WPmax multiplied by fPmax, these results suggest that the small reduction in Pmax with the RLC N-terminal extension truncation mutation (Ext in Fig. 3 A) is primarily due to the decrease in fPmax. The large reduction in fPmax is consistent with the large decrease in the truncated N-terminal extension line's wing beat frequency compared to the control line (Table 1).
The fPmax decrease with the RLC N-terminal extension truncation mutation is driven by the reduction of 2πb (Ext in Fig. 5 E), a measure of the rate of myosin transition between weakly- and strongly-bound states (12), suggesting this mutation causes myosin heads to remain longer in the weakly bound state. Because myosin attachment time (ton), or time myosin remains strongly bound, is unchanged (Fig. 5 F), an increase in duration of the weakly-bound state of myosin should decrease the fraction of the total cycle time myosin is strongly bound to actin, that is, the myosin duty ratio. A myosin duty ratio decrease would reduce the number of myosins strongly bound to actin, as suggested by the reduction in B and C (Ext in Fig. 5, B and C), parameters proportional to the number of myosin heads strongly bound to actin (29,30). Notably, the alterations in myosin kinetics and number of strongly bound heads are small with the RLC N-terminal extension truncation mutation, similar to the changes in whole fly flight performance of the truncated N-terminal extension line.
Our previous structural results from live flies indicate that the truncated N-terminal extension line has myosin heads that are further away from the thin filament, yet maintain their angular orientation with respect to the thick filament backbone, compared to the control line (24). This agrees with the decreased bulk modulus, or elastic modulus for compression, in the truncated N-terminal extension line (Fig. 2 B), as myosin heads have been found to exert a radial force (33). Assuming that myosin heads in Drosophila IFM tend to bind at specific locations along the thin filament as in Lethocerus IFM (34), the fact that myosin heads move away from the thin filament, yet remain well positioned to bind actin, agree with our functional results indicating a slightly increased duration of weakly-bound heads with the RLC N-terminal extension truncation mutation. These results suggest that the RLC N-terminal extension may structurally link the myosin head to the thin filament, serving to preposition the heads for quick attachment to the thin filament, as previously hypothesized (24,35).
Role of the RLC phosphorylation in insect IFM
The most noticeable alteration at near in vivo inter-thick filament spacing in the disrupted RLC phosphorylation sites line (S66A,S67A) is the decrease in frequency of maximum power output (fPmax, Fig. 3 C) compared to control. Similar to the N-terminal extension truncation mutation, the small decrease in maximum power output with the phosphorylation sites disruption mutation (Phos in Fig. 3 A) appears to be due to the reduction in fPmax as the decrease in WPmax is much smaller (Phos in Fig. 3 B). The reduction in fPmax in the disrupted phosphorylation sites line compared to the control line is larger than in the truncated N-terminal extension line, indicating that disruption of the phosphorylation sites has a more profound effect on myosin kinetics. The whole fly performance measures also indicate the disruption of RLC phosphorylation sites is a more severe mutation as only 10–20% of flies from the disrupted phosphorylation sites line are able to fly or beat their wings compared to the almost 100% success rate in these measures for the truncated N-terminal extension line (Table 1).
The RLC phosphorylation sites disruption mutation alters each of the fitted parameters, causing an increase in A and a decrease in B, C, k, 2πb, and ton. The reduction of 2πb and ton with the phosphorylation sites disruption mutation (Phos at 4% dextran in Fig. 5, F and G) suggests the time myosin spends in weakly bound state(s) increases, whereas the time spent in strongly bound states decreases compared to control. The combination of these alterations in myosin kinetics should significantly decrease the myosin duty ratio and cause a considerable reduction in the number of myosin heads strongly bound to actin, as supported by the decreases in parameters B and C (Phos at 4% dextran in Fig. 5, B and C)—parameters proportional to the number of myosin heads strongly bound to actin (29,30). Based on these results, we hypothesize that the RLC phosphorylation sites disruption mutation alters myosin kinetics and decreases the number of strongly bound heads, and together these changes drive the reduction in frequency of maximum power output in the disrupted phosphorylation sites line, ultimately producing the greatly reduced whole fly flight characteristics.
Our previous x-ray diffraction results from live flies show that the disrupted phosphorylation sites line has myosin heads that are further away from the thin filaments, compared to the control line, due to their having less restriction on their angular orientation to the thick filament backbone, allowing them to adopt a wider range of angles which results in the myosin heads not being optimally oriented to the thin filament for binding (24). Electron microscopy revealed that the reduction in orientation with the thin filament binding sites in the disrupted phosphorylation sites line causes fewer heads to bind under Ca2+-activated conditions (24), which agrees well with our findings of a decrease in the number of strongly-bound heads and decreased bulk modulus with the RLC phosphorylation sites disruption mutation. Our combined structural and functional results indicate that RLC phosphorylation in Drosophila IFM does not behave as an inhibitor of myosin function, as in smooth muscle (1), but instead modulates myosin function, similar to vertebrate striated muscle (2).
Effect of the RLC dual mutant on insect IFM
The dual mutant line (Δ2-46; S66A,S67A) has larger reductions compared to the control line in terms of flight performance (Table 1), power output measures (Pmax, WPmax, and fPmax in Fig. 3), and most fitted parameters (B, C, 2πb, and ton in Fig. 5) than the individual mutation lines, indicating that truncating the N-terminal extension and disrupting the phosphorylation sites have a combined affect on muscle function. Structurally, the dual mutant line appears to be the summation of the two individual mutant lines in terms of the distance myosin moves away from the thin filament and the lack of myosin orientation with the thick filament (24) as well as the bulk modulus (Fig. 2 B). These results indicate that the RLC N-terminal extension and phosphorylation sites work together to improve myosin performance in Drosophila IFM, leading to increased whole fly flight characteristics.
Comparisons to previous RLC results in insect IFM
The previous studies examining the truncated N-terminal extension (23) and disrupted phosphorylation sites (20,21) lines were performed in a swollen lattice and may be comparable to our current 0% dextran results, although experimental alterations have been implemented over the past decade to maximize IFM contractile performance to better match in vivo characteristics. In previous work, the most prominent mechanical phenotype of the truncated N-terminal extension line was a reduction in elastic moduli with no change in Pmax or fPmax compared to the control line (23). At 0% dextran in this study, we also find no change in Pmax or fPmax (Fig. 4 C), but, contrary to previous results, we find no reduction in elastic moduli (Fig. 4 A). Previously (20,21,23) we set the fiber length by stretching to a specific passive tension (∼1 kN/m2, which translates into a 5–15% stretch above just taut), whereas in this study we stretched the fibers by 2% increments until oscillatory work production was maximized (a 10–30% stretch above just taut). We propose that the increased fiber lengths in this study served to eliminate the elastic modulus differences between the truncated N-terminal extension and control lines by increasing the contribution of the fiber's passive elements.
The previous work in the disrupted phosphorylation sites line found a reduction in the number of attached myosin heads and Pmax without a change in myosin kinetics (20,21). At 0% dextran in this study, we also found a reduction in attached heads (Fig. 5, B and C) and Pmax (Fig. 3 A), but large decreases in myosin kinetic parameters (2πb and ton, Fig. 5). Because this study found significantly larger values (55–270%) for 2πb and ton at 0% dextran compared to previous work, we postulate that the smaller myosin kinetic values in previous studies did not allow for subtle changes to be observed. Notably, the concentrations of constituents in the bathing solutions of this study differed from previous work (20,21,23). In particular, previous solutions had lower creatine phosphokinase (80 vs. 300 units/mL) and higher phosphate concentrations (16 vs. 8 mM), that could alter myosin kinetics. An important difference between this and previous work is therefore the use of 4% dextran T-500 which produced myosin kinetic differences from the control lines for both the truncated N-terminal extension and disrupted phosphorylation sites lines (which agrees well with whole fly flight characteristics) whereas the 0% dextran results from the previous studies did not show any differences in myosin kinetics.
Effect of dextran T-500 on IFM function
To our knowledge, this study represents the first time insect IFM fibers have been functionally examined across a range of lattice spacings, from swollen due to removal of the plasma membrane to compressed well below in vivo values. Compared to uncompressed, the control line at near in vivo inter-thick filament spacing (4% dextran) had relatively small changes (7–10%) in myosin kinetics, showing a decrease in fPmax (Fig. 3 C) as well as a reduction in the rate of transition between the weakly- and strongly-bound states (Fig. 5 E) and an increase in ton (Fig. 5 F). The truncated N-terminal extension line had power output measures and fitted parameters that were indistinguishable from the control line without osmotic compression. However, at near in vivo inter-thick filament spacing, the truncated N-terminal extension line had slightly larger decreases (18–20%) in fPmax and 2πb than the control line, allowing the identification of the subtle effects of this mutation and, thus, providing important insights beyond the conclusions reached without osmotic compression. Compared to uncompressed, the disrupted phosphorylation sites and dual mutant lines at near in vivo inter-thick filament spacing showed large enhancements in myosin kinetics, 2πb (30–36%) and ton (47–72%), and an enormous elevation (2–3 times) in Pmax, WPmax, B and C (Fig. 3 and Fig. 5, B and C). These alterations with compression made the disrupted phosphorylation sites line fibers perform more similar to the control line, which better matches whole fly flight characteristics and allows for a clearer understanding of the in vivo role of RLC phosphorylation.
Conclusion
The functional experiments performed in this study at near in vivo lattice spacing show that the RLC N-terminal extension and phosphorylation work similarly by increasing the number of strongly-bound cross-bridges and altering myosin kinetics in a manner that increases the frequency of maximum power output, leading to higher wing beat frequencies, and improved flight performance. Based upon our previous structural work (24), the RLC N-terminal extension helps position the myosin heads closer to their actin binding sites, whereas RLC phosphorylation orients the myosin heads with the thin filament by limiting their range of angles relative to the thick filament. Our ability to characterize the subtle effects of these RLC attributes was improved by compressing the myofilament lattice spacing to near in vivo values, which appears to produce performance characteristics similar to those observed in the whole fly.
Acknowledgments
We thank the Biophysics Collaborative Access Team staff for help with beamline setup at the Advanced Photon Source.
This work was supported, in part, by National Institutes of Health (NIH) grant No. R01 HL68034 (to D.W.M.). F.N.S.-A. was supported by NIH training grant No. T32 HL07944. Use of the Advanced Photon Source was supported by the U.S. Department of Energy, Basic Energy Sciences, Office of Energy Research, under contract No. W-31-109-ENG-38. The Biophysics Collaborative Access Team is a NIH-supported Research Center (grant No. RR08630 to T.C.I.). The content is solely the responsibility of the authors and does not necessarily reflect the official views of the NIH.
Footnotes
Gerrie P. Farman's present address is Department of Physiology, University of Toronto, Toronto, Ontario.
Felipe N. Soto-Adames's present address is Illinois Natural History Survey, University of Illinois, Champaign, IL.
Supporting Material
References
- 1.Trybus K.M., Lowey S. Conformational states of smooth muscle myosin. Effects of light chain phosphorylation and ionic strength. J. Biol. Chem. 1984;259:8564–8571. [PubMed] [Google Scholar]
- 2.Sweeney H.L., Bowman B.F., Stull J.T. Myosin light chain phosphorylation in vertebrate striated muscle: regulation and function. Am. J. Physiol. 1993;264:C1085–C1095. doi: 10.1152/ajpcell.1993.264.5.C1085. [DOI] [PubMed] [Google Scholar]
- 3.Levine R.J., Kensler R.W., Sweeney H.L. Myosin light chain phosphorylation affects the structure of rabbit skeletal muscle thick filaments. Biophys. J. 1996;71:898–907. doi: 10.1016/S0006-3495(96)79293-7. [DOI] [PMC free article] [PubMed] [Google Scholar]
- 4.Colson B.A., Locher M.R., Moss R.L. Differential roles of regulatory light chain and myosin binding protein-C phosphorylations in the modulation of cardiac force development. J. Physiol. 2010;588:981–993. doi: 10.1113/jphysiol.2009.183897. [DOI] [PMC free article] [PubMed] [Google Scholar]
- 5.Szczesna D., Zhao J., Potter J.D. Phosphorylation of the regulatory light chains of myosin affects Ca2+ sensitivity of skeletal muscle contraction. J. Appl. Physiol. 2002;92:1661–1670. doi: 10.1152/japplphysiol.00858.2001. [DOI] [PubMed] [Google Scholar]
- 6.Olsson M.C., Patel J.R., Moss R.L. Basal myosin light chain phosphorylation is a determinant of Ca2+ sensitivity of force and activation dependence of the kinetics of myocardial force development. Am. J. Physiol. Heart Circ. Physiol. 2004;287:H2712–H2718. doi: 10.1152/ajpheart.01067.2003. [DOI] [PubMed] [Google Scholar]
- 7.Stelzer J.E., Patel J.R., Moss R.L. Acceleration of stretch activation in murine myocardium due to phosphorylation of myosin regulatory light chain. J. Gen. Physiol. 2006;128:261–272. doi: 10.1085/jgp.200609547. [DOI] [PMC free article] [PubMed] [Google Scholar]
- 8.Metzger J.M., Greaser M.L., Moss R.L. Variations in cross-bridge attachment rate and tension with phosphorylation of myosin in mammalian skinned skeletal muscle fibers. Implications for twitch potentiation in intact muscle. J. Gen. Physiol. 1989;93:855–883. doi: 10.1085/jgp.93.5.855. [DOI] [PMC free article] [PubMed] [Google Scholar]
- 9.Sweeney H.L., Stull J.T. Alteration of cross-bridge kinetics by myosin light chain phosphorylation in rabbit skeletal muscle: implications for regulation of actin-myosin interaction. Proc. Natl. Acad. Sci. USA. 1990;87:414–418. doi: 10.1073/pnas.87.1.414. [DOI] [PMC free article] [PubMed] [Google Scholar]
- 10.Godt R.E., Maughan D.W. Swelling of skinned muscle fibers of the frog. Experimental observations. Biophys. J. 1977;19:103–116. doi: 10.1016/S0006-3495(77)85573-2. [DOI] [PMC free article] [PubMed] [Google Scholar]
- 11.Krasner B., Maughan D. The relationship between ATP hydrolysis and active force in compressed and swollen skinned muscle fibers of the rabbit. Pflugers Arch. 1984;400:160–165. doi: 10.1007/BF00585033. [DOI] [PubMed] [Google Scholar]
- 12.Zhao Y., Kawai M. The effect of the lattice spacing change on cross-bridge kinetics in chemically skinned rabbit psoas muscle fibers. II. Elementary steps affected by the spacing change. Biophys. J. 1993;64:197–210. doi: 10.1016/S0006-3495(93)81357-2. [DOI] [PMC free article] [PubMed] [Google Scholar]
- 13.McDonald K.S., Wolff M.R., Moss R.L. Sarcomere length dependence of the rate of tension redevelopment and submaximal tension in rat and rabbit skinned skeletal muscle fibers. J. Physiol. 1997;501:607–621. doi: 10.1111/j.1469-7793.1997.607bm.x. [DOI] [PMC free article] [PubMed] [Google Scholar]
- 14.Godt R.E., Maughan D.W. Influence of osmotic compression on calcium activation and tension in skinned muscle fibers of the rabbit. Pflugers Arch. 1981;391:334–337. doi: 10.1007/BF00581519. [DOI] [PubMed] [Google Scholar]
- 15.McDonald K.S., Moss R.L. Osmotic compression of single cardiac myocytes eliminates the reduction in Ca2+ sensitivity of tension at short sarcomere length. Circ. Res. 1995;77:199–205. doi: 10.1161/01.res.77.1.199. [DOI] [PubMed] [Google Scholar]
- 16.Farman G.P., Walker J.S., Irving T.C. Impact of osmotic compression on sarcomere structure and myofilament calcium sensitivity of isolated rat myocardium. Am. J. Physiol. Heart Circ. Physiol. 2006;291:H1847–H1855. doi: 10.1152/ajpheart.01237.2005. [DOI] [PubMed] [Google Scholar]
- 17.Korte F.S., McDonald K.S. Sarcomere length dependence of rat skinned cardiac myocyte mechanical properties: dependence on myosin heavy chain. J. Physiol. 2007;581:725–739. doi: 10.1113/jphysiol.2007.128199. [DOI] [PMC free article] [PubMed] [Google Scholar]
- 18.Yang Z., Stull J.T., Sweeney H.L. Changes in interfilament spacing mimic the effects of myosin regulatory light chain phosphorylation in rabbit psoas fibers. J. Struct. Biol. 1998;122:139–148. doi: 10.1006/jsbi.1998.3979. [DOI] [PubMed] [Google Scholar]
- 19.Irving T.C., Maughan D.W. In vivo x-ray diffraction of indirect flight muscle from Drosophila melanogaster. Biophys. J. 2000;78:2511–2515. doi: 10.1016/S0006-3495(00)76796-8. [DOI] [PMC free article] [PubMed] [Google Scholar]
- 20.Tohtong R., Yamashita H., Maughan D. Impairment of muscle function caused by mutations of phosphorylation sites in myosin regulatory light chain. Nature. 1995;374:650–653. doi: 10.1038/374650a0. [DOI] [PubMed] [Google Scholar]
- 21.Dickinson M.H., Hyatt C.J., Maughan D.W. Phosphorylation-dependent power output of transgenic flies: an integrated study. Biophys. J. 1997;73:3122–3134. doi: 10.1016/S0006-3495(97)78338-3. [DOI] [PMC free article] [PubMed] [Google Scholar]
- 22.Parker V.P., Falkenthal S., Davidson N. Characterization of the myosin light-chain-2 gene of Drosophila melanogaster. Mol. Cell. Biol. 1985;5:3058–3068. doi: 10.1128/mcb.5.11.3058. [DOI] [PMC free article] [PubMed] [Google Scholar]
- 23.Moore J.R., Dickinson M.H., Maughan D.W. The effect of removing the N-terminal extension of the Drosophila myosin regulatory light chain upon flight ability and the contractile dynamics of indirect flight muscle. Biophys. J. 2000;78:1431–1440. doi: 10.1016/S0006-3495(00)76696-3. [DOI] [PMC free article] [PubMed] [Google Scholar]
- 24.Farman G.P., Miller M.S., Irving T.C. Phosphorylation and the N-terminal extension of the regulatory light chain help orient and align the myosin heads in Drosophila flight muscle. J. Struct. Biol. 2009;168:240–249. doi: 10.1016/j.jsb.2009.07.020. [DOI] [PMC free article] [PubMed] [Google Scholar]
- 25.Miller M.S., Lekkas P., Vigoreaux J.O. Aging enhances indirect flight muscle fiber performance yet decreases flight ability in Drosophila. Biophys. J. 2008;95:2391–2401. doi: 10.1529/biophysj.108.130005. [DOI] [PMC free article] [PubMed] [Google Scholar]
- 26.Vink H. Precision measurements of osmotic pressure in concentrated polymer solutions. Eur. Polym. J. 1971;7:1411–1419. [Google Scholar]
- 27.Mulieri L.A., Barnes W., Maughan D.W. Alterations of myocardial dynamic stiffness implicating abnormal crossbridge function in human mitral regurgitation heart failure. Circ. Res. 2002;90:66–72. doi: 10.1161/hh0102.103221. [DOI] [PubMed] [Google Scholar]
- 28.Palmer B.M., Fishbaugher D.E., Maughan D.W. Differential cross-bridge kinetics of FHC myosin mutations R403Q and R453C in heterozygous mouse myocardium. Am. J. Physiol. Heart Circ. Physiol. 2004;287:H91–H99. doi: 10.1152/ajpheart.01015.2003. [DOI] [PubMed] [Google Scholar]
- 29.Kawai M., Saeki Y., Zhao Y. Crossbridge scheme and the kinetic constants of elementary steps deduced from chemically skinned papillary and trabecular muscles of the ferret. Circ. Res. 1993;73:35–50. doi: 10.1161/01.res.73.1.35. [DOI] [PubMed] [Google Scholar]
- 30.Palmer B.M., Suzuki T., Maughan D.W. Two-state model of acto-myosin attachment-detachment predicts C-process of sinusoidal analysis. Biophys. J. 2007;93:760–769. doi: 10.1529/biophysj.106.101626. [DOI] [PMC free article] [PubMed] [Google Scholar]
- 31.Stewart M., Morton D.J., Clarke F.M. Changes associated with glycolytic-enzyme binding in the equatorial x-ray-diffraction pattern of glycerinated rabbit psoas muscle. Biochem. J. 1979;183:663–667. doi: 10.1042/bj1830663. [DOI] [PMC free article] [PubMed] [Google Scholar]
- 32.Irving T.C., Millman B.M. Changes in thick filament structure during compression of the filament lattice in relaxed frog Sartorius muscle. J. Muscle Res. Cell Motil. 1989;10:385–394. doi: 10.1007/BF01758435. [DOI] [PubMed] [Google Scholar]
- 33.Brenner B., Xu S., Yu L.C. Radial equilibrium lengths of actomyosin cross-bridges in muscle. Biophys. J. 1996;71:2751–2758. doi: 10.1016/S0006-3495(96)79468-7. [DOI] [PMC free article] [PubMed] [Google Scholar]
- 34.Tregear R.T., Edwards R.J., Reedy M.K. X-ray diffraction indicates that active cross-bridges bind to actin target zones in insect flight muscle. Biophys. J. 1998;74:1439–1451. doi: 10.1016/S0006-3495(98)77856-7. [DOI] [PMC free article] [PubMed] [Google Scholar]
- 35.Irving T., Bhattacharya S., Maughan D. Changes in myofibrillar structure and function produced by N-terminal deletion of the regulatory light chain in Drosophila. J. Muscle Res. Cell Motil. 2001;22:675–683. doi: 10.1023/a:1016336024366. [DOI] [PubMed] [Google Scholar]
Associated Data
This section collects any data citations, data availability statements, or supplementary materials included in this article.