

Abstract
AIM: To develop a prognostic gene set that can predict patient overall survival status based on the whole genome expression analysis.
METHODS: Using Illumina HumanWG-6 BeadChip followed by semi-supervised analysis, we analyzed the expression of 47 296 transcripts in two batches of gastric cancer patients who underwent surgical resection. Thirty-nine samples in the first batch were used as the training set to discover candidate markers correlated to overall survival, and thirty-three samples in the second batch were used for validation.
RESULTS: A panel of ten genes were identified as prognostic marker in the first batch samples and classified patients into a low- and a high-risk group with significantly different survival times (P = 0.000047). This prognostic marker was then verified in an independent validation sample batch (P = 0.0009). By comparing with the traditional Tumor-node-metastasis (TNM) staging system, this ten-gene prognostic marker showed consistent prognosis results. It was the only independent prognostic value by multivariate Cox regression analysis (P = 0.007). Interestingly, six of these ten genes are ribosomal proteins, suggesting a possible association between the deregulation of ribosome related gene expression and the poor prognosis.
CONCLUSION: A ten-gene marker correlated with overall prognosis, including 6 ribosomal proteins, was identified and verified, which may complement the predictive value of TNM staging system.
Keywords: Gastric cancer, Gene expression profiling, Survival markers, Prognosis, Ribosomal proteins
INTRODUCTION
Gastric cancer is the second leading cause of cancer related death worldwide[1]. As a complex and heterogeneous disease, it comprises multiple tumor entities associated with distinctive histological patterns and biological features, as well as clinical behaviours[2]. The 5-year survival rate of patients with advanced disease is only 20%-30%[3]. The current treatment plan and prognosis prediction for gastric cancer mainly depend on the clinicopathologic staging of the disease, and TNM staging system is still the golden standard for survival prediction among gastric cancer patients. However, prognosis varies among patients with a similar tumor stage, therefore disease staging alone can not accurately predict the outcome for individual patients.
Although great efforts have been made in the identification of prognostic markers from gene expression profiling to improve prognosis prediction for many cancers especially breast cancer[4], limited research has been conducted in the field of gastric cancer. To date, most studies on the selection of prognosis markers were conducted by cDNA array or quantitative RT-PCR, in which only a few thousand genes were analyzed[5-9]. In an attempt to predict peritoneal relapse after gastrectomy for gastric cancer, the whole genome microarray consisting of 30K transcripts was employed in a very recent gene expression analysis[10]. Such a robust approach may provide not only more signals in marker selection, but also more comprehensive information in understanding molecular mechanisms of tumor-related processes. In this study, we explored the gene expression by microarray containing over 47K probes in two batches of surgical samples from 79 Chinese gastric cancer patients. A ten-gene marker for overall survival was identified and verified in an independent batch of samples.
MATERIALS AND METHODS
Patients and samples
Seventy-nine tissue samples from patients who were surgically treated for primary gastric carcinoma were procured at the Beijing Cancer Hospital (Peking University, School of Oncology) from 1999 to 2003. No patient received chemotherapy or radiotherapy before surgery. All patients were treated with curative surgical resection, which was, in some cases, followed by second-line treatment at the time of recurrence. Macroscopic and microscopic evaluations were conducted by pathologist according to the general rules for gastric cancer. Follow-up was performed every three month for the first two years, and every three to six months thereafter. Stage of gastric cancer was classified according to 2002 tumor-node-metastasis (TNM) classification system recommended by the American Joint Committee on Cancer.
Overall survival was calculated from the date of primary surgery to the date of last follow-up or to the date of death due to cancer relapse or metastasis. All tumor samples were obtained at the surgery, followed by fresh freezing in liquid nitrogen and stored at -80°C. Informed consent was obtained from each patient for the collection and storage of tissue samples in a tissue bank for future research. This investigation was performed after approval by Ethics Committee of Peking University.
RNA preparation and microarray analysis
Total RNA was purified from clinical samples using TRIzol reagent (GibcoBRL, Grand Island, New York, USA). And mRNA was linearly amplified by in vitro transcription using T7 RNA polymerase (MEGAscript T7 kit, Ambion, Inc, USA). The quality and integrity of total and amplified mRNA (cRNA) was monitored by both spectrophotometry (OD UV 260/280 ratio > 1.8) and agarose gel electrophoresis.
Gene-expression profiling was performed using Illumina HumanWG-6 BeadChip, which contains 47 296 transcripts. BeadChips were scanned with a BeadStation 500 GX and data are available at Gene Expression Omnibus (GSE21983). http://www.ncbi.nlm.nih.gov/geo).
Statistical analysis
Average normalization in BeadStudio software was conducted for probe level average normalization and background correction. A detection P value was used in BeadChip to calculate probability to see a certain signal level without specific probe-target hybridization. All genes and probes with P value > 0.01 were filtered and removed from the analysis. Among 47 296 transcripts, 18 819 were expressed with P values < 0.01.
The supervised principal components method was used for survival profiling[11]. In the training set, we calculated the modified univariate Cox proportional-hazard scores for all genes (n = 18 819), which were measured to identify genes with their expression correlated to the duration of survival. We selected a set of genes whose absolute Cox score exceeded a threshold using cross-validation. For each iteration of the complete cross-validation, 10% of the cases were omitted, and principal components derived from the remaining 90% of the cases were included in a Cox model to predict the survival in 10% of the cases. By repeating the iteration process for 10 times, we found that a threshold of 2.6 yielded the highest average partial log-likelihood ratio. Principal component analysis (PCA) was then performed using 10 transcripts whose absolute Cox score equalled or exceeded the threshold for all cases in the training data set. Kaplan-Meier survival curves were then plotted to predict overall survival. All analysis and plotting were conducted using R package superpc (http://www-stat.stanford.edu/~tibs/superpc).
Based on the transcript level in the 10 transcripts and the weight assigned to each transcript from the training set, a discrete risk score (the supervised principal components risk score) was then calculated for each patient in the validation dataset.
Multivariate analysis was conducted to evaluate the prediction accuracy of our survival profile in comparison with the standard clinicopathological covariates by Cox proportional hazards regression using SPSS software.
Functional gene set enrichment analysis was performed to find the pathways associated with prolonged and poor survivals. A total of 249 sets of canonical pathways (Gene Set Enrichment Analysis-Molecular Signatures Database) were analysed to indicate their correlations with overall survival to a greater degree than expected by chance[12].
RESULTS
Patient characteristics
Totally, 79 gastric cancer patients treated with surgical resection were recruited in this study. Samples were randomly separated into two batches with no significant differences between the two sets with respect to age, sex and other clinicopathological features. Microarray was conducted in all samples, and the data of batch one served as the training dataset for marker discovery and data of batch two as the validation dataset. In batch one, microarray Quality Control (QC) removed 7 samples due to failure in hybridization or failure to meet the analysis criteria, resulting in a total of 39 samples included in the training set. All of 33 samples in the second batch passed QC and were used in validation phase. The characteristics of the 72 patients are summarized in Table 1. The median overall survival time of all samples was 31 mo, ranging from 4.2 to 73.6 mo, and the 5-year overall survival was 33%.
Table 1.
Clinicopathological characteristics of all patients
| Variables | Cases | Training dataset(n = 39) | Validation dataset(n = 33) | P |
| Sex | ||||
| Male | 53 | 28 | 25 | 0.79 |
| Female | 19 | 11 | 8 | |
| Age (yr) | ||||
| mean ± SE | 72 | 60.9 ± 1.5 | 61.6 ± 1.3 | 0.74 |
| Depth of wall invasion | ||||
| T2 | 4 | 3 | 1 | 0.121 |
| T3 | 56 | 32 | 24 | |
| T4 | 12 | 4 | 8 | |
| Differentiation | ||||
| Well | 7 | 5 | 2 | 0.181 |
| Moderate | 31 | 14 | 17 | |
| Poor | 27 | 18 | 9 | |
| Undifferentiated2 | 7 | |||
| Lymph node metastasis | ||||
| Negative | 16 | 10 | 6 | 0.57 |
| Positive | 56 | 29 | 27 | |
| Distance metastasis | ||||
| M0 | 66 | 38 | 28 | 0.09 |
| M1 | 6 | 1 | 5 | |
| TNM stages | ||||
| I + II | 17 | 12 | 5 | 0.301 |
| III | 33 | 18 | 15 | |
| IV | 22 | 9 | 13 | |
The multiple comparisons of different subclasses;
Data was incomplete.
Gene expression profile associated with the overall survival
The “semi-supervised” learning approach was used to identify the gene expression profile related to the overall survival in the training dataset[12] (Figure 1). A total of 18 819 expression signals passed QC. First, we calculated the Cox scores of all 18 819 genes based on the survival times versus the expression levels obtained in 39 training observations. To choose the genes with the best prediction power, the threshold of Cox scores was calculated by 10-fold cross-validation. The expression profile of 10 transcripts whose Cox score equalled or exceeded the threshold was obtained (Table 2). Next, we performed PCA on the entire training set. For each case, a risk score that represents the sum of the weighted expression levels of the 10 prognostic transcripts was computed by supervised component analysis in a regression model. As shown in the Kaplan-Meier survival curves in Figure 2A and B, the patients were categorized into two groups based on their scores above or below the median risk of death. The low-risk group (n = 20) had a median survival of 42.1 mo, whereas the high-risk group (n = 19) had a median survival of only 26.5 mo. The correlation of the risk score and the survival status (P = 0.000047, log-rank) indicates that this transcriptional pattern was associated with the patient outcomes. A similar classification was also seen by TNM staging (P = 0.00016, log-rank; Figure 3A).
Figure 1.
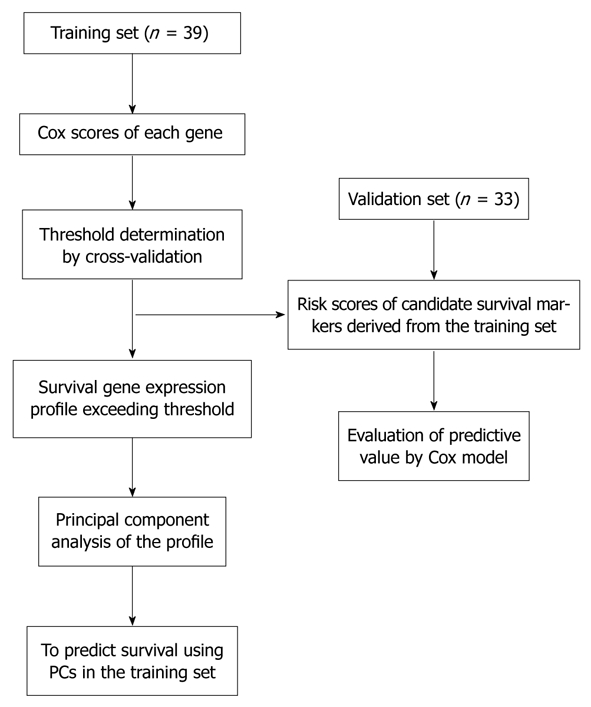
Overview of the strategy used for the development and validation of prognostic markers.
Table 2.
The ten-gene prognostic marker correlated to patients’ survival
| Symbol | Cox score | Description |
| RPS19 | 2.93 | Ribosomal protein S19 |
| RPS8 | 2.90 | Ribosomal protein S8 |
| RPS2P12 | 2.62 | Predicted ribosomal protein S2 |
| RPS12 | 2.59 | Ribosomal protein S12 |
| RPS15P4 | 2.57 | Predicted 40S ribosomal protein S15 |
| RPLP2 | 2.51 | Ribosomal protein, large, P2 |
| EIF3S6 | 2.61 | Eukaryotic translation initiation factor 3 |
| GLTSCR2 | 2.67 | Tumor suppressor candidate region gene 2 |
| TMSB10 | 2.47 | Thymosin, beta 10 |
| SEC61G | -2.98 | Sec61 gamma subunit |
Figure 2.

Overall survival curves and the expression profile of the ten-gene prognostic marker in the training dataset. A: The gene expression pattern of the ten-gene prognostic marker. Nine genes were associated with the prolonged survival and one gene with poor survival. Red, high expression; green, low expression; B: Kaplan-Meier survival curves based on the expression profile of the ten-gene prognostic marker; C: Overall survival curves according to the tumor-node-metastasis stages.
Figure 3.

Overall survival curves and the expression profile of the ten-gene prognostic marker in the validation dataset. A: The gene expression pattern of the ten-gene prognostic marker. Red, high expression; green, low expression; B: Kaplan-Meier survival curves based on the expression profile of the ten-gene prognostic marker; C: Overall survival curves according to the tumor-node-metastasis stages.
Among the ten-gene prognostic markers, high expression levels of 9 genes were associated with poor survival (Figure 2B). SEC61G, a subunit of the heteromeric SEC61 complex, was the only gene with its high expression associated with prolonged survival. Interestingly, six out of the 10 genes in this profile are either identified or predicted ribosomal proteins, including RPLP2, RPS12, RPS8, RPS19, RPS2P12, and RPS15P4. The involvement of numerous ribosomal genes with survival times suggested either their regulation by tumor suppressor or oncogenes, or their direct participation in certain pathways other than protein synthesis. Furthermore, RPS8 and RPS12 were previously reported as cancer related markers in colorectal tumor and cervical squamous cell carcinoma[13,14]. EIF3S6, a member of eukaryotic translation initiation factor 3, was identified as a prognostic factor in Stage I non-small cell lung cancers[15]. To test if the survival categories relate to known pathways, we applied gene set enrichment analysis (GSEA) to microarray data of 18 819 transcripts using 249 canonical gene sets collected by MsigDB. Glucocorticoid receptor (GCR) pathway gene set, referring to glucocorticoid receptor-related inhibition of inflammatory response, was significantly associated with the overall survival (FDR = 0.15, P = 0.004).
Independent validation of prognostic markers
Next we evaluated the ten-gene prognostic marker in an independent dataset containing 33 cancer samples. As shown in Figure 3A and B, based on the expression of these 10 genes, the patients were classified into either a “low-risk group” or “high-risk group” with significantly different survival times (P = 0.0009, log-rank). The low-risk group patients had a median survival of 31.7 mo whereas the high-risk group one had a median survival of 21.4 mo. The expression patterns of these 10 genes in validation set were also similar to the observation in the data training set (Figure 3B). The results in validation dataset showed the consistency of our ten-gene prognostic marker in survival prediction. For pathway analysis, no significant association was observed by GSEA.
Analysis of candidate survival markers with clinicopathological parameters
As certain clinicopathological parameters, especially TNM staging, have been used as prognosis indicators, we also compared our ten-gene prognostic marker with the clinicopathological characteristics in the validation dataset in order to assess the impact of clinicopathological factors on overall survival. First we examined the distribution of prognostic factors as a function of risk assignment based on our ten-gene prognostic marker (Table 3). Certain variation such as age was seen between high- and low-risk groups, while gender, tumor location and differentiation grade, the depth of wall invasion, and metastasis showed no significant difference between the two groups except for the TNM staging (P = 0.0023).
Table 3.
Association between different prognosis groups identified by the ten-gene marker and the clinicopathological characteristics
| Variables | Cases | Prolonged survival(n = 12) | Poor survival(n = 21) | P |
| Sex | ||||
| Male | 14 | 9 | 5 | 0.070 |
| Female | 18 | 3 | 15 | |
| Age (yr) | ||||
| mean ± SE | 33 | 58.1 ± 2.2 | 63.5 ± 1.5 | 0.040 |
| Depth of wall invasion | ||||
| T2 | 1 | 1 | 0 | 0.120 |
| T3 | 24 | 11 | 13 | |
| T4 | 8 | 0 | 8 | |
| Differentiation | ||||
| Well | 2 | 1 | 1 | 0.490 |
| Moderate | 17 | 8 | 9 | |
| Poor | 9 | 2 | 7 | |
| Undifferentiated1 | 5 | |||
| Lymph Node Metastasis | ||||
| Negative | 6 | 4 | 2 | 0.160 |
| Positive | 27 | 8 | 19 | |
| Distance metastasis | ||||
| M0 | 28 | 12 | 16 | 0.080 |
| M1 | 5 | 0 | 5 | |
| TNM stages | ||||
| II | 5 | 5 | 0 | 0.002 |
| III | 15 | 5 | 10 | |
| IV | 13 | 2 | 11 | |
Data was incomplete. P values for stage, grade and location of tumors were derived from the Pearson χ2 test. P value for age was derived from the t test.
Since the TNM staging is used most widely in clinical prognosis prediction, we compared the predictive power of our survival markers with the TNM staging. All the TNM stage II patients were categorized into the low-risk group and the entire high-risk group patients were in stage III or IV. A consistency between TNM staging and the staging was found by the ten-gene marker. However, two IIIb patients of the low-risk group had a survival of 63.7 and 22.5 mo at last follow-up, respectively. By Kaplan-Meier survival plots and log-rank tests, we assessed the patient survival status predicted by our prognosis candidates and TNM staging. Relatively more accurate predictions were shown by the ten-gene prognostic marker in both sample groups (TNM, P = 0.00016 and P = 0.0023; survival markers P = 0.000047 and P = 0.0009, Figure 2B and C, Figure 3B and C). As a result, in multivariate analysis, our ten-gene marker was the only independent indicator in prognosis prediction with statistical significance (P = 0.007; Hazard ratio 0.13; 95% CI: 0.29-0.56, Table 4).
Table 4.
Multivariate Cox regression for overall survival in validation dataset
| Variables | P | HR | CI (95%) |
| Depth of wall invasion | 0.370 | 1.66 | 0.55-4.90 |
| Differentiation | 0.240 | 4.93 | 0.15-1.58 |
| Lymph node metastasis | 0.780 | 0.77 | 0.13-4.53 |
| Distance metastasis | 0.120 | 0.32 | 0.08-1.35 |
| Ten-gene prognostic marker | 0.007 | 0.13 | 0.29-0.56 |
CI: Confidence interval; HR: Hazard ratio.
DISCUSSION
It has been known that the environment and genetic background among ethnic groups correlate to the genesis and development of gastric cancer[16]. Up until now, very limited studies have been conducted in finding prognosis markers for gastric cancer, especially in the Chinese population. Moreover, only one set of prognosis markers was reported recently using the whole genome microarray (> 30K), which, however, could predict peritoneal relapse but not overall survival[10]. In addition, in previous reports, by the classical supervised method to select survival markers, ‘‘low-risk’’ and ‘‘high-risk’’ subgroups are contrived based on survival times before analysis. Such a subjective step may result in bias for next process or lead to the classification which is not biologically meaningful. Therefore, in this study, we adopted a supervised PCA strategy to build prognosis profiles with the consideration of survival time as continuous parameters[11]. And based on the whole genome expression profiling, we found and verified a set of ten genes as candidate survival markers from the discovery panel of 39 samples and the validation panel of 33 samples.
In these 10 survival genes markers, 3 genes (RPS12, EIF3S6, RPS19) were previously reported as candidate markers of diagnosis or prognosis in various types of cancers[13,17,18]. TMSB10, a migration-inducing gene, was shown to relate to cancer metastasis[19]. Additionally, a few genes (RPS19, RPLP2, GLTSCR2) are known factors involved in cell cycle control and apoptosis[20-22]. None of our 10 markers was reported in other sets of candidate genes for gastric cancer prognosis[5-8]. This is not a surprise since these 10 genes were selected based on the whole genome expression profiling followed by supervised PCA, whereas much less genes were included in earlier studies with the analysis strategy of supervised classification. Patients’ genetic background may also contribute to such diversity.
Unexpectedly but also interestingly, 6 out of 10 candidate markers identified are ribosomal proteins (RPs). There may be a few explanations for this phenomenon. First, RPs have been shown to be the targets of several tumor suppressors and proto-oncogenes which affect the formation of the mature ribosomes or regulate the activity of proteins[23]. Moreover, the deregulated expression of RPs was reported to associate with the carcinogenesis and metastasis of various cancers[14]. Therefore, besides their unknown mechanisms possibly related to p53 and MYC[24,25]. RPs appear to have various cellular roles independent of protein biosynthesis, including their functions in DNA replication and DNA repair, transcription, RNA splicing and modification, cell proliferation, apoptosis, and cellular transformation.[26] Among 6 RPs of our candidate prognosis markers, RPLP2, RPL19, RPS8 and RPS12 were all found to be involved in the carcinogenesis and progression of various cancers[13,17,27]. RPS12 was also seen to have significant higher expression in gastric tumors in comparison with normal tissues in Chinese[28].
In a number of diagnosis and prognosis sets identified in expression profiling from various cancer researches, the gene profile in most panels came from various pathways with different cellular functions. The result of our ten-gene prognostic marker containing 6 RPs raised another interesting issue on the molecular composition of biomarkers, i.e. which type is more powerful and more accurate in prediction, a set consisting of single gene tags from multiple individual pathways, or a group of genes from a few and related pathways. This issue needs more tests and evaluations for convincible answers. At this point, however, a few facts shall be brought into attention. First, our prognostic marker resulted from systematic analysis of whole genome expression profiling, and our strategy of supervised PCA largely reduced subjective attribution in analysis. Thus, a group of pinpointed signals will be more representative in biological meaning, thus providing more accurate prediction. Second, obviously in comparison with individual single signatures from multi-pathways, a group of signals would significantly overcome the individual bias, in which the pathway components in tumors vary widely[29]. Finally, it has been shown that even for genetic alterations of a large number of genes in cancer, these variations may function through a relatively small number of pathways and processes[29]. In our prognosis marker, although the details of the interrelationship among those 6 RPs are still unknown, they have the same elevation in high-risk group, indicating the concordance of their functions in gastric cancer.
To reduce the heterogeneity among patients and samples which may bring bias to the analysis in this study, samples were randomly separated into training and validation batches. And no significant difference with respect to age, sex and other clinicopathological factors was found between the two batches (Table 1). And, by comparing clinicopathological factors between the high-risk group and low-risk group predicted by ten-gene markers, there was no significant difference between the two groups except for TNM staging (Table 3). Then we compared this ten-gene prognostic marker with TNM staging system. Both ten-gene prognostic marker and TNM classification can predict survival with statistical significances in discovery and validation sample batches (Figure 2C and 3C), indicating that our prognosis set can effectively complement traditional clinicopathological staging (Figure 2B and C, Figure 3B and C). The applicability of a marker with only 10 genes also suggests its potential to be developed as the prognosis marker panel for pre-operative molecular staging from endoscopic biopsy. Further validation with large scale samples are warranted for clinical application.
In conclusion, based on the whole genome expression profiling, we found and validated a ten-gene prognostic marker for overall survival prognosis of gastric cancer patients, which may be used with the TNM staging system as a parallel and complementary approach. However, the predominance of ribosome protein genes in our molecular prognostic marker warrants further research on their roles in cancer progression.
COMMENTS
Background
Gastric cancer is the second leading cause of cancer related death in China and worldwide. The 5-year survival rate of patients with advanced disease is very poor. Currently, treatment plan and prognosis prediction for gastric cancer mainly depend on the clinicopathological staging. However, prognosis varies among patients with the same clinicalpathological stage. An individualized expression test for selected markers in biopsy and surgical samples will complement the current staging system, especially for prognosis prediction.
Research frontiers
The gene expression profiling has enabled researchers to quantify the biological states and consequently to uncover the subtle phenotypes in cancer. Such analyses have provided unique opportunities to develop various profiles that can distinguish, identify, and classify discrete subsets of disease, predict the disease outcome, and even predict the response to therapy.
Innovations and breakthroughs
In this study, based on the whole genome expression profiling, the authors identified and validated a ten-gene set that can be further developed as clinical prognosis markers to predict overall survival of gastric cancer patients. This marker set showed consistent prognosis results with the traditional Tumor-node-metastasis (TNM) staging system. The findings in this study also provided new clues about the possible association between the deregulation of ribosome related gene expression and survival status of the patients after surgery.
Applications
Based on the whole genome expression profiling, a ten-gene prognostic marker set for overall survival prognosis of gastric cancer patients may be applied in combination with the TNM staging system as a parallel and complementary approach. However, the predominance of ribosome protein genes in these molecular prognostic markers awaits for further research on their roles in cancer progression.
Terminology
TNM: The TNM system is one of the most widely used staging systems in tumor classification. The system is based on the extent of the tumor (T), the extent of spread to the lymph nodes (N), and the presence of distant metastasis (M). A number is added to each letter to indicate the size or extent of the primary tumor and the extent of cancer spread. Principal component analysis (PCA): A mathematical tool used to reduce the number of variables while retaining the original variability of the data. The first principal component accounts for as much of the variability in the data as possible, and each succeeding component accounts for as much of the remaining variability as possible. Gene set enrichment analysis (GSEA): A computational method that determines whether a prior identified set of genes shows statistically significant, concordant differences between two biological states. It is a method which focuses on the analysis at the level of functional related gene sets instead of a single gene. It helps biologists to interpret the DNA microarray data by their previous biological knowledge of the genes in a gene set. GSEA has been shown to efficiently identify gene sets containing known disease-related genes in the real experiments.
Peer review
A ten-gene prognostic marker, including 6 ribosomal proteins, for overall survival prognosis of gastric cancer were identified and validated based on whole genome expression profiling. By comparing with the traditional TNM staging system, this ten-gene prognostic marker showed consistent prognosis results, which may complement the predictive value of current TNM staging system.
Acknowledgments
We would like to thank Dr. Yong Tao and Dr. Wei-Wei Zhai for their excellent suggestions and assistance in improving our manuscript.
Footnotes
Supported by the National 863 Program (SQ2009AA02XK1482570 and 2006AA02A402), Beijing Municipal Committee of Science and Technology (D0905001040631) and Beijing Capital Development Foundation of Health Bureau (2007-2051)
Peer reviewer: Jian-Zhong Zhang, Professor, Department of Pathology and Laboratory Medicine, Beijing 306 Hospital, 9 North Anxiang Road, PO Box 9720, Beijing 100101, China
S- Editor Sun H L- Editor Ma JY E- Editor Ma WH
Table 3 Association between different prognosis groups identified by the ten-gene marker and the clinicopathological characteristics
References
- 1.Smith JK, McPhee JT, Hill JS, Whalen GF, Sullivan ME, Litwin DE, Anderson FA, Tseng JF. National outcomes after gastric resection for neoplasm. Arch Surg. 2007;142:387–393. doi: 10.1001/archsurg.142.4.387. [DOI] [PubMed] [Google Scholar]
- 2.Werner M, Becker KF, Keller G, Höfler H. Gastric adenocarcinoma: pathomorphology and molecular pathology. J Cancer Res Clin Oncol. 2001;127:207–216. doi: 10.1007/s004320000195. [DOI] [PubMed] [Google Scholar]
- 3.Dicken BJ, Bigam DL, Cass C, Mackey JR, Joy AA, Hamilton SM. Gastric adenocarcinoma: review and considerations for future directions. Ann Surg. 2005;241:27–39. doi: 10.1097/01.sla.0000149300.28588.23. [DOI] [PMC free article] [PubMed] [Google Scholar]
- 4.Sotiriou C, Pusztai L. Gene-expression signatures in breast cancer. N Engl J Med. 2009;360:790–800. doi: 10.1056/NEJMra0801289. [DOI] [PubMed] [Google Scholar]
- 5.Teramoto K, Tada M, Tamoto E, Abe M, Kawakami A, Komuro K, Matsunaga A, Shindoh G, Takada M, Murakawa K, et al. Prediction of lymphatic invasion/lymph node metastasis, recurrence, and survival in patients with gastric cancer by cDNA array-based expression profiling. J Surg Res. 2005;124:225–236. doi: 10.1016/j.jss.2004.10.003. [DOI] [PubMed] [Google Scholar]
- 6.Motoori M, Takemasa I, Doki Y, Saito S, Miyata H, Takiguchi S, Fujiwara Y, Yasuda T, Yano M, Kurokawa Y, et al. Prediction of peritoneal metastasis in advanced gastric cancer by gene expression profiling of the primary site. Eur J Cancer. 2006;42:1897–1903. doi: 10.1016/j.ejca.2006.04.007. [DOI] [PubMed] [Google Scholar]
- 7.Chen CN, Lin JJ, Chen JJ, Lee PH, Yang CY, Kuo ML, Chang KJ, Hsieh FJ. Gene expression profile predicts patient survival of gastric cancer after surgical resection. J Clin Oncol. 2005;23:7286–7295. doi: 10.1200/JCO.2004.00.2253. [DOI] [PubMed] [Google Scholar]
- 8.Motoori M, Takemasa I, Yano M, Saito S, Miyata H, Takiguchi S, Fujiwara Y, Yasuda T, Doki Y, Kurokawa Y, et al. Prediction of recurrence in advanced gastric cancer patients after curative resection by gene expression profiling. Int J Cancer. 2005;114:963–968. doi: 10.1002/ijc.20808. [DOI] [PubMed] [Google Scholar]
- 9.Inoue H, Matsuyama A, Mimori K, Ueo H, Mori M. Prognostic score of gastric cancer determined by cDNA microarray. Clin Cancer Res. 2002;8:3475–3479. [PubMed] [Google Scholar]
- 10.Takeno A, Takemasa I, Seno S, Yamasaki M, Motoori M, Miyata H, Nakajima K, Takiguchi S, Fujiwara Y, Nishida T, et al. Gene expression profile prospectively predicts peritoneal relapse after curative surgery of gastric cancer. Ann Surg Oncol. 2010;17:1033–1042. doi: 10.1245/s10434-009-0854-1. [DOI] [PubMed] [Google Scholar]
- 11.Bair E, Tibshirani R. Semi-supervised methods to predict patient survival from gene expression data. PLoS Biol. 2004;2:E108. doi: 10.1371/journal.pbio.0020108. [DOI] [PMC free article] [PubMed] [Google Scholar]
- 12.Subramanian A, Tamayo P, Mootha VK, Mukherjee S, Ebert BL, Gillette MA, Paulovich A, Pomeroy SL, Golub TR, Lander ES, et al. Gene set enrichment analysis: a knowledge-based approach for interpreting genome-wide expression profiles. Proc Natl Acad Sci USA. 2005;102:15545–15550. doi: 10.1073/pnas.0506580102. [DOI] [PMC free article] [PubMed] [Google Scholar]
- 13.Cheng Q, Lau WM, Chew SH, Ho TH, Tay SK, Hui KM. Identification of molecular markers for the early detection of human squamous cell carcinoma of the uterine cervix. Br J Cancer. 2002;86:274–281. doi: 10.1038/sj.bjc.6600038. [DOI] [PMC free article] [PubMed] [Google Scholar]
- 14.Lai MD, Xu J. Ribosomal proteins and colorectal cancer. Curr Genomics. 2007;8:43–49. doi: 10.2174/138920207780076938. [DOI] [PMC free article] [PubMed] [Google Scholar]
- 15.Buttitta F, Martella C, Barassi F, Felicioni L, Salvatore S, Rosini S, D’Antuono T, Chella A, Mucilli F, Sacco R, et al. Int6 expression can predict survival in early-stage non-small cell lung cancer patients. Clin Cancer Res. 2005;11:3198–3204. doi: 10.1158/1078-0432.CCR-04-2308. [DOI] [PubMed] [Google Scholar]
- 16.Vogiatzi P, Vindigni C, Roviello F, Renieri A, Giordano A. Deciphering the underlying genetic and epigenetic events leading to gastric carcinogenesis. J Cell Physiol. 2007;211:287–295. doi: 10.1002/jcp.20982. [DOI] [PubMed] [Google Scholar]
- 17.Bee A, Ke Y, Forootan S, Lin K, Beesley C, Forrest SE, Foster CS. Ribosomal protein l19 is a prognostic marker for human prostate cancer. Clin Cancer Res. 2006;12:2061–2065. doi: 10.1158/1078-0432.CCR-05-2445. [DOI] [PubMed] [Google Scholar]
- 18.Huang CJ, Chien CC, Yang SH, Chang CC, Sun HL, Cheng YC, Liu CC, Lin SC, Lin CM. Faecal ribosomal protein L19 is a genetic prognostic factor for survival in colorectal cancer. J Cell Mol Med. 2008;12:1936–1943. doi: 10.1111/j.1582-4934.2008.00253.x. [DOI] [PMC free article] [PubMed] [Google Scholar]
- 19.Maelan AE, Rasmussen TK, Larsson LI. Localization of thymosin beta10 in breast cancer cells: relationship to actin cytoskeletal remodeling and cell motility. Histochem Cell Biol. 2007;127:109–113. doi: 10.1007/s00418-006-0208-z. [DOI] [PubMed] [Google Scholar]
- 20.Yim JH, Kim YJ, Ko JH, Cho YE, Kim SM, Kim JY, Lee S, Park JH. The putative tumor suppressor gene GLTSCR2 induces PTEN-modulated cell death. Cell Death Differ. 2007;14:1872–1879. doi: 10.1038/sj.cdd.4402204. [DOI] [PubMed] [Google Scholar]
- 21.Miyake K, Utsugisawa T, Flygare J, Kiefer T, Hamaguchi I, Richter J, Karlsson S. Ribosomal protein S19 deficiency leads to reduced proliferation and increased apoptosis but does not affect terminal erythroid differentiation in a cell line model of Diamond-Blackfan anemia. Stem Cells. 2008;26:323–329. doi: 10.1634/stemcells.2007-0569. [DOI] [PubMed] [Google Scholar]
- 22.Martinez-Azorin F, Remacha M, Ballesta JP. Functional characterization of ribosomal P1/P2 proteins in human cells. Biochem J. 2008;413:527–534. doi: 10.1042/BJ20080049. [DOI] [PubMed] [Google Scholar]
- 23.Voit R, Hoffmann M, Grummt I. Phosphorylation by G1-specific cdk-cyclin complexes activates the nucleolar transcription factor UBF. EMBO J. 1999;18:1891–1899. doi: 10.1093/emboj/18.7.1891. [DOI] [PMC free article] [PubMed] [Google Scholar]
- 24.Zhang Y, Lu H. Signaling to p53: ribosomal proteins find their way. Cancer Cell. 2009;16:369–377. doi: 10.1016/j.ccr.2009.09.024. [DOI] [PMC free article] [PubMed] [Google Scholar]
- 25.Barna M, Pusic A, Zollo O, Costa M, Kondrashov N, Rego E, Rao PH, Ruggero D. Suppression of Myc oncogenic activity by ribosomal protein haploinsufficiency. Nature. 2008;456:971–975. doi: 10.1038/nature07449. [DOI] [PMC free article] [PubMed] [Google Scholar]
- 26.Wool IG. Extraribosomal functions of ribosomal proteins. Trends Biochem Sci. 1996;21:164–165. [PubMed] [Google Scholar]
- 27.Gardner-Thorpe J, Ito H, Ashley SW, Whang EE. Ribosomal protein P2: a potential molecular target for antisense therapy of human malignancies. Anticancer Res. 2003;23:4549–4560. [PubMed] [Google Scholar]
- 28.Sun XJ, Hao DM, Zheng ZH, Fu H, Xu HM, Wang MX, Sun KL. [Screening and analysis of associated genes in the carcinogenesis and progression of gastric cancer] Zhonghua Yixue Yichuanxue Zazhi. 2005;22:31–34. [PubMed] [Google Scholar]
- 29.Jones S, Zhang X, Parsons DW, Lin JC, Leary RJ, Angenendt P, Mankoo P, Carter H, Kamiyama H, Jimeno A, et al. Core signaling pathways in human pancreatic cancers revealed by global genomic analyses. Science. 2008;321:1801–1806. doi: 10.1126/science.1164368. [DOI] [PMC free article] [PubMed] [Google Scholar]