

Abstract
Cys-loop receptors constitute a superfamily of ion channels gated by ligands such as acetylcholine, serotonin, glycine, and γ-aminobutyric acid. All of these receptors are thought to share structural characteristics, but due to high sequence variation and limited structure availability, our knowledge about allosteric binding sites is still limited. These sites are frequent targets of anesthetic and alcohol molecules, and are of high pharmacological importance. We used molecular simulations to study ethanol binding and equilibrium exchange for the homomeric α1 glycine receptor (GlyRα1), modeled on the structure of the Gloeobacter violaceus pentameric ligand-gated channel. Ethanol has a well-known potentiating effect and can be used in high concentrations. By performing two microsecond-scale simulations of GlyR with/without ethanol, we were able to observe spontaneous binding in cavities and equilibrium ligand exchange. Of interest, it appears that there are ethanol-binding sites both between and within the GlyR transmembrane subunits, with the intersubunit site having the highest occupancy and slowest exchange (∼200 ns). This model site involves several residues that were previously identified via mutations as being crucial for potentiation. Finally, ethanol appears to stabilize the GlyR model built on a presumably open form of the ligand-gated channel. This stabilization could help explain the effects of allosteric ligand binding in Cys-loop receptors.
Introduction
The Cys-loop receptors are a family of ligand-gated ion channels (LGIC) that mediate fast signal transduction across synapses. These receptors are assemblies of five subunits that define a central pore channel in the transmembrane domain (TMD), which opens selectively to ions upon binding of an agonist in the extracellular domain (ECD). The Cys-loop receptor superfamily includes two types of receptors: 1), excitatory cation-selective receptors, such as nicotinic acetylcholine receptors (nAChRs) and serotonin receptors; and 2), inhibitory anion-selective receptors, such as glycine receptors (GlyRs) and γ-aminobutyric acid receptors (GABAAR).
Cys-loop receptors are essential mediators of information and modulation within the nervous system, and as such they are the targets of many drugs, including nicotine, alcohol, cannabinoids, steroids, barbiturates, inhaled solvents, and anesthetics. As a consequence, they are excellent targets for treatment of drug abuse and psychiatric disorders, as well as for general anesthesia. Moreover, dysfunction of these receptors leads to numerous channelopathies, including epilepsy and startle disease.
Since the identification of the first Cys-loop receptor, remarkable progress has been made in understanding Cys-loop structure-function relationships. The crystal structure of acetylcholine binding protein (AChBP) (1), a homolog of nAChR ECD, enabled a greater understanding of the link between structure and function, and many biochemical and electrophysiological studies have examined the binding of agonist to Cys-loop receptors. Of equal importance, the Unwin structure of nAChR (2) provided a major breakthrough in elucidating the molecular determinants of ion selectivity in the pore channel. However, the various receptors can have very different functions. Wheras nAChR and the serotonin receptor 5-HT3 are cation-selective and cause an action potential on depolarization, GlyR and GABAAR are anion-selective and cause inhibition by hyperpolarization of the neuron. In this work, we were particularly concerned with the latter receptors.
Up to now, the activation process ranging from the binding of an agonist in the ECD to conformational changes in the TMD has remained elusive. Although the agonist-binding site is ∼50 Å from the pore channel, it is thought that the conformational changes induced by agonist binding are transduced by interactions between the membrane facing loops of the ECD and pre-TM1 region with the TM2-TM3 loop in the TMD (3). Moreover, only a few ligand molecules, such as ethanol, are required to modulate the opening process to induce this so-called potentiating effect (4). For glycine receptors, this is manifested by the ability of alcohol and anesthetic molecules to significantly reduce the amount of glycine required for GlyR activation.
The exact role played by these molecules in the potentiating effect of GlyR is unclear, and it is possible that they act by perturbing the membrane. However, a few residues in the TMD of GlyR (I229, S267, A288, and R271) were recently shown to influence the potentiating effect of these molecules (5). These residues are thought to line a water-filled cavity in the TMD, although the exact location of this cavity, which could be common for Cys-loop receptors, is the subject of controversy. No experimentally derived GlyR structure is available; however, at least two locations of potentiating binding sites have been proposed, both of which are in the TMD (one in the subunit itself and the other between two subunits).
The coupling of the ECD with the TMD opening process seems to have been exceptionally well conserved evolutionarily, which is important given the recent publications of three-dimensional, high-resolution structures for bacterial homologs of Cys-loop proteins (6–8). The first one presented the structure of a proton-gated analog of LGICs from the bacterium Erwinia chrysanthemi (ELIC) in a presumably closed state (6). The second and third structures concern Gloeobacter violaceus (GLIC) in a presumably open state (7,8). Although ELIC and GLIC are not Cys-loop receptors, they are pentameric LGICs with reasonable sequence conservation to LGICs (16% and 17% sequence identity between nAChRα and ELIC/GLIC, respectively), and in particular to GlyRα1 (23% and 24%, respectively). Surprisingly, GlyRα1 is more similar to ELIC/GLIC than to nAChRα (19%). These structures thus provide important new templates for improved homology modeling. Nevertheless, without any dynamics and binding information, these structures alone are not sufficient to discern the different steps that occur during this gating process. Molecular simulation studies provide a useful complement to better understand these opening processes and their modulation. Molecular-dynamics (MD) simulations of Cys-loop receptors have been widely used since the publication of the first low-resolution nAChR structure from torpedo fish. An investigation of the interaction of cholesterol with the nAChR TMD showed preservation of the experimental structure (9). Cheng et al. (10) first studied the effect of ethanol on the TMD of the different subunits of GlyR when placed close to important residues and subjected to short simulations. They proposed that the potentiating effect of ethanol on GlyR might be influenced by an intersubunit binding pocket in the open state.
Early MD simulations were based on homology structures derived from the 4 Å resolution nAChR structure. The new higher-resolution templates of ELIC and GLIC will help improve the accuracy of homology modeling and MD simulations. Furthermore, the recent development of efficient parallel algorithms for simulations will allow MD simulations of even large ion channels to reach the microsecond timescale (11). These advances make it possible to study much slower processes, such as spontaneous gating, binding, and interactions between ligands and receptors. Some of the most important investigations of LGICs include those by Nury et al. (12), who used a microsecond simulation of GLIC to induce gating by forcing a change in protonation states, and Brannigan et al. (13), who identified multiple isoflurane-binding sites in nAChR from molecular simulations.
Because the homopentameric human α1 GlyRs have been shown to be functional (14), we used homology models of a homomeric GlyRα1 based on GLIC in the likely open low-pH state and embedded in a lipid membrane. To investigate the effects of ethanol binding, we created two molecular systems: one with a concentration of 1 mol % of ethanol (555 mM), and an identical control system without ethanol. A concentration of ∼18 mM is considered to cause impairment for driving, whereas 200 mM is approximately an anesthetic concentration. Here, we used an even higher concentration to facilitate equilibration on the microsecond scale. The ethanol was only placed in the bulk water phase, 8 Å away from the receptor and membrane. The primary questions we are trying to address with these simulations are 1), where does ethanol bind in GlyR; 2), how does it get there (through the pore or the membrane); and 3), do alcohol and anesthetic molecules affect GlyR dynamics in relation to their potentiating effect?
Materials and Methods
Initial model
We constructed a model of GlyRα1 by aligning its sequence (see Fig. S1 in the Supporting Material) using HHpred (15) to GLIC, PDB code 3EAM (7). Modeler (16) was used to build coordinates from the alignment, including constraints from known disulfides (cysteines 198, 209 and 138, 152). To simplify the process, the ECDs and TMDs were first modeled separately and only for one of the five subunits. Next, we constructed a complete model of one subunit by superimposing the ECD and TMD on each of the subunits in the template, and then rebuilding of the linker region. Finally, we superimposed the modeled subunit onto the template oligomer to generate the fivefold symmetric complex. As a last step, the backbone-dependent rotamer library SCWRL (17) was used to rebuild all side chains.
MD simulation
We inserted the GlyRα1 model into a pure DOPC bilayer by deleting all overlapping lipid molecules, keeping 278 DOPC lipids. The system was solvated with 35,769 TIP3P water molecules in a hexagonal box with (11.1 nm wide, 15.8 nm high). To neutralize the net charge and achieve physiological ion concentrations, 79 and 64 water molecules were replaced by Na+ and Cl− ions, respectively. We performed the simulations using Gromacs 4 (18) with the Amber 03 force field (19) for protein and ions, TIP3P (20) parameters for water, and the Berger force field for DOPC (21). All bonds were constrained via the LINCS algorithm, allowing a time step of 2.5 fs. Particle mesh Ewald electrostatics was used with a 10 Å cutoff for nonbonded interactions and neighbor lists updated every 10 steps. Three baths (protein, membrane, and water/ion) were coupled to a temperature of 310 K using velocity rescaling with a time constant of τT = 0.1 ps. The x/y dimensions were scaled isotropically with a Berendsen weak barostat, and the z dimension was scaled independently to a reference pressure of 1 bar, τP = 1 ps, and compressibility of 4.5 × 10⁻⁵ bar−1. The system was minimized for 10,000 steps with steepest descent. It was equilibrated with position restraints of 1000 kJ/mol/nm2 on the protein for 10 ns with restraints on heavy atoms, 5 ns with backbone restraints, and finally 5 ns with Cα restraints.
Glycine ligands were added to each of the five binding sites in the ECD. Within each subunit interface, a glycine was docked on the C-loop region with the use of Glide (22). After 140 ns of equilibration, three of the five glycines left their initial site. Although only two glycines per receptor are believed to be enough for activation, we decided to restrain the positions of all glycines in their binding site to improve the averages. Because R65 and E157 are supposed to be involved in salt bridges with the glycine (23,24), we introduced two distance restraints: one between the carboxylate carbon of glycine and the Cz of R65, and one between the amine nitrogen of the glycine and the Cδ of E157. These restraints were progressively relaxed (5 ns of equilibration with 4 Å deviations allowed, 5 ns with 5 Å allowed, and then production runs with 7 Å deviations allowed). The control system was equilibrated for 30 ns before production, after which it was copied to create an ethanol system.
Ethanol was added by replacing 1% of waters (356) at least 8 Å away from the protein; none were placed inside the protein pore. The system was again subjected to 10,000 steps of minimization. The control system contained 147,463 atoms and the ethanol system contained 149,599 atoms (Fig. 1). Each system was then used for a 1-μs production run.
Figure 1.
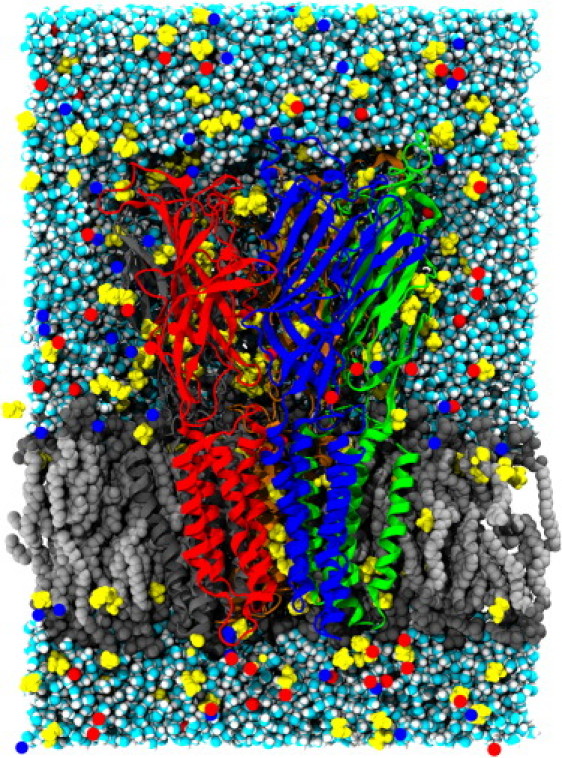
GlyRα1 embedded in a DOPC lipid bilayer after 200 ns of simulation. GlyRα1 is represented in cartoon. Water and DOPC molecules are displayed as van der Waals spheres, Na+ and Cl− ions are shown as single spheres, and the larger ethanol molecules are shown in space-filling representation.
The pore radii of the trajectories were computed with HOLE software (25), extracted each nanosecond and averaged. Average densities were computed with the Volmap plug-in of VMD (26) with a resolution of 1 Å and averaged over the trajectory. Cavity volumes were computed with VOIDOO (27), with water/ethanol removed, a probe radius of 1.4 Å, a grid spacing of 1 Å, and 10 refinement cycles. Ligand and water occupancy was defined from the molecule center-of-mass falling inside this cavity space.
Results
Control simulation
The most important factor in the stability of the initial GlyRα1 model structure is the homology modeling. Because of the relatively modest sequence identity (23%), side-chain rebuilding could cause structural drift. Since the 3EAM structure does not have the intracellular domain between TM3 and TM4 that is found in most LGICs, we removed this part, as well as the first 24 N-terminal residues, from the model.
GlyRα1 showed good stability in the simulations. The Cα root mean-square displacement (RMSD) relative to the initial GlyRα1 model increased during the first 150 ns but then slowed down. Overall, Cα RMSD reached 5 Å for the entire oligomer, even though the secondary structures within the ECD of the GlyRα1 are mainly composed of coils and loops, which are known for high fluctuations. The RMSDs for α-helices and β-sheets remained at ∼3.75 Å, and the whole TMD RMSD remained at ∼3.2 Å (Fig. 2), close to the experimental resolution. The root mean-square fluctuations (RMSF) for the five subunits showed the same overall profile, with stable secondary structure and highly fluctuating loops. The transmembrane helices were the most stable structures; in particular, TM2 showed fluctuations of only 0.6 Å. TM4 was the least stable helix, likely due to its C-terminal position. Loop and coil structures within the TMD displayed higher fluctuations at ∼1.5–3 Å. The most variable parts of the protein were the N-terminal extremities and the β2-β3 loop (the longest loop in GlyRα1) and the short glycine link between TM3 and TM4.
Figure 2.
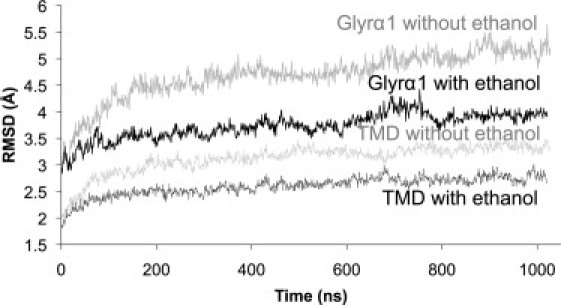
RMSD of GlyRα1 from the initial homology model structure. The black and gray lines represent the GlyRα1 with and without ethanol, respectively. The solid lines indicate the Cα RMSD of the whole protein, and the dashed lines are the Cα RMSD of the TMD, including residues 220–410 (the TM3-TM4 loop was replaced with three glycines).
Because some parts of GlyRα1 were removed from our model in the N-terminal region, as well as the TM3-TM4 loop, it is not surprising to find the highest fluctuations in these locations. The equilibration of GlyRα1 in the membrane was relatively slow, and it appeared to require at least 150 ns before the initial drift slowed down in the RMSD curves. After the equilibration, the RMSD in the TMD domain (the most studied part of the Cys-loop family) was ∼2.4/2.7 Å with/without ethanol present, and this only increased very slightly out to the full microsecond. The overall stability of the simulations supports a reasonably good quality of our GlyRα1 model.
The average pore radius was stable over the whole trajectory (Fig. S2) and did not show any remarkable differences relative to the initial homology model. The pore radius was constricted in two positions. The extracellular portion showed a large vestibule that constricted tightly toward the TMD region. The narrowest part of the pore was defined by the hydrophobic ring of L9′ (L261 in GlyRα1 sequence numbering) with a pore radius of 1.4 Å. This part of the pore, also called the equatorial leucine ring, was previously identified as a key element for ion gating (28). Since then, numerous works, including MD simulations, have shown the efficiency of the hydrophobic barrier for preventing ion permeation. A small hydrophilic vestibule that contained ∼20 molecules of water was delimited by this leucine ring and a second barrier. The second constriction was defined by the P-2′ (P250) ring with a larger radius of 2.3 Å. This particular residue has been shown to be involved in anion/cation selectivity (28,29), and could be the actual ion-selectivity gate. During the simulation, waters frequently crossed the two constricted portions of the channel and they rarely remained in this part of the pore.
Characterization of the open-channel state
Considering that the narrowest part of the channel has an average radius of only 1.4 Å, it is reasonable to question how open it really is. Although the GLIC template is significantly more open than the ELIC, it may be partly desensitized. To test this, we mimicked the natural concentration gradient (which is not easy to model in periodic boundary conditions) with a constant electric field of 40 mV/nm over the entire length of the simulation cell along the z axis (15.8 nm) in a 100 ns test simulation. This yielded a transmembrane potential of 630 mV (roughly 5 times higher than in vivo). Fig. S3 B shows the z position of three chlorides leaving or entering the vestibule part of GlyRα1. Of the four ions that were initially present in the vestibule, two left by crossing the channel. At 68 ns, a first Cl− crossed the L9′ barrier, and 1.5 ns later it crossed the P-1′ barrier toward the intracellular side. At 83 ns, a second Cl− crossed the L9′ barrier, and 1.5 ns later it crossed the P-1′ barrier. After the second ion left, a third ion replaced it.
As shown in Fig. S3 B, the pore radius shows a slight increase after 25 ns in the L9′ part, from 1.5 Å to 2–2.5 Å radius. This is due to a clockwise tilt of three out of five L9′s, which tilt toward the side of the pore channel (Fig. S3 C). There is no quaternary structure reorganization, because the RMSD stays at ∼2.0 Å for the TMD and ∼1.8 Å for TM2. As shown on Fig. S4, the tilting also causes the pore to be continuously filled with water. This appears to support the suggestion that the model built on GLIC has a quaternary structure arrangement that is mostly compatible with an open state, but also that GLIC could be slightly desensitized.
Ethanol simulation
To examine the binding and effects of ethanol on GlyRα1, we introduced 1 mol % of ethanol in the bulk water phase 8 Å away from the protein and the membrane. The ethanol distribution throughout the system required ∼100 ns to stabilize. After this time, a bit less than half of the ethanol molecules partitioned into the bulk water, whereas the other half was distributed equally within the membrane and protein.
Of interest, GlyRα1 with ethanol appeared to stay closer to the initial state than did GlyRα1 with no ethanol. The Cα RMSD (Fig. 2) of the whole protein stabilized at ∼4 Å (5 Å without ethanol) and the TMD Cα RMSD remained at ∼2.6 Å (3.2 Å without ethanol). The RMSF profile showed the same overall shape as the RMSF with and without ethanol.
Admittedly, the RMSD can be a relatively noisy and uncertain measure for a protein of this size; therefore, to better characterize the motion, we calculated the relative rotation between the ECD and TMD, as well as the tilt angle of TM2, and performed an additional six 0.25-μs simulations (three extra with/without ethanol, yielding a total of four samples for each case) to enable us to calculate standard error estimates for the properties in addition to averages. We defined the rotation for each subunit by calculating the vector from the overall center of mass to the subunit center of mass (separately for the TMD and ECD), and then averaging the vector angle in the x/y plane over the five subunits for each frame. We then obtained averages and standard error estimates by considering the multiple simulations. As shown in Fig. 3, the simulations with ethanol appear to stay closer to the initial state model based on GLIC, whereas the nonethanol simulations tend to drift slightly farther away. The data for the single full-microsecond simulation naturally exhibit larger fluctuations, but the pattern for the domain angle appears to be conserved (the average angle with ethanol is 14.4 ± 1° vs. 16.5 ± 1° without (Fig. S5)). For the TM2 angle, fluctuations and helix kinking lead to standard deviations over 3°, which are larger than the difference. However, when we define the closed conformation from ELIC with a tilt angle of 9.2 ± 1.6° (halfway to GLIC), the fraction of closed conformation over 1 μs with and without ethanol is 8.8% and 19%, respectively.
Figure 3.
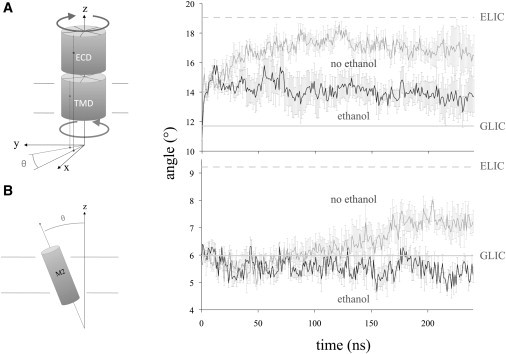
Effects of ethanol on the (A) quaternary arrangement and (B) TM2 tilt, computed as averages and standard error estimates from four shorter simulations, each with (black) and without (gray) ethanol. Horizontal lines indicate estimates for open (solid) and closed (dashed) structures based on the prokaryotic GLIC and ELIC templates. For both properties, the nonethanol systems exhibit more drift, occasionally even being closer to the ELIC, whereas the ethanol ones stay closer to the initial GLIC-based structure.
Consequently, we focused on the channel pore radius as defined by TM2. The average pore radius profile of GlyRα1 without ethanol did not show any significant changes during the simulation. This could be construed as further support for a reasonably high reliability of the initial homology model, but also as a warning sign that the conformation inside the pore may still not be completely open. Of interest, the pore channel seems to be a preferential location for ethanol molecules because they spontaneously diffused there. Just as water did, ethanol molecules also frequently crossed the two pore barriers.
Allosteric binding sites
The pore channel contains an important number of water molecules on the extracellular side and in the small chamber located between the two constrictions. However, the water distribution is not simply cylinder-shaped. On the extracellular side, there are five pockets that are rich in water and connected to the pore channel. Like the pore channel, these pockets show high water density compared with the bulk (Fig. S6 A). These pockets are defined by residues from two different subunits: T264, S267, and R271 on TM2, and A288, M287, and L291 on TM3 from one subunit contribute to one portion of the pocket, and I229, P230, and L233 on TM1 and Q266 on TM2 position themselves accordingly on the other subunit. This residue composition shows a high hydropathy for a TM segment, which is uncommon and often associated with some important function. Moreover, many of the previously cited residues have been identified as being involved in potentiating effects. For example, S267, T264, A288, and M287 have been shown to influence glycine potentiation responses by ethanol on GlyR and GABA, as well as potentiating responses by enflurane on GABAAR (5,30). I229 mutations influence the effect of three different anesthetic compounds on GABA receptor (31). L233 has been identified by photolabeling as the target of an etomidate analog (an anesthetic) on GABAAR (32). R271 has been shown to affect agonist efficacy and potency on GABAAR α2 subunits, but not agonist affinity (33).
For the control simulation, the number of water molecules in this cavity was quite stable, with the average number being higher than in the ethanol simulation (6.99 ± 0.33 vs. 6.0 ± 0.43). On average, 0.57 ± 0.17 ethanol molecules replaced a water molecule in the main observed binding site.
Ethanol bound quickly in the TMD sites during the simulations. These events occurred transiently between 18 and 100 ns in the five potential allosteric binding sites. After 100 ns, the ethanol remained stable in the cavity and the occupancies for the last 200 ns approached 0.8 ± 0.25 molecules per cavity. This appears to correspond well to the binding patterns observed for isoflurane by Brannigan et al. (13) in similar nAChR model simulations, and suggests that anion- and cation-selective Cys-loop receptors may have similar allosteric binding behaviors as well as similarities in their interaction sites.
The ethanol molecules were not always distributed homogeneously in the five cavities (Fig. S6 B). In one of the cavities, we observed up to four or five ethanol molecules for a few nanoseconds, while at the same time two other cavities were mostly empty. The van der Waals volume of these five ethanol molecules in this particular conformation (270 Å3) is compatible with the finding that the cavity can accommodate dodecanol (370 Å3) and even bigger alcohol or anesthetic molecules.
A strong negative correlation exists between the numbers of water and alcohol molecules in the cavity shown in Fig. 4. The correlation between the numbers of alcohol and water molecules in the potential allosteric binding site shows that one molecule of ethanol is replacing ∼1.5 molecules of water. The molecular mass of water and ethanol is 18.015 and 46.067 g/mol, respectively, and their liquid density is 1.00 and 0.789 g/cm3, respectively. This suggests that for single molecules of water and ethanol, their respective volumes in bulk are 30 and 97 Å3. Assuming a constant volume cavity, an ethanol molecule should thus replace 3.2 water molecules. Fig. 4 therefore suggests that ethanol binding in the allosteric binding site involves an increased effective cavity volume. For example, the binding of a single ethanol molecule leads to an increase of the cavity volume with 50 Å3 or ∼10% without any significant changes in the cavity density (0.38 vs. 0.39 g/cm3). An alternative explanation could be constant cavity volume with increased packing density, but the first model has the advantage of being compatible with the pressure reversal effect of anesthetics.
Figure 4.
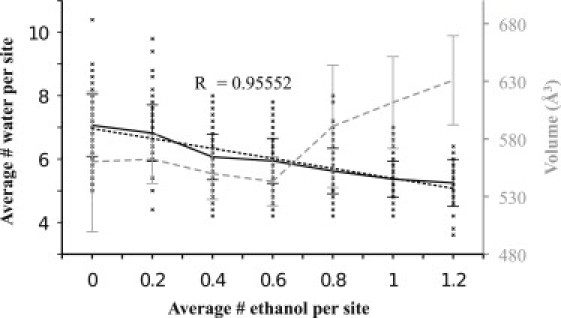
Correlation between the average number of ethanols present per site versus the instantaneous amount of water and volume of the allosteric binding site. Crosses indicate the number of waters (left axis) in a cavity as a function of the number of ethanols in the same site, from 1-ns averages. The solid black line indicates the average for each amount of ethanol, with standard deviations. A linear fit (dotted black) shows that each ethanol replaces ∼1.5 waters. The average van der Waals volume of the cavity (gray dashed curve, right axis) also exhibits a clear increase with the average number of ethanols present in the cavity.
Fig. 5 shows a superposition of the same ethanol molecule during 229 ns in the allosteric binding site in one of the five subunits, which highlights the high stability of the ethanol in that specific cavity. Some fluctuations of the position can be observed, but they are quite limited. A preferential location of the ethanol can be observed, with a hydrogen bond to S267 (dashed lines) and hydrophobic packing with the lower residues of the cavity (A288, M287, and L291). This example of ethanol placement in the allosteric binding site could potentially provide numerous insights into the effects of mutations on the potentiation of glycine receptors and, more generally, of Cys-loop receptors.
Figure 5.
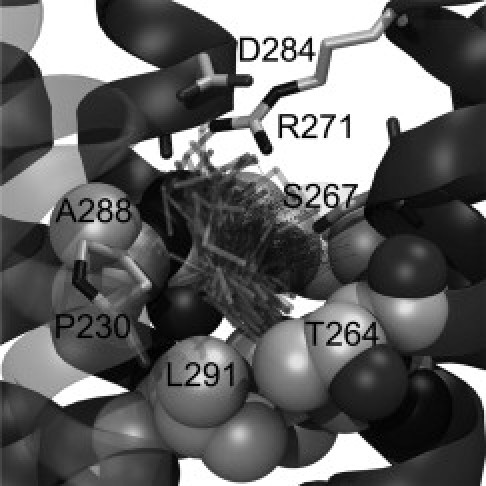
Binding site. Conformations of a single ethanol molecule over 229 ns are superimposed on the structure (from 176 to 405 ns) as semitransparent sticks. Dashed thin lines show hydrogen bonds between this ethanol and S267.
To verify that the enrichment effect of the potential allosteric binding site is not an artifact, in Fig. 6 we compare the ethanol binding properties in three other sites juxtaposed to the allosteric binding site (site 1): one site inside the subunit of the TMD (site 2), one next to the pore channel (site 3), and the last one between the membrane and the first site (site 4). As shown in Fig. 6 B, the allosteric site is clearly the preferential location for ethanol (0.8 ± 0.25 ethanol molecule per cavity) in GlyR, and fitting the occupancy autocorrelation (Fig. 6 C) to an exponential decay indicates a time constant of ∼200 ns for the exchange of bound/unbound ethanol in this site. The surface (orange) and pore (red) cavities have lower occupancy (∼0.2 per site) but also a much faster exchange—the rapid initial drop in the autocorrelation indicates an average residence time well under 10 ns in these sites. A closer study reveals that these two sites appear to be intermediate sites where the ethanol resides temporarily before/after occupying the deeper main sites. Of interest, some occupancy is also observed in the intrasubunit binding site (site 2) after 500 ns. Although this number is significantly lower than that found for the intersubunit site, the exchange shows a similar slow pattern in the 200-ns range. However, due to the low accessibility of the intrasubunit cavity, only two molecules bind there for >10 ns, which makes the data noisier than those obtained from the intersubunit site.
Figure 6.
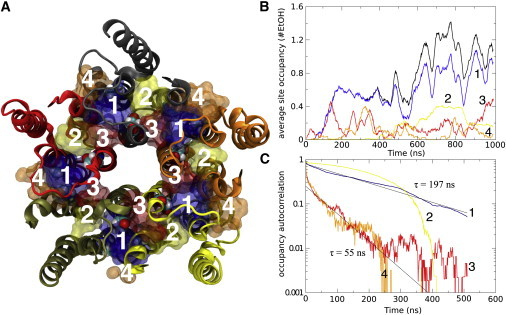
Ethanol binding and exchange. (A) Representation of GlyRα1 TMD showing the potential allosteric intersubunit binding site (site 1), an intrasubunit site (site 2), a pore-accessible site (site 3), and a surface/membrane-facing site (site 4). (B) Average occupancy of ethanol molecules per single binding site over the simulation, colored according to the site. The black line shows the sum of all deep inter- and intrasubunit sites (occupancy clearly is highest in the intersubunit site). (C) Autocorrelation occupancy/nonoccupancy of ethanol molecules that exhibit occupancy at some point in the simulation, colored according to the site. An exponential fit indicates exchange times of ∼200 ns for the deep binding sites. The average exchange time for the surface sites is <10 ns, but there is also a small component (<20%) with an ∼55 ns exchange time for these sites.
Discussion
Despite the low sequence identity between GLIC and GlyR (24%), the homology model of GlyRα1 based on GLIC shows quite stable properties when inserted into a DOPC membrane, especially when compared with previous models (including ours) that were based on the nAChR structure. The overall stability of the model presented here, in terms of drift (2.5 Å of RMSD on the TMD over 1 μs), pore radius, and secondary structure, supports GLIC as a good template for anionic receptors (GlyR and GABAAR) and probably more generally for Cys-loop receptors.
Ethanol follows two different paths of entry into the allosteric binding site in the simulations. One major pathway is via the pore channel, and another, alternative pathway is via the membrane (seen only for two ethanol molecules; Fig. S7). These two portals could explain the great variability in terms of hydropathy for the different modulating ligands of GlyR. The pore-facing entrance could play a role in providing access for the hydrophilic molecules, and the membrane-facing access point could allow the entrance of highly hydrophobic molecules such as long-chain alcohols (e.g., dodecanol). This reasoning might also explain the involvement of I229 and A288, since these residues are at the interface between the binding site and the membrane (Fig. S6 and Fig. S7). They could act as an entrance gate from the membrane side. It is also surprising to notice a highly stable conformation of DOPC lipids next to these residues. The average lipid density over the whole trajectory shows some of the highest densities adjacent to these residues (Fig. S6). Little information is available concerning the effect of lipid on GlyR. However, cholesterol has been shown to modulate GlyR activity (34), and both cholesterol and anionic lipids have been shown to be strictly necessary at least for nAChR activity (35). It has been proposed that the action of anesthetic molecules could be exerted via the alteration of lipid membrane properties, and such an effect of cholesterol on Cys-loop receptor activity supports this hypothesis. Other docking and MD simulations have even suggested that cholesterol inserts into the protein itself (9). Our results show that the main binding site in GlyR, at least for these small molecules, is a water-filled cavity that it is preferentially enriched in ethanol compared with other binding sites. In this site, the binding exchange occurs on timescales of ∼200 ns, primarily with ethanol in the pore channel. It is interesting that the ligand binding appears to have a direct effect on the dynamics and motion of the receptor; however, it is much more difficult to determine the extent to which this is coupled to the actual gating dynamics.
In the simulations, the average volume of the cavity is 568 Å3 with ethanol. Such a volume would almost accommodate the size of a cholesterol molecule (∼610 Å3), but with high packing density in the cavity (1.13 g/cm3). Hence, the location and exact effect of the membrane and cholesterol on the Cys-loop receptors are still poorly understood.
The alcohol potentiating effect is known to increase with the size of the carbon tail until a cutoff is reached (36), and this cutoff seems to appear with a tail of 8–10 carbons. The volume of decanol is 317 Å3, which is consistent with the volume of the allosteric site (531/568 Å3 for simulations without/with ethanol) and would result in a cavity density of 0.54 g/cm3, close to that of the ethanol simulation (∼0.4 g/cm3). This could explain the cutoff effect by a volume limitation for larger alcohol molecules or an entropic penalty. The TMD undergoes conformational changes between the different states of the GlyR. It has been shown that S267 has faster accessibility during the open state, and larger molecules can access this cavity in the open form (37). Furthermore, in one study (5), the residue volume at position S267 showed an inverse correlation for enhancement of glycine receptor function.
The volume of this cavity appears to be crucial for stabilization of the open form of the channel. Our results show that the binding of one ethanol molecule increases the volume of the cavity by 50 Å3 (560–610 Å3). This result supports the hypothesis that occupancy of the allosteric binding site by anesthetic or alcohol molecules stabilizes the open form by increasing the cavity volumes (38), and that this occupancy can help prevent the transition from the open to the closed state. There is experimental evidence for functional effects of ethanol in modulating the nAChR as well (39), but the various receptors have different properties, and the same molecule binding in corresponding sites can easily cause different effects depending on such factors as adjacent amino acids. In addition, it is still very much an open question whether different-sized molecules can bind in different locations in some receptors.
Conclusion
Some caution is still advisable for all studies based on homology models, but we believe the stability of our model supports the validity of using GLIC as a template for GlyR. It is highly interesting that the resulting geometry of GlyR appears to make both inter- and intrasubunit sites accessible to small ligands such as ethanol. Although both population and exchange of bound ethanol are seen for both of them, it is also quite clear that our model strongly favors preferential binding in the site between the subunits in the TMD for this molecule. The additional shallow binding sites in the pore and surface are also populated, but only for shorter times when the ligand is typically on the way to or from the deep sites. The pore pathway appears to be completely dominant over the possibility of access directly through the membrane. Consistent with the potentiating effect of ethanol, the ligands actually appear to stabilize the structure of the GlyRα1 model and keep it closer to the geometry of the (presumably) mostly open GLIC, whereas nonethanol simulations exhibit larger drift. This could potentially be caused by the swelling of the binding site, which would make it difficult to close the channel by moving the subunits together, but on the microsecond timescales observed, it is not yet possible to distinguish any statistically certain changes, e.g., in protein hydrogen-bonding patterns. The fact that subunit-specific modulation has been observed for cannabinoids (40) indicates that the effect can be quite complex. This issue will have to be addressed in studies on larger sets of different ligands and receptors before we can fully understand the process.
Acknowledgments
This work was supported by grants from the European Research Council (209825), the Swedish Foundation for Strategic Research, and the Swedish Research Council to E.L., and the National Institutes of Health (RO1-AA013378 to J.R.T. and E.B.). Supercomputing resources were provided by the Swedish National Infrastructure for Computing.
Supporting Material
References
- 1.Brejc K., van Dijk W.J., Sixma T.K. Crystal structure of an ACh-binding protein reveals the ligand-binding domain of nicotinic receptors. Nature. 2001;411:269–276. doi: 10.1038/35077011. [DOI] [PubMed] [Google Scholar]
- 2.Unwin N. Refined structure of the nicotinic acetylcholine receptor at 4A resolution. J. Mol. Biol. 2005;346:967–989. doi: 10.1016/j.jmb.2004.12.031. [DOI] [PubMed] [Google Scholar]
- 3.Hilf R.J., Dutzler R. A prokaryotic perspective on pentameric ligand-gated ion channel structure. Curr. Opin. Struct. Biol. 2009;19:418–424. doi: 10.1016/j.sbi.2009.07.006. [DOI] [PubMed] [Google Scholar]
- 4.Celentano J.J., Gibbs T.T., Farb D.H. Ethanol potentiates GABA- and glycine-induced chloride currents in chick spinal cord neurons. Brain Res. 1988;455:377–380. doi: 10.1016/0006-8993(88)90098-4. [DOI] [PubMed] [Google Scholar]
- 5.Ye Q., Koltchine V.V., Harris R.A. Enhancement of glycine receptor function by ethanol is inversely correlated with molecular volume at position α267. J. Biol. Chem. 1998;273:3314–3319. doi: 10.1074/jbc.273.6.3314. [DOI] [PubMed] [Google Scholar]
- 6.Hilf R.J.C., Dutzler R. X-ray structure of a prokaryotic pentameric ligand-gated ion channel. Nature. 2008;452:375–379. doi: 10.1038/nature06717. [DOI] [PubMed] [Google Scholar]
- 7.Bocquet N., Nury H., Corringer P.J. X-ray structure of a pentameric ligand-gated ion channel in an apparently open conformation. Nature. 2009;457:111–114. doi: 10.1038/nature07462. [DOI] [PubMed] [Google Scholar]
- 8.Hilf R.J.C., Dutzler R. Structure of a potentially open state of a proton-activated pentameric ligand-gated ion channel. Nature. 2009;457:115–118. doi: 10.1038/nature07461. [DOI] [PubMed] [Google Scholar]
- 9.Brannigan G., Hénin J., Klein M.L. Embedded cholesterol in the nicotinic acetylcholine receptor. Proc. Natl. Acad. Sci. USA. 2008;105:14418–14423. doi: 10.1073/pnas.0803029105. [DOI] [PMC free article] [PubMed] [Google Scholar]
- 10.Cheng M.H., Coalson R.D., Cascio M. Molecular dynamics simulations of ethanol binding to the transmembrane domain of the glycine receptor: implications for the channel potentiation mechanism. Proteins. 2008;71:972–981. doi: 10.1002/prot.21784. [DOI] [PubMed] [Google Scholar]
- 11.Bjelkmar P., Niemelä P.S., Lindahl E. Conformational changes and slow dynamics through microsecond polarized atomistic molecular simulation of an integral Kv1.2 ion channel. PLOS Comput. Biol. 2009;5:e1000289. doi: 10.1371/journal.pcbi.1000289. [DOI] [PMC free article] [PubMed] [Google Scholar]
- 12.Nury H., Poitevin F., Baaden M. One-microsecond molecular dynamics simulation of channel gating in a nicotinic receptor homologue. Proc. Natl. Acad. Sci. USA. 2010;107:6275–6280. doi: 10.1073/pnas.1001832107. [DOI] [PMC free article] [PubMed] [Google Scholar]
- 13.Brannigan G., LeBard D.N., Klein M.L. Multiple binding sites for the general anesthetic isoflurane identified in the nicotinic acetylcholine receptor transmembrane domain. Proc. Natl. Acad. Sci. USA. 2010;107:14122–14127. doi: 10.1073/pnas.1008534107. [DOI] [PMC free article] [PubMed] [Google Scholar]
- 14.Cascio M., Schoppa N.E., Fox R.O. Functional expression and purification of a homomeric human α1 glycine receptor in baculovirus-infected insect cells. J. Biol. Chem. 1993;268:22135–22142. [PubMed] [Google Scholar]
- 15.Söding J. Protein homology detection by HMM-HMM comparison. Bioinformatics. 2005;21:951–960. doi: 10.1093/bioinformatics/bti125. [DOI] [PubMed] [Google Scholar]
- 16.Sali A., Blundell T.L. Comparative protein modelling by satisfaction of spatial restraints. J. Mol. Biol. 1993;234:779–815. doi: 10.1006/jmbi.1993.1626. [DOI] [PubMed] [Google Scholar]
- 17.Canutescu A.A., Shelenkov A.A., Dunbrack R.L., Jr. A graph-theory algorithm for rapid protein side-chain prediction. Protein Sci. 2003;12:2001–2014. doi: 10.1110/ps.03154503. [DOI] [PMC free article] [PubMed] [Google Scholar]
- 18.Van Der Spoel D., Lindahl E., Berendsen H.J. GROMACS: fast, flexible, and free. J. Comput. Chem. 2005;26:1701–1718. doi: 10.1002/jcc.20291. [DOI] [PubMed] [Google Scholar]
- 19.Duan Y., Wu C., Kollman P. A point-charge force field for molecular mechanics simulations of proteins based on condensed-phase quantum mechanical calculations. J. Comput. Chem. 2003;24:1999–2012. doi: 10.1002/jcc.10349. [DOI] [PubMed] [Google Scholar]
- 20.Jorgensen W., Chandrasekhar J., Klein M. Comparison of simple potential functions for simulating liquid water. J. Chem. Phys. 1983;79:926–935. [Google Scholar]
- 21.Berger O., Edholm O., Jähnig F. Molecular dynamics simulations of a fluid bilayer of dipalmitoylphosphatidylcholine at full hydration, constant pressure, and constant temperature. Biophys. J. 1997;72:2002–2013. doi: 10.1016/S0006-3495(97)78845-3. [DOI] [PMC free article] [PubMed] [Google Scholar]
- 22.Friesner R.A., Banks J.L., Shenkin P.S. Glide: a new approach for rapid, accurate docking and scoring. 1. Method and assessment of docking accuracy. J. Med. Chem. 2004;47:1739–1749. doi: 10.1021/jm0306430. [DOI] [PubMed] [Google Scholar]
- 23.Grudzinska J., Schumann T., Laube B. Mutations within the agonist-binding site convert the homomeric α1 glycine receptor into a Zn2+-activated chloride channel. Channels (Austin) 2008;2:13–18. doi: 10.4161/chan.2.1.5931. [DOI] [PubMed] [Google Scholar]
- 24.Schumann T., Grudzinska J., Laube B. Binding-site mutations in the α1 subunit of the inhibitory glycine receptor convert the inhibitory metal ion Cu2+ into a positive modulator. Neuropharmacology. 2009;56:310–317. doi: 10.1016/j.neuropharm.2008.08.024. [DOI] [PubMed] [Google Scholar]
- 25.Smart O.S., Neduvelil J.G., Sansom M.S. HOLE: a program for the analysis of the pore dimensions of ion channel structural models. J. Mol. Graph. 1996;14:354–360. doi: 10.1016/s0263-7855(97)00009-x. 376. [DOI] [PubMed] [Google Scholar]
- 26.Humphrey W., Dalke A., Schulten K. VMD: visual molecular dynamics. J. Mol. Graphics. 1996;14:33–38. doi: 10.1016/0263-7855(96)00018-5. [DOI] [PubMed] [Google Scholar]
- 27.Kleywegt G.J., Jones T.A. Detection, delineation, measurement and display of cavities in macromolecular structures. Acta Crystallogr. D Biol. Crystallogr. 1994;50:178–185. doi: 10.1107/S0907444993011333. [DOI] [PubMed] [Google Scholar]
- 28.Bertrand D., Galzi J.L., Changeux J.P. Stratification of the channel domain in neurotransmitter receptors. Curr. Opin. Cell Biol. 1993;5:688–693. doi: 10.1016/0955-0674(93)90141-c. [DOI] [PubMed] [Google Scholar]
- 29.Lee D.J., Keramidas A., Barry P.H. The contribution of proline 250 (s2′) to pore diameter and ion selectivity in the human glycine receptor channel. Neurosci. Lett. 2003;351:196–200. doi: 10.1016/j.neulet.2003.08.005. [DOI] [PubMed] [Google Scholar]
- 30.Mihic S.J., Ye Q., Harrison N.L. Sites of alcohol and volatile anaesthetic action on GABA(A) and glycine receptors. Nature. 1997;389:385–389. doi: 10.1038/38738. [DOI] [PubMed] [Google Scholar]
- 31.Jenkins A., Greenblatt E.P., Harrison N.L. Evidence for a common binding cavity for three general anesthetics within the GABAA receptor. J. Neurosci. 2001;21:RC136. doi: 10.1523/JNEUROSCI.21-06-j0002.2001. [DOI] [PMC free article] [PubMed] [Google Scholar]
- 32.Li G.-D., Chiara D.C., Cohen J.B. Identification of a GABAA receptor anesthetic binding site at subunit interfaces by photolabeling with an etomidate analog. J. Neurosci. 2006;26:11599–11605. doi: 10.1523/JNEUROSCI.3467-06.2006. [DOI] [PMC free article] [PubMed] [Google Scholar]
- 33.O'Shea S.M., Harrison N.L. Arg-274 and Leu-277 of the γ-aminobutyric acid type A receptor α 2 subunit define agonist efficacy and potency. J. Biol. Chem. 2000;275:22764–22768. doi: 10.1074/jbc.M001299200. [DOI] [PubMed] [Google Scholar]
- 34.Laube B. Membrane cholesterol affects the pharmacology of the recombinant inhibitory glycine receptor. Proc. Soc. Neurosci., 33rd, New Orleans. 2003;2:797.710. [Google Scholar]
- 35.Dalziel A.W., Rollins E.S., McNamee M.G. The effect of cholesterol on agonist-induced flux in reconstituted acetylcholine receptor vesicles. FEBS Lett. 1980;122:193–196. doi: 10.1016/0014-5793(80)80435-2. [DOI] [PubMed] [Google Scholar]
- 36.Mascia M.P., Trudell J.R., Harris R.A. Specific binding sites for alcohols and anesthetics on ligand-gated ion channels. Proc. Natl. Acad. Sci. USA. 2000;97:9305–9310. doi: 10.1073/pnas.160128797. [DOI] [PMC free article] [PubMed] [Google Scholar]
- 37.Lobo I.A., Mascia M.P., Harris R.A. Channel gating of the glycine receptor changes accessibility to residues implicated in receptor potentiation by alcohols and anesthetics. J. Biol. Chem. 2004;279:33919–33927. doi: 10.1074/jbc.M313941200. [DOI] [PubMed] [Google Scholar]
- 38.Cascio M. Modulating inhibitory ligand-gated ion channels. AAPS J. 2006;8:E353–E361. doi: 10.1007/BF02854906. [DOI] [PMC free article] [PubMed] [Google Scholar]
- 39.Zuo Y., Nagata K., Narahashi T. Single-channel analyses of ethanol modulation of neuronal nicotinic acetylcholine receptors. Alcohol. Clin. Exp. Res. 2004;28:688–696. doi: 10.1097/01.alc.0000125349.99823.8a. [DOI] [PubMed] [Google Scholar]
- 40.Yang Z., Aubrey K.R., Lynch J.W. Subunit-specific modulation of glycine receptors by cannabinoids and N-arachidonyl-glycine. Biochem. Pharmacol. 2008;76:1014–1023. doi: 10.1016/j.bcp.2008.07.037. [DOI] [PubMed] [Google Scholar]
Associated Data
This section collects any data citations, data availability statements, or supplementary materials included in this article.