

Abstract
Little is known about the structure and function of most nucleoid-associated proteins (NAPs) in bacteria. One reason for this is that the distribution and structure of the proteins is obfuscated by the diffraction limit in standard wide-field and confocal fluorescence imaging. In particular, the distribution of HU, which is the most abundant NAP, has received little attention. In this study, we investigate the distribution of HU in Caulobacter crescentus using a combination of super-resolution fluorescence imaging and spatial point statistics. By simply increasing the laser power, single molecules of the fluorescent protein fusion HU2-eYFP can be made to blink on and off to achieve super-resolution imaging with a single excitation source. Through quantification by Ripley's K-test and comparison with Monte Carlo simulations, we find the protein is slightly clustered within a mostly uniform distribution throughout the swarmer and stalked stages of the cell cycle but more highly clustered in predivisional cells. The methods presented in this letter should be of broad applicability in the future study of prokaryotic NAPs.
HU is the most abundant and possibly most important nucleoid-associated protein (NAP) in determining prokaryotic chromosome structure (1,2). Like most NAPs, little is currently known about the both the function and distribution of HU in bacterial cells. HU is typically a 20-kDa heterodimer structure consisting of HU1 and HU2 in Caulobacter crescentus and HUα and HUβ in Escherichia coli, although homodimers are known to form in both species. HU nonspecifically binds both double-stranded and single-stranded DNA. Various studies have addressed the numerous roles of HU in chromosomal partitioning (3) and in the coordination of transcription by HU in E. coli (4).
It was shown with epifluorescence that DAPI and HU colocalize in the E. coli chromosome (5). In addition, transmission electron microscopy was used to study the distribution of gold-colloid-labeled HU in E. coli, and it was found that HU preferentially associates with ribosomal sections of the chromosome (6). Despite these studies, the molecular distribution of HU in bacterial cells remains poorly understood, and compared with E. coli, even less is known about the role of HU in dictating chromosomal structure in C. crescentus, which is an important model organism for the study of asymmetric cell division via protein localization (7). One of the reasons that the cell biology of the NAPs is inadequately understood is that the physical size of bacterial cells is approximately that of the diffraction limit for visible light (∼250 nm), rendering quantitative imaging of bacterial protein distributions in standard confocal or wide-field optical microscopy nearly impossible (8,9). By imaging and localizing fluorescently-tagged HU molecules to 11-nm precision one at a time, we can circumvent the diffraction limit and obtain super-resolution (SR) images of the HU locations (10–12).
SR imaging of HU2-eYFP was achieved by exploiting the intrinsic photophysical properties of the fluorescent protein, namely the photoinduced blinking of single eYFP from dark to fluorescent states through the use of high laser irradiance (13). eYFP has been reported to display a complicated array of photophysical phenomena including blinking and photoswitching (9,14). The imaging was performed on an inverted model No. IX71 microscope (Olympus, Melville, NY) with the 514-nm line of an Ar+ laser (9) as a single excitation source. By driving the majority of molecules into transient dark states with high-intensity pumping (4–6 kW/cm2), it was possible to image in each frame a low concentration of single eYFP which were separated by more than the diffraction limit (∼250 nm). Fig. 1 A shows subsequent 10-ms frames from a typical raw data set. A careful balance of exposure time and irradiance is needed to ensure that molecules are separated by more than the diffraction limit. The majority of molecules were fluorescent for a single imaging frame (97%). To arrest the motion of individual HU2-eYFP molecules (15), the cells were fixed using 4% formaldehyde (see the Supporting Material).
Figure 1.
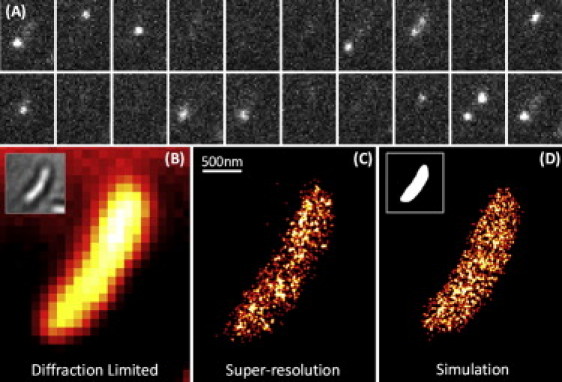
(Color) SR imaging of HU2-eYFP in fixed C. crescentus. (A) Frames of raw data (10 ms each) showing the blinking of eYFP achieved through the use of a single 514 nm laser. (B) A diffraction-limited (DL) image of HU2-eYFP with a white light transmission image in the inset. (C) SR image of HU2-eYFP. (D) Monte Carlo simulated image of a random distribution of molecules inside a model cell volume (inset).
There are three morphologically distinct cell types in the C. crescentus cell cycle: flagellated swarmer cell, stationary stalked cell, and predivisional cell. Predivisional cells go on to divide asymmetrically to yield daughter swarmer and stalked cells. Fig. 1 B shows a diffraction-limited (DL) image of HU2-eYFP in a swarmer cell. The fluorescence intensity is mostly uniform throughout most of the cell. Fig. 1 C shows the same data with SR acquired from 1455 localizations over 45 s. Each localized molecule is plotted as Gaussian with fixed amplitude and standard deviation of 10.7 nm, defined by the mean statistical localization precision in these experiments (16). Fig. 1 D shows a two-dimensional projection of a three-dimensional Monte Carlo simulation of completely spatially random (CSR) points within a simulated cell. For each cell, the simulation was performed by generating a three-dimensional volume derived from a two-dimensional binary mask of the DL fluorescence image (inset, Fig. 1 D) where the number of points sampled from this space was set equal to the actual number of localizations achieved for each individual cell. The result was then projected back to two dimensions for comparison (see the Supporting Material).
In SR imaging, each point in the reconstruction is the location of an individual molecule. Even though we did not resolve a structure in Fig. 1 C, we can use the subdiffraction localizations in the image to quantify the distribution of molecules through methods derived from spatial-point-statistics. In this article, we have used a modified form of Ripley's K-test (17,18). The K function is calculated by counting the mean number of points encountered from a single point to a circular area of radius r for all points in the field of view. For two-dimensional CSR, the K function is quadratic in r. Because visualization of quadratic functions is not as intuitive to a viewer as deviations from a straight line, the K function is often recast into what is referred to as the L function, which in two dimensions is calculated as
For the case of CSR, L(r)-r is a horizontal line located at zero; full details of the calculation of L are provided in the Supporting Material. One of the main reasons the K-test family of functions is widely used is because of their ease of interpretation; values of L(r)-r that are below the random simulated case indicate that the data is regular, or periodic. Values of L(r)-r above the simulated case indicate clustering.
For our case here, the simulated functions are not completely flat (ostensibly “random”) for two reasons:
-
1.
The data is a two-dimensional projection of a three-dimensional distribution, and
-
2.
Edge-effects on the scale of 0–200 nm can be important because the width of the whole cell is only 500–800 nm.
Molecules near the edge have fewer neighbors than molecules in the center, which is manifested in an “apparent” clustering as the aspect ratio increases. This reiterates the importance of the three-dimensional simulation data as a fairer test of CSR.
Fig. 2, A and B, shows representative data obtained from swarmer and stalked cells which have an approximately uniform distribution of HU2-eYFP. For the L(r)-r plots in Fig. 2, the blue line is the calculated L function from the data, the middle red line is the mean of 100 CSR simulations, and the red lines above and below the middle line are 95% confidence intervals determined from the simulation. All stalked and swarmer cells observed were slightly clustered. The amount of deviation from the simulation indicates the degree of clustering. The slight clustering is possibly due to the previously published result that HU is more often found in areas of the chromosome associated with ribosomes and metabolic activity (6).
Figure 2.
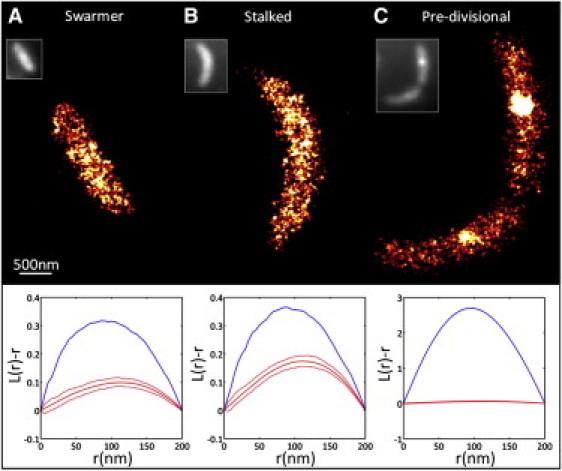
(Color) Representative SR imaging of HU2-eYFP at different stages in the C. crescentus cell cycle. (A) SR image of a swarmer cell with corresponding L-test plots and DL epifluorescence image (inset). The blue line (upper) corresponds to the data and the red lines (center) to the CSR simulation (with upper and lower red lines corresponding to the 95% confidence intervals). (B) Same as panel A but for a stalked cell. In both swarmer and stalked, the distribution of HU2-eYFP is only slightly clustered compared to CSR. (C) Significant clustering of HU2-eYFP in predivisional cells can be observed both in the SR image and in the large deviation between the L function for the data compared to the simulation.
From the plots, it can be seen that the maximum deviation occurs at ∼80 nm, and the line is above the 95% confidence interval for the simulation, indicating statistically significant clustering. The radius of maximum deviation can be used to assess the length scale of the clusters (19), although because these data are not a distribution in an infinite plane, it is difficult to extract precise cluster sizes from the L(r)–r plots. Because these tests have not been widely applied to SR data, several computational and experimental controls were performed to ensure that the slight clustering is real and not due to imperfect modeling or artifacts in the data. For example, we have found that the statistical localization precision of the measurement did not have a major effect on the L(r)-r plots. In addition, when using eYFP as a fluorophore, there is the possibility that not every tagged molecule will be observed (undersampling) or that one molecule will be counted more than once (oversampling). Neither of these effects can explain the observed clustering (see the Supporting Material). As a control, imaging a bacterial strain that contained only cytoplasmic diffusing eYFP yielded L(r)-r data in complete agreement with the CSR simulations (see the Supporting Material).
In predivisional cells, clusters were often observed near the midpoint of each nascent daughter cell (e.g., Fig. 2 C). We scored a cell as predivisional through the appearance of an invagination in the transmission images. The clusters were fit to a Gaussian function to extract an average FWHM size of 150 ± 40 nm. In 48% of predivisional cells, the cluster was observed in only one of the two daughter cells. The L(r)-r functions in Fig. 2 C for each cell (blue line) show dramatic deviation from simulation (red line), indicating a high degree of clustering. Of particular note is the fact that the cluster in the lower part of the cell is far more visible in the SR point sampling image as compared to the conventional diffraction-limited image in the inset, and this high contrast illustrates a key advantage of the method.
In addition to the clusters, uniformly and randomly distributed HU2-eYFP was observed in the areas of the cell surrounding the cluster. The observed clusters are not artifacts due to fixation because clusters were also observed in live cells (see the Supporting Material). Due to the high affinity of HU binding to DNA (2–200 nM), it has been previously suggested that HU be used as a marker of the bacterial chromosome (5). Thus, the data in Fig. 2 C may indicate that the chromosome is clustered around the midpoint of the cell during division. In vitro, it was shown that HU and related mutants can affect the shape of nucleoids (2). Comparing Fig. 2 C to its inset, it is clear that the ability of SR imaging combined with spatial point statistics to quantify molecular distributions (with high sensitivity and contrast) should be useful in the future study of bacterial protein localization patterns.
Acknowledgments
This work was supported in part by the National Institute of General Medical Sciences grant No. R01GM086196. M.A.T. acknowledges support from a National Science Foundation Graduate Research Fellowship and a Bert and DeeDee McMurtry Stanford Graduate Fellowship. M.A.S. acknowledges support from National Institutes of Health grant No. F32GM080147.
Supporting Material
References and Footnotes
- 1.Dillon S.C., Dorman C.J. Bacterial nucleoid-associated proteins, nucleoid structure and gene expression. Nat. Rev. Microbiol. 2010;8:185–195. doi: 10.1038/nrmicro2261. [DOI] [PubMed] [Google Scholar]
- 2.Sarkar T., Vitoc I., Hud N.V. Bacterial protein HU dictates the morphology of DNA condensates produced by crowding agents and polyamines. Nucleic Acids Res. 2007;35:951–961. doi: 10.1093/nar/gkl1093. [DOI] [PMC free article] [PubMed] [Google Scholar]
- 3.Jaffe A., Vinella D., D'Ari R. The Escherichia coli histone-like protein HU affects DNA initiation, chromosome partitioning via MukB, and cell division via MinCDE. J. Bacteriol. 1997;179:3494–3499. doi: 10.1128/jb.179.11.3494-3499.1997. [DOI] [PMC free article] [PubMed] [Google Scholar]
- 4.Berger M., Farcas A., Muskhelishvili G. Coordination of genomic structure and transcription by the main bacterial nucleoid-associated protein HU. EMBO Rep. 2010;11:59–64. doi: 10.1038/embor.2009.232. [DOI] [PMC free article] [PubMed] [Google Scholar]
- 5.Wery M., Woldringh C.L., Rouviere-Yaniv J. HU-GFP and DAPI co-localize on the Escherichia coli nucleoid. Biochimie. 2001;83:193–200. doi: 10.1016/s0300-9084(01)01254-8. [DOI] [PubMed] [Google Scholar]
- 6.Dürrenberger M., Bjornsti M.A., Kellenberger E. Intracellular location of the histonelike protein HU in Escherichia coli. J. Bacteriol. 1988;170:4757–4768. doi: 10.1128/jb.170.10.4757-4768.1988. [DOI] [PMC free article] [PubMed] [Google Scholar]
- 7.Shapiro L., McAdams H.H., Losick R. Why and how bacteria localize proteins. Science. 2009;326:1225–1228. doi: 10.1126/science.1175685. [DOI] [PMC free article] [PubMed] [Google Scholar]
- 8.Greenfield D., McEvoy A.L., Liphardt J. Self-organization of the Escherichia coli chemotaxis network imaged with super-resolution light microscopy. PLoS Biol. 2009;7:e1000137. doi: 10.1371/journal.pbio.1000137. [DOI] [PMC free article] [PubMed] [Google Scholar]
- 9.Biteen J.S., Thompson M.A., Moerner W.E. Super-resolution imaging in live Caulobacter crescentus cells using photoswitchable EYFP. Nat. Methods. 2008;5:947–949. doi: 10.1038/NMETH.1258. [DOI] [PMC free article] [PubMed] [Google Scholar]
- 10.Betzig E., Patterson G.H., Hess H.F. Imaging intracellular fluorescent proteins at nanometer resolution. Science. 2006;313:1642–1645. doi: 10.1126/science.1127344. [DOI] [PubMed] [Google Scholar]
- 11.Hess S.T., Girirajan T.P.K., Mason M.D. Ultra-high resolution imaging by fluorescence photoactivation localization microscopy. Biophys. J. 2006;91:4258–4272. doi: 10.1529/biophysj.106.091116. [DOI] [PMC free article] [PubMed] [Google Scholar]
- 12.Rust M.J., Bates M., Zhuang X. Sub-diffraction-limit imaging by stochastic optical reconstruction microscopy (STORM) Nat. Methods. 2006;3:793–795. doi: 10.1038/nmeth929. [DOI] [PMC free article] [PubMed] [Google Scholar]
- 13.Fölling J., Bossi M., Hell S.W. Fluorescence nanoscopy by ground-state depletion and single-molecule return. Nat. Methods. 2008;5:943–945. doi: 10.1038/nmeth.1257. [DOI] [PubMed] [Google Scholar]
- 14.Dickson R.M., Cubitt A.B., Moerner W.E. On/off blinking and switching behavior of single green fluorescent protein molecules. Nature. 1997;388:355–358. doi: 10.1038/41048. [DOI] [PubMed] [Google Scholar]
- 15.Wheeler R.T., Shapiro L. Differential localization of two histidine kinases controlling bacterial cell differentiation. Mol. Cell. 1999;4:683–694. doi: 10.1016/s1097-2765(00)80379-2. [DOI] [PubMed] [Google Scholar]
- 16.Thompson R.E., Larson D.R., Webb W.W. Precise nanometer localization analysis for individual fluorescent probes. Biophys. J. 2002;82:2775–2783. doi: 10.1016/S0006-3495(02)75618-X. [DOI] [PMC free article] [PubMed] [Google Scholar]
- 17.Lillemeier B.F., Mörtelmaier M.A., Davis M.M. TCR and Lat are expressed on separate protein islands on T cell membranes and concatenate during activation. Nat. Immunol. 2010;11:90–96. doi: 10.1038/ni.1832. [DOI] [PMC free article] [PubMed] [Google Scholar]
- 18.Hess S.T., Gould T.J., Zimmerberg J. Dynamic clustered distribution of hemagglutinin resolved at 40 nm in living cell membranes discriminates between raft theories. Proc. Natl. Acad. Sci. USA. 2007;104:17370–17375. doi: 10.1073/pnas.0708066104. [DOI] [PMC free article] [PubMed] [Google Scholar]
- 19.Kiskowski M.A., Hancock J.F., Kenworthy A.K. On the use of Ripley's K-function and its derivatives to analyze domain size. Biophys. J. 2009;97:1095–1103. doi: 10.1016/j.bpj.2009.05.039. [DOI] [PMC free article] [PubMed] [Google Scholar]
Associated Data
This section collects any data citations, data availability statements, or supplementary materials included in this article.