

Abstract
Recent evidence suggests that B and T cell interactions may be paramount in relapsing remitting multiple sclerosis (RRMS) disease pathogenesis. We hypothesized that memory B cell pools from RRMS patients may specifically harbor a subset of potent neuro-antigen presenting cells that support neuro-antigen reactive T cell proliferation and cytokine secretion. To test this hypothesis, we compared CD80 and HLA-DR expression, IL-10 and LTα secretion, neuro-antigen binding capacity, and neuro-antigen presentation by memory B cells from RRMS patients to naïve B cells from RRMS patients and to memory and naïve B cells from healthy donors (HD). We identified memory B cells from some RRMS patients that elicited CD4+ T cell proliferation and IFN-γ secretion in response to myelin basic protein (MBP) and myelin oligodendrocyte glycoprotein (MOG). Notwithstanding the fact that the phenotypic parameters that promote efficient antigen presentation were observed to be similar between RRMS and HD memory B cells, a corresponding capability to elicit CD4+ T cell proliferation in response to MBP and MOG was not observed in HD memory B cells. Our results demonstrate for the first time that the memory B cell pool in RRMS harbors neuro-antigen specific B cells that can activate T cells.
Keywords: multiple sclerosis, B cells, autoimmunity, antigen presentation
INTRODUCTION
A role of B cells in the pathogenesis of relapsing remitting multiple sclerosis (RRMS) was recently substantiated, as therapeutic depletion of B cells with Rituximab resulted in reduction in disease activity as measured by gadolinium enhancing lesions on magnetic resonance imaging [1]; diminution of pro-inflammatory cytokine secretion by T cells from MS patients receiving Rituximab therapy [2] and reappearance of B cells in the periphery that correlated with a return in RRMS symptoms [3]. Preventing B cells from entering the central nervous system (CNS) may be an important target of disease modifying therapy, since RRMS patients treated with the selective adhesion molecule inhibitor natalizumab, a monoclonal antibody to very late antigen-4 (VLA-4) present on a variety of leukocytes, show a disproportionate increase in the number of circulating B cells [4].
Although B cells serve varied functions in the immune system including the production of antibodies, lymphoneogenesis, cytokine secretion and antigen presentation [5-7], which of these functions play a central role in the pathogenesis of RRMS remains unclear. For instance, it does not appear likely that antibody secretion is central to RRMS disease activity, given that treatment with Rituximab confers benefit in reducing both clinical and radiographic disease manifestations without concomitant reduction of circulating antibody since CD20, the target of Rituximab, is not present on plasma cells [1]. However, Rituximab treatment of RRMS patients does result in a significant depletion of B cells within the cerebrospinal fluid (CSF) [8] and cerebral perivascular spaces [9]. A marked decrease in T cell frequency in the CSF has also been observed [8], indicating a potential role of B cells in regulating T cells within the CNS. This finding was similarly observed in the mouse model of MS, experimental autoimmune encephalomyelitis (EAE), in which depletion of B cells after EAE induction resulted in a reduction of antigen-specific effector T cells within the CNS [10]. Interestingly, a decline in T cell frequency in the CSF of pediatric opsoclonus-myoclonus patients receiving Rituximab was not observed [11], indicating that T cell regulation by B cells may be a unique feature of MS patients.
At first glance, these results are surprising since the most extensively studied consequence of B-T cell interactions is the induction of T cell tolerance or expansion of regulatory T cells [12-14]. For example in mice, antigen-specific naïve B cells induce naïve T cells to proliferate and differentiate into regulatory T cells, unlike dendritic cells, which induce effector T cell subset development [15]. In addition, hen egg lysozyme (HEL) specific B cells fail to initiate significant T cell proliferation or IL-2 and IFN-γ secretion [16]. Further, on a per cell basis, human B cells are less potent antigen presenting cells (APC) than dendritic cells in vitro [17]. Ultimately, these findings have suggested that B cells are unlikely to play a significant role as APC in the induction of effector T cell responses. Nevertheless, these studies did not characterize APC function in the memory B cell pool. Importantly, other in vitro investigations have demonstrated that human memory B cells are potent APC in the context of both allo-antigen [18] and exogenous foreign antigen [19]. Interestingly, circulating memory B cells are also reduced in RRMS patients during mitoxantrone [20] and IFN-β therapy [21]. The relationship of these reductions to therapeutic efficacy remains unknown.
Our studies have recently focused on the potential impact of memory B cells from RRMS patients that dominate the B cell pool in the CNS of RRMS patients [22, 23], and whether pathogenic mechanisms are mediated through the process of neuro-antigen presentation to effector T cells. Here we demonstrate for the first time that memory B cells from the peripheral blood of some RRMS patients are able to induce significant neuro-antigen specific T cell proliferation and IFN-γ secretion in comparison to peripheral memory B cells from healthy donors. Our findings may be germane to advancing our understanding of the relationship of compartment specific memory B cell responses and the pathobiologic underpinnings of MS.
RESULTS
Naïve and memory B cell subsets from RRMS patients are phenotypically similar to those from HD
Recent studies on an untreated RRMS patient cohort similar to ours found no significant differences in the percentages of circulating naïve and memory B cells between HD and RRMS patients [21]. Nevertheless, we wanted to confirm this phenotype in our cohorts as patients with other autoimmune disorders have a decrease in the total percentage of circulating memory B cells in the peripheral blood (PB) compared to HD [24], supporting the idea that these cells are at the site of inflammation during the course of autoimmune inflammation, and not in circulation. The HD and RRMS patients in our cohort showed similar percentages of memory B cells (4.42±0.56% vs. 4.07±0.56%, p=0.12 Figure 1B) and naïve B cells (13.70±2.01% vs. 9.66±1.20%, p=0.12, Figure 1B) within the PB, similar to what was previously reported [21]. Also, as previously observed [23], naïve B lymphocytes dominate the PB of both HD (13.70±2.01% naïve B cells vs. 4.42±0.56% memory B cells, p<0.001, Figure 1B), and RRMS patients (9.66±1.20% naïve B cells vs. 4.07±0.56% memory B cells, p<0.001, Figure 1B), with average naïve:memory ratios of 3.27±0.37 and 2.68±0.40 in HD and RRMS patients, respectively.
FIGURE 1. Memory B cells from RRMS patients and HD exhibit an activated phenotype but express less HLA-DR.
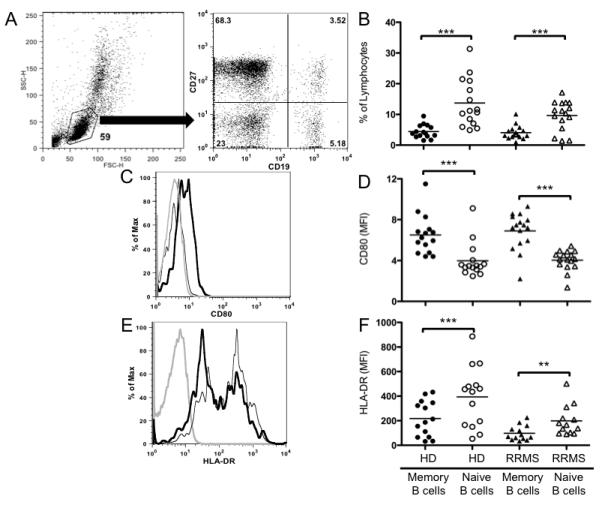
(A) Gating strategy used to determine the percentage of peripheral blood memory (CD19+CD27+) and naïve (CD19+CD27−) B cell subsets from live lymphocytes based on forward scatter and side scatter characteristics from a single HD; percentage within each gate indicated in corners of dot plot. (B) Percentage of naïve and memory B cell subsets in the peripheral blood lymphocyte population of HD and RRMS patient cohorts; individual points represent individual subjects, and black bars represent mean values of each group. Representative histograms of (C) CD80 and (E) HLA-DR expression from one HD; isotype control (grey line), naïve B cells (thin black line) and memory B cells (thick black line). The expression of CD80 (D) and HLA-DR (F) on memory and naïve B cell subsets in the peripheral blood lymphocyte population of HD and RRMS patient cohorts were quantified by mean fluorescence intensity (MFI) of the population; individual points represent individual subjects, and black bars represent mean values of each group. **p<0.01, ***p<0.001 multiple comparisons post-hoc analysis with Bonferroni correction after two-way mixed-model ANOVA.
Costimulatory molecule expression can influence the potency of B cell antigen presentation, and is differentially regulated between naïve and memory B cells in HD [18, 19]. In addition, one study had demonstrated that CD80+ B cells expand in the peripheral blood of MS patients undergoing exacerbation [25]. Therefore, we examined memory and naive B cell subsets for their relative expression of CD80 (B7.1) in our RRMS cohort and compared subset expression to HD using mean fluorescence intensity (MFI) of CD80 expression by flow cytometry. Memory B cells expressed significantly higher levels of CD80 than naïve B cells in both HD (6.51±0.49 vs. 3.99±0.44, p<0.001, Figure 1D) and RRMS patients (6.88±0.45 vs. 4.03±0.25, p<0.001, Figure 1D). CD80 MFI naïve:memory ratios in HD and RRMS patients were similar (0.60±0.02 and 0.59±0.02, respectively).
HLA-DR is a major component of human MHCII and is constitutively expressed on resting B cells and other APC, but is highly upregulated upon activation [26]. Given the increased expression of CD80 on memory B cells in our cohorts, we hypothesized that HLA-DR expression may also be significantly increased on memory B cells as compared to naïve B cells in both HD and RRMS. Instead, we observed that the memory B cell compartment expressed significantly lower levels of HLA-DR compared to the naïve B cell compartment in both HD (217.6±38.7 vs. 394.2±65.4, p<0.001, Figure 1F) and RRMS patients (98.2±16.9 vs. 198.8±33.7 p<0.01, Figure 1F). However, the relative ratio of naïve:memory B cell HLA-DR expression was similar in the two cohorts (2.00±0.10 vs. 2.12±0.14) indicating that even though naïve and memory B cells from the HD cohort in general had higher HLA-DR expression than RRMS, the relative ratio of expression between naïve and memory B cells in both cohorts was similar.
Memory B cells from both HD and RRMS secrete pro-inflammatory Lymphotoxin-alpha
Memory and naïve B cells from HD secrete pro- and anti-inflammatory cytokines, respectively, when polyclonally stimulated in vitro [20], potentially indicating a reciprocal role in modulating T cell responses through antigen presentation during the course of RRMS. LTα is a prototypic inflammatory cytokine critical in the development of some EAE models of MS [27], and IL-10 is a prototypic anti-inflammatory cytokine that inhibits human T cell proliferation [28]. Therefore, we chose to examine LTα secretion as a measure of pro-inflammatory activity and IL-10 secretion as a measure of anti-inflammatory/regulatory activity in both our HD and RRMS patient cohort. Accordingly, CD40L stimulation served as a model of T cell dependent bystander activation, and BCR + CD40L stimulation a model of cognate antigen recognition followed by T cell help.
Memory B cells produced significantly more LTα than naïve B cells when stimulated with CD40L alone in both HD (483±49 pg/mL vs. 125±36 pg/mL, p<0.001, paired t-test, Figure 2A) and RRMS patients (314±72 pg/mL vs. 78±20 pg/mL p<0.01, paired t-test, Figure 2A). There was no significant difference between the HD and RRMS cohorts when we compared LTα production in the memory B cell compartment or the naïve B cell compartment (p=0.05). Similar response patterns were observed with the combination of BCR and CD40L stimulation, such that LTα secretion by memory B cells was greater than LTα secretion by naïve B cells in both HD (455±36 vs. 56±18 pg/mL, p<0.001, paired t-test, Figure 2B) and RRMS patients (325±61 vs. 80±22, p<0.001, paired t-test, Figure 2B). No significant differences in LTα production between memory or naïve B cells from HD or RRMS patients (Figure 2B) were observed (p=0.29). These data suggest that the addition of BCR stimulation at this dose does not induce greater LTα secretion than what is observed with CD40L alone in either the naïve or memory B cell compartment in HD and RRMS patients.
FIGURE 2. Memory and naïve B cells from RRMS patients and HD generate similar opposing cytokine profiles in response to various polyclonal stimuli in vitro.
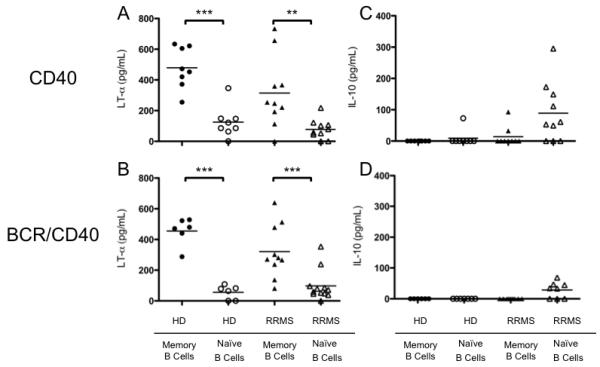
Highly purified, sorted naïve and memory B cell subsets from HD and RRMS patients were stimulated with (A and C) CD40L for 48 hours, or (B and D) dual-staggered stimulation with BCR crosslinking and CD40L for 72 hours. LTα (A, B) and IL-10 (C, D) secretion were measured in cell culture supernatants by ELISA. Individual points represent individual subjects, black bars represent mean values of group. **p<0.01, ***p<0.001; multiple comparisons post-hoc analysis with Bonferroni correction after two-way mixed-model ANOVA. ‡p<0.05 paired t-test.
Although naïve B cells from HD and RRMS patients secreted similar amounts of LTα, naïve B cells from RRMS patients stimulated with CD40L alone produced significantly more IL-10 than naïve B cells from HD stimulated with CD40L alone (89±30 pg/mL vs. 9±9 pg/mL, p<0.01, Figure 2C). In fact, naïve B cells from RRMS patients stimulated with CD40L alone produced significantly more IL-10 than memory B cells from the same RRMS patients (89±30 pg/mL vs. 13±10 pg/mL, p<0.01, Figure 2C), suggesting that a subset of naïve B cells from RRMS patients may be functioning as regulatory cells not present in HD. Upon addition of BCR stimulation, we observed an insignificant decrease in the amount of IL-10 produced by RRMS naïve B cells stimulated with BCR and CD40L stimulation in combination versus CD40L stimulation alone (89±30 pg/mL vs. 28±9 pg/mL, p=0.09, un-paired t-test, Figure 2C and 2D). Others have demonstrated that naïve B cells from HD secrete significant concentrations of IL-10 [20, 29], but we did not observe any significant IL-10 production by naïve or memory B cells from HD in our cohort stimulated with either CD40L alone or BCR and CD40L stimulation in combination. This discrepancy is likely attributed to differences in culturing systems, and not a feature peculiar to our HD cohort.
Memory B Cells from RRMS patients elicit more neuro-antigen specific CD4+ T cell proliferation than memory B cells from HD
In vivo depletion of B cells in the context of RRMS results in a reduction of gadolinium enhancing lesions and a reduction in the number of T cells within the CSF [1], which substantiates a role for B cells in MS as mediators of T cell expansion, activation and pathogenicity. Since the majority of B cells found in the CSF of RRMS patients are short-lived plasma blasts and memory B cells [22, 23], we hypothesized that within the memory B cell pool of RRMS patients, there is a sub-population of memory B cells that operate as potent neuro-antigen presenting cells that supports neuro-antigen reactive T cell expansion and activation. To test this hypothesis, we investigated the potential of primary ex vivo memory and naïve B cells to elicit autologous T cell proliferation to one control antigen (TT), two candidate neuro-antigens (MBP and MOG), and GA, which is an FDA approved therapeutic agent in the treatment of MS that has similar biochemical properties to MBP [30]. Purified memory or naïve B cells were incubated with purified autologous T cells, and T cell proliferation was measured by CFSE dilution as described in the materials and methods. Two examples (MS-10 and MS-1) of the output data highlighting the variance in responses between patients are provided in Figure 3. Memory and naïve B cells from MS-10 (Figure 3A) and MS-1 (Figure 3B) did not induce CD4+ T cell proliferation in the absence of antigen. Both naïve and memory B cells from MS-10 and MS-1 induced CD4+ T cell proliferation in response to TT. Memory B cells from MS-10, but not MS-1, induced CD4+ T cell proliferation in response to MBP. Memory and naïve B cells from MS-10, but not MS-1, induced CD4+ T cell proliferation in response to MOG. Naïve and memory B cells from MS-10 and memory B cells from MS-1 induced CD4+ T cell proliferation in response to GA. These same assays were performed on 11 MS patients and 10 HD and the results depicted in Figure 4.
FIGURE 3. CD4+ T cell proliferation from RRMS patients.
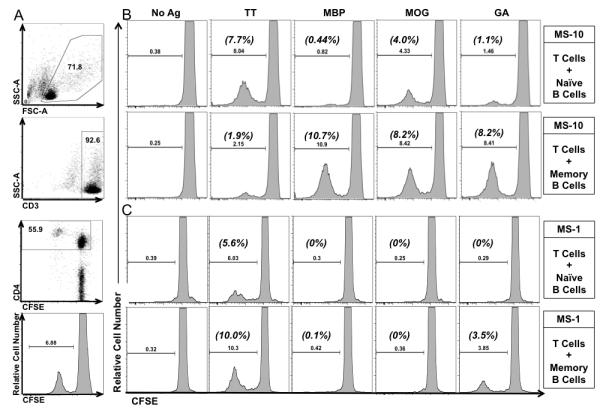
A) Example of gating strategy used to obtain the raw percentage of CD3+CD4+ T cell proliferation in co-culture of purified CFSE-labeled T cells and autologous FACS purified CD27+CD19+ memory B cells in the presence of 5 ug/mL of TT, from HD-12. Numbers inside of gates are the percentage of cells in each gate. Example of proliferation histograms from MS-10 (B), and MS-1 (C) of CD3+CD4+ T cell proliferation in cocultures of purified CFSE-labeled T cells and autologous highly purified FACS-sorted naïve B cells (top rows) or memory B cells (bottom rows) along with antigens where indicated (above columns). Raw percentage of CD4+ T cell proliferation was determined by gating on CFSElowCD3+CD4+ cells and listed above the histogram gates. ΔProliferation was calculated by subtracting background (No Ag) proliferation (listed in parenthesis above gate). MS-10 CD4+ T cell viability was 40.6±0.3% and 40.8±1.6% in naïve B-T and memory B-T cell cultures respectively. MS-1 CD4+ T cell viability was 36.9±1.7% and 38.3±2.2% in naïve and memory B-T cell cultures respectively.
FIGURE 4. Memory B cells from RRMS patients elicit greater neuro-antigen specific CD4+ T cell proliferation than memory B cells from HD.
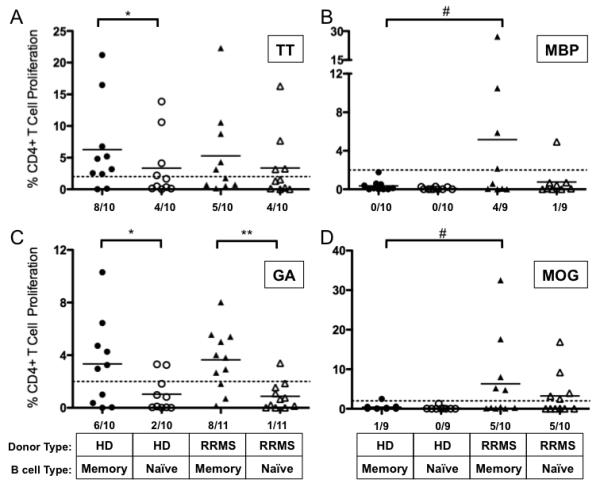
Highly purified, ex vivo naïve and memory B cells from cryopreseved HD and RRMS PBMC were incubated with purified autologous T cells, and CD4+ T cell proliferation by CFSE dilution was measured in vitro culture after 5 days in response to (A) TT, (B) MBP, (C) GA and (D) MOG antigens (see Figure 3 for sample histograms). Threshold of CD4+ T cell proliferation considered positive was set at 2% and is depicted by a dashed line in all panels. Individual points represent individual donor responses, and black bars represent mean values for each group. *p<0.05, **p<0.01, multiple comparisons post-hoc analysis with Bonferroni correction after two-way mixed model ANOVA. #p<0.05, chi-squared comparing number of positive responders above threshold. Number of responders/donors is indicated at the bottom of each panel. T cell viability of MS CD4+ T cells is listed in Supplementary Table 1.
Because HD and RRMS are presumably immunized to tetanus at the same frequency and have similar frequencies of residual memory B and T cells, we expected that CD4+ T cell proliferation in response to TT when memory B cells were included in the cultures would be similar in HD and RRMS patients. Indeed, memory B cells from HD and RRMS patients elicited similar CD4+ T cell proliferation in response to TT (p=0.16, χ2-test, Figure 4A). Also as expected, memory B cells elicited greater mean CD4+ T cell proliferation in response to TT than naïve B cells in HD (6.3±2.4% vs. 3.4±1.6%, p<0.05, Figure 4A). However, in the RRMS patient cohort, CD4+ T cell proliferation in response to TT was similar in co-cultures containing memory B or naïve B cells (5.3±2.3% vs. 3.4±1.7%, p>0.05, Figure 4A).
In contrast, memory B cells from some of the RRMS patients, but not from any of the HD, elicited CD4+ T cell proliferation in response to MBP (4/9 vs. 0/10 responders, respectively, p=0.018, χ2-test, Figure 4B). Memory B cells from RRMS patients were also more likely to elicit CD4+ T cell proliferation than memory B cells from HD in response to MOG, although this trend did not meet statistical significance (5/10 vs. 1/9 responders respectively, p=0.069, χ2-test, Figure 4D). In contrast, memory B cells from HD and RRMS patients had enhanced capacities to elicit CD4+ T cell proliferation in response to GA in comparison to naïve B cells (3.3±1.0% vs. 1.02±0.4%, p<0.01 and 3.6±0.7 vs. 0.86±0.32, p<0.01, respectively, Figure 4C). Interestingly, naïve B cells from RRMS patients or HD could not elicit CD4+ T cell proliferation in response to MBP or GA, but naïve B cells from RRMS patients could elicit CD4+ T cell proliferation in response to MOG more readily than naïve B cells from HD (p=0.02, χ2-test, Figure 4D). The frequency of MOG specific CD4+ T cells is increased in the RRMS patient cohort in comparison to HD (Supplemental Figure 1), which may explain this finding. The frequency of TT, MBP and GA specific CD4+ T cells was similar in the HD and RRMS patient cohorts (Supplemental Figure 1).
Memory B cells from RRMS patients induce greater antigen-specific IFN-γ secretion than memory B cells from HD
CD4+ T cells proliferated in response to both neuro-antigen and control antigens in vitro, and so our next goal was to determine whether IFN-γ secretion (as a measure of Th1 responses) was affected when memory or naïve B cells were the source APC in these culture conditions (Figure 5). In whole PBMC cultures from HD, TT does not typically induce a significant IFN-γ response [31, 32]. In agreement with these data, both memory and naïve B cells from our HD cohort induced little IFN-γ production in B-T cell co-culture supernatants in response to TT (85±33 pg/mL vs. 68±40 pg/mL, p=0.86, Figure 5A). However, both memory and naïve B cells from the RRMS patient cohort induced levels of IFN-γ above the set threshold in response to TT, and memory B cells from RRMS patients were more likely to induce IFN-γ secretion than memory B cells from HD (0/7 vs. 6/9, respectively, p=0.006, χ2-test, Figure 5A).
FIGURE 5. Memory B cells from RRMS patients elicit greater antigen-specific IFN-γ secretion than memory B cells from HD.
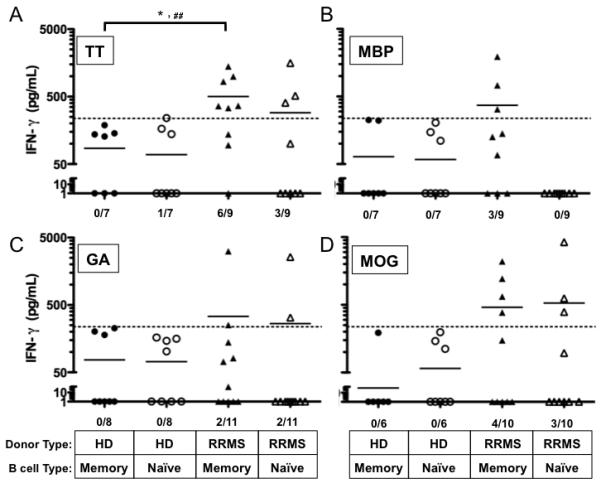
Highly purified, ex vivo naïve and memory B cell subsets from the HD and RRMS patient cohorts were incubated with purified autologous T cells, and IFN-γ secretion was measured after 5 days in culture supernatants in response to (A) TT, (B) MBP, (C) GA, and (D) MOG. Individual points represent individual donor responses, and black bars represent mean values for each group. Threshold of IFN-γ production was set at 237 pg/mL and was determined empirically by adding 2 standard deviations to the mean detectible IFN-γ production observed in B-T co-cultures when no antigen was present. The threshold is depicted as a dashed line in all panels. #p<0.05, chi-squared test comparing number of positive responders above threshold. Number of responders/donors is indicated at the bottom of each panel.
Because we observed a significantly greater number of memory B-T cell co-cultures from RRMS patients that resulted in CD4+ T cell proliferation to MBP compared to HD, we expected to find that IFN-γ secretion would also be concomitantly increased in response to memory B cells from RRMS patients presenting MBP to autologous T cells. Indeed, we observed that memory B cells from 3 of 9 RRMS patients induced IFN-γ secretion in B-T cell co-cultures with MBP, while memory B cells from 0 of 7 HD did not (Figure 5B). Naive B cells from either HD or RRMS patients did not induce significant IFN-γ secretion in response to MBP (Figure 5B). These results would indicate that in at least a subset of RRMS patients, IFN-γ secretion in response to MBP is induced by memory B cells but not naïve B cells. However, it should be noted that the amount of IFN-γ secretion did not consistently correlate with the frequency of CD4+ T cells that proliferated in these culture conditions (Supplementary Table 1), and statistical significance was not reached when comparing the number of responders in each cohort (p=0.09, χ2-test).
Glatiramer acetate induces both IFN-γ and IL-5 cytokine secretion in T cell lines derived from HD naïve to GA [33]. Therefore, we hypothesized that primary ex vivo T cells from HD and our GA-treatment naïve RRMS patient cohort would also secrete IFN-γ and IL-5 in response to both memory and naïve B cells presenting GA. Instead, no significant IFN-γ was produced in response to GA when either naïve or memory B cells from HD were APC (0/8 vs. 0/8 responders respectively, p=1, χ2-test, Figure 5C). Only 2/11 donors from the RRMS cohort produced significant amounts of IFN-γ (Figure 5C) and IL-5 (data not shown) in response to GA presented by either memory or naïve B cells.
In a previous study, IFN-γ secreting T cells from untreated MS patients were increased in response to purified whole MOG in comparison to control patients [34]. Similar to that observation, memory B cells from 4 of 10 RRMS patients, and 0 of 6 HD, induced IFN-γ secretion in the B-T cell co-cultures in response to MOG (Figure 5D). Naïve B cells from 3 of 10 RRMS patients and 0 of 6 HD induced IFN-γ secretion in the B-T cell cultures in response to MOG (Figure 5D). However, statistical significance was not reached when comparing the number of RRMS and HD responders that secreted IFN-γ in response to MOG presented by memory or naïve B cells (p=0.09 and p=0.13, respectively, χ2-test). There was also no significant difference in the mean concentration of IFN-γ detected in B-T cell co-cultures containing memory or naïve B cells presenting MOG (460±230 vs. 532± 414 pg/mL, p=0.9).
MBP and GA binding B cells are enriched in the memory B cell compartment of both HD and RRMS patients
In order to determine if we could correlate the extent of CD4+ T cell proliferation that occurred through B cell antigen presentation and IFN-γ secretion to the frequency of antigen specific B cells present in memory and naïve B cell populations in our donors, we chose to make use of a technique that has been utilized by us [26] and others [35] to identify antigen specific B cells by flow cytometry. An example of the gating strategy used to identify OVA and GA antigen binding memory and naïve B cells is shown in Figure 6.
FIGURE 6. B cells that bind MBP and GA are more prevalent in the memory B cell pool than the naïve B cell pool in both HD and RRMS patients.
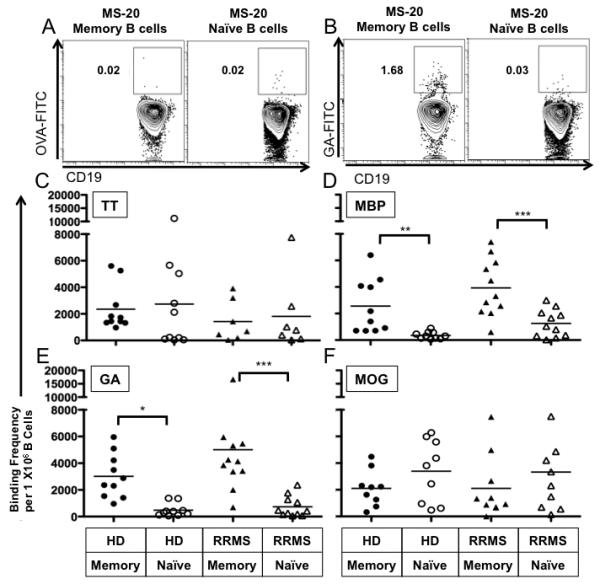
PBMC from HD and RRMS patients were incubated with FITC-conjugated antigens as described in the Materials and methods. Naïve and memory B cells were gated as shown in Figure 1A. Examples of gating used to enumerate the percentage of memory B cells or naïve B cells (from RRMS patient MS-20) that bound OVA and GA are provided in panels A and B respectively. Of note, OVA-FITC binding represents both OVA-binding and FITC-binding B cells. The frequency of (C) TT-, (D) MBP-, (E) GA-, and (F) MOG-binding B cells for the RRMS patient and HD cohorts were calculated as described in the Materials and methods and depicted here as individual points on the vertical scatter plots. The average frequency of binding in each group is shown as a solid black horizontal line in each panel. The mean OVA binding frequency was 93 cells per million for HD memory B cells; 119.3 cells per million for HD naïve B cells; 636.5 cells per million for RRMS memory B cells; and 471.5 cells per million for RRMS naïve B cells. *p<0.05, **p<0.01, ***p<0.001; multiple comparisons post-hoc analysis with Bonferroni correction after two-way mixed model ANOVA.
The number of naïve and memory B cells that bound TT was similar in the HD and RRMS patient cohorts (Figure 6C). However, MBP binding B cells were significantly enriched in the memory B cell compartment in comparison to the relative number of naïve B cells that bound MBP in both HD (2342±678 vs. 329±90 per 1×10⁶ cells, p<0.01, Figure 6D) and RRMS patients (3931±652 vs. 1255±309 per 1×10⁶ cells, p<0.001, Figure 6D). The frequency of MBP binding memory B cells was similar between HD and RRMS patients (p=0.053, Figure 6D), although only memory B cells from RRMS patients were able to elicit CD4+ T cell proliferation (Figure 4B). In contrast to the relative enrichment of MBP binding B cells in the memory B cell compartment in both HD and RRMS patients, no such relative enrichment of MOG binding B cells in the memory B cell compartment of HD and RRMS patients was observed (Figure 6F), even though B cells from RRMS patients and not HD were able to elicit CD4T cell proliferation in response to MOG.
GA has many similar biochemical properties to MBP including undefined secondary structure in solution and overall positive charge, so we expected to find that the number of B cells that bound GA would be enriched in the memory B cell compartment as well. Indeed, GA binding B cells were also significantly enriched in the memory B cell compartment in comparison to the relative number of naïve B cells that bound GA in both HD (3095±579 vs. 517±166 per 1×10⁶ cells, p<0.05, Figure 6E) and RRMS patients (5010±1250 vs. 735±235 per 1×10⁶ cells, n=11, p<0.001, Figure 6E). Interestingly, in addition to memory B cells containing higher frequencies of GA binding, memory B cells were also able to elicit CD4+ T cell proliferation more readily in response to GA than their naïve B cell counterparts.
DISCUSSION
In this study, we investigated the phenotypic attributes and antigen-presenting role of memory vs. naïve B cells from MS patients. While B cells from MS patients were phenotypically similar to those from healthy subjects and also showed similar patterns of LTα secretion (as a representative of pro-inflammatory cytokine release potential) in response to polyclonal stimuli, we found that memory B cells from a subset of MS patients, but not HD, elicited autologous CD4+ T cell proliferation in response to MBP and MOG. At the same time, both MS patients and HD elicited autologous CD4+ T cell proliferation in response to TT and GA. Thus, the differences were significantly centered on CNS-specific T cell responses, which are relevant to the pathogenesis of MS.
Our findings cannot be attributed to an enrichment of neuro-antigen reactive memory B cells in RRMS patients, since the neuro-antigen binding assay indicated that the frequencies of neuro-antigen binding memory B cells are similar in HD and RRMS patients. We cannot rule out, however, that other features of memory B cells from RRMS patients render them more capable of inducing neuro-antigen specific CD4+ T cell proliferation and cytokine secretion than their HD counterparts, including higher production of other inflammatory cytokines such as IL-1, IL-6, IL-8 and TNF, which are also readily produced by human B cells [36], but were not measured in this series of experiments. It should also be noted that the ability of memory B cells from RRMS patients, but not HD to elicit CD4+ T cell proliferation in response to MBP was not attributable to general enrichment of MBP specific T cells in the RRMS patients, since the frequency of MBP specific T cells was similar in the HD and RRMS patient cohorts for this study. Others have also observed that the overall frequency of MBP specific T cells is similar between HD and RRMS patients [37-39].
In contrast, the frequency of MOG specific T cells in the RRMS cohort was enriched in comparison to the HD cohort used for this study. Others have also observed that the frequency of MOG specific T cells is enriched in RRMS patients compared to HD [40, 41]. It is possible then, that the enhanced ability of memory and naïve B cells from RRMS patients, but not HD, to elicit CD4+ T cell proliferation and IFN-γ secretion in response to MOG is not due to enrichment of MOG-binding B cells in RRMS patients compared to HD, but may instead be due to enrichment of MOG specific T cells in the RRMS patients. Prior reports by others indicate that neuro-antigen-reactive memory T cells in particular are more prominent in RRMS patients than in HD [38, 42]. Thus, it is possible that B cells preferentially elicit proliferation and cytokine secretion by memory T cells, which may be most relevant to the underlying disease process. Determining the type of CD4+ T cell that is engaged by naïve and memory B cells in a MOG-specific manner is the focus of future studies by our laboratory.
The finding that MBP specific memory B cells are enriched in the peripheral blood of RRMS patients (compared to naïve) suggests that perhaps MBP specific B cells were primed in the periphery and have an effector function in the periphery as well. B cells could influence the pathogenesis of MS by priming T cells in secondary peripheral lymphoid organs, which then migrate to the CNS. B cells residing in the CNS may further promote CNS T cell activation, although this has not been formally tested. However, it should be noted that MBP specific memory B cells were also enriched in the peripheral blood of HD when compared to naïve B cells. In this scenario, HD peripheral memory B cells do not elicit CD4+ T cell proliferation in response to MBP. What impact removal of MBP-binding memory B cells has on the ability of the remaining B cell pool to elicit effector T cell function in response to MBP is under investigation in our laboratory.
GA-specific memory B cells, which are cross-reactive with MBP, may elicit the activation of MBP specific CD4+ T regulatory cells (Treg). In vitro treated CD4+CD25high Treg show increased IL-10 production in response GA treatment [43]. In addition, it was recently demonstrated that while untreated MS patients have reduced numbers of peripheral CD4+ Treg in comparison to HD, GA treatment restores both the number and functionality of these Treg [44]. Perhaps this would suggest that memory B cells contribute most significantly to the expansion of CD4+ Treg in patients undergoing GA therapy.
Our data demonstrated that memory B cells from a subset of RRMS patients elicited IFN-γ secretion in response to MBP and MOG, but that memory B cells from HD did not elicit IFN-γ secretion in response to MBP and MOG. This data suggests that memory B cells from RRMS patients are more likely to promote activation of Th1 specific clones in response to MBP and MOG than memory B cells from HD. Of note, this response did not correlate with CD4+ T cell proliferation in individual patients (Supplementary Table 1), and a comparison of MBP and MOG responders (defined as those patients whose B cells elicited IFN-γ secretion in response to MBP or MOG) in the RRMS and HD cohorts did not reach statistical significance. Other factors, such as the influence of CD8 T cells [45-47] may explain the dichotomy in responses. Naïve B cells from 3 of 10 RRMS patients were also able to elicit IFN-γ secretion in response to MOG, and we cannot rule out that a small population of memory B cells that are CD27- [48] may be present in our naïve B cell pools. Thus, it is possible that the IFN-γ secretion elicited by the naïve B cells from these 3 RRMS patients was mediated by CD27- memory B cells.
Interestingly, significant IFN-γ and IL-5 secretion was consistently observed in cultures where memory B cells from RRMS patients were presenting Tetanus Toxoid (TT) to T cells, suggesting that memory B cells are capable of stimulating both Th1 and Th2 TT reactive clones. Also of note, IFN-γ secretion in response to memory B cells from RRMS patients presenting TT was enhanced compared to memory B cells from HD presenting TT (Figure 5A). This is significant as it would suggest that TT specific T cell clones which do not typically secrete IFN-γ or show a predominant Th1 profile in HD [32, 49-51] have been skewed towards a Th1 phenotype in some RRMS patients. In fact, it was recently demonstrated that female RRMS patients show an exaggerated IFN-γ response to TT in PBMC as compared to control females [52]. Our data may suggest that memory B cells from RRMS patients are likely candidates influencing this phenomenon.
In contrast to the increase in IFN-γ secretion in response to memory B cells presenting neuro-antigens or TT, IFN-γ secretion in response to memory B cells presenting GA was rarely observed (Figure 5C)(compare 6/9 TT responders to 2/11 GA responders, p=0.03). Yet CD4+ T cell proliferation in the presence of memory B cells and GA was robust in the majority of RRMS patients (Figure 4C). CD4+ T cell proliferation in the presence of memory B cells and GA was also robust in the majority of HD, yet IFN-γ was not observed in the majority of these cultures either. This data would suggest that memory B cells from RRMS patients and HD naïve to GA therapy maintain their capacity to elicit CD4+ T cell proliferation in response to GA, but that in most cases, are not able to drive T cell effector functions such as IFN-γ secretion. This was somewhat unexpected as the majority of GA-specific T cell lines derived from GA-naïve MS patients secrete IFN-γ readily [53, 54]. However, GA-specific T cell lines generated from MS patients that have been treated for several months with GA secrete significantly less IFN-γ [53]. We would not expect that IFN-γ reactive T cell clones were absent in the MS patient cohort samples used in these studies since the patients were treatment naïve and in early stages of disease. It would be interesting to determine whether memory B cells from RRMS patients benefiting from GA therapy would additionally lose their capacity to elicit CD4+ T cell proliferation in response to GA, and the duration of GA therapy that is required to initiate this effect.
Of note, it has been documented that GA may not need to be processed since it binds directly to HLA-DR on the surface of APC [55]. We were able to purify sufficient numbers of memory B cells from one patient to test whether GA processing by memory B cells was required to induce CD4+ T cell proliferation. Indeed, pretreatment of memory B cells with chloroquine, a lysosomotropic agent that prevents antigen processing, prior to co-culture with T cells and GA, reduced CD4+ T cell proliferation below the detection threshold in response to GA (data not shown).
Since sera from a subset of RRMS patients and HD contain MBP and MOG reactive antibodies [56], we predicted that we would be able to detect memory B cells from RRMS patients and HD that would bind to MBP and MOG. Indeed, we detected memory B cells from RRMS patients and HD that bound MBP and MOG, yet only memory B cells from RRMS patients, but not from HD, elicited CD4+ T cell proliferation in response to MBP or MOG. As mentioned earlier in the discussion, this finding may be attributable to features of memory B cells from RRMS patients that are not present on memory B cells from HD or some differential enrichment of MBP- or MOG-specific memory T cells in the RRMS patients in comparison to HD. Thus, neuro-antigen binding memory B cells may have merit as a new target for immunotherapy.
However, naïve B cells from some RRMS patients, which bind to MOG at similar frequencies as memory B cells from RRMS patients, are also able to elicit CD4+ T cell proliferation in response to MOG. This finding is unique to MOG-reactive naïve B cells from RRMS patients since MBP-reactive naïve B cells from the same patients do not elicit appreciable CD4+ T cell proliferation in response to MBP. One possibility is that MOG-specific memory T cells enriched in RRMS patients can be reactivated by both memory and naïve B cells. Previous studies indicate that naïve B cells can elicit memory T cell activation [12]. However, this hypothesis would apply only to MOG-specific responses, since naïve B cells do not elicit CD4+ T cell proliferation in response to MBP. It is also possible that if we had pre-activated naïve B cells from the RRMS patients, we may have also observed CD4+ T cell proliferation in response to MBP.
A second possibility is that MOG may be serving as a molecular mimic for an antigen recognized equally well by both the memory and naïve B cell repertoire, explaining the ability of both of these subtypes of B cells to bind and present MOG to T cells. For example, it has been demonstrated that MOG serum antibodies cross-react with epitopes present in the milk protein, butyrophilin [57]. Additionally mice transgenic for IgH and IgL recognizing a conformationally specific epitope of MOG undergo receptor editing to endogenous light chains on both MOG sufficient and MOG deficient genetic backgrounds indicating some form of cross-reactivity of the MOG reactive antibodies to a distinct self protein [58]. MOG could also potentially act as an auto-stimulatory TLR agonist in the context of RRMS as ribonucleoprotein particles do in the context of SLE [59].
Speculation as to the development of neuro-antigen specific memory B cells in the context of RRMS is of great interest given the fact that autoreactive B cells are typically negatively selected during development [60], or are prevented from accessing a germinal center reaction [61, 62]. Our results suggest that in this subset of RRMS patients whose memory B cells promoted CD4+ T cell expansion to MBP or MOG in vitro, either peripheral mechanisms of B cell tolerance failed or tolerance has been overcome through sensitization. Tolerance for example can be overcome by sensitization in a mouse model where B cells that express BCR specific for an endogenous neo-antigen are negatively selected during B cell development but none-the-less can develop a memory B cell repertoire that recognizes this neo-antigen after immunization [63]. In addition, it was demonstrated that inherently autoreactive VH4-34 expressing B cells are not excluded from a germinal center reaction and can develop into memory B cells in the context of SLE [61, 64]. Whether this same principle explains the enrichment of neuro-antigen specific B cells in RRMS patients remains unexplored.
In conclusion, these studies identify MBP and MOG specific memory B cells as potent activators of neuro-antigen specific T cells from RRMS patients, but not HD. Thus, memory B cells may promote the exacerbation of RRMS by activating T cells in the periphery. Such studies provide a mechanistic explanation for why specific depletion of B cells from RRMS patients is beneficial for some MS patients and may indicate the need to investigate depletion of specific subsets (memory B cells) as a therapeutic strategy for patients whose memory B cells elicit CD4+ T cell proliferation and IFN-γ secretion in response to neuro-antigens.
MATERIALS AND METHODS
HUMAN SAMPLES
MS patients were recruited at the University of Texas Southwestern Medical Center according to Institutional Review Board approved criteria and underwent leukapheresis. MS patients included in this study had been diagnosed with clinically definite relapsing remitting MS within two years of leukapheresis, or had monosymptomatic multiple sclerosis meeting the controlled criteria for the high-risk subjects Avonex multiple sclerosis prevention study (CHAMPS) [65]. MS patient characteristics are listed in Table 1. All MS patients had at least one exacerbation in the preceding two years but not within 60 days prior to leukapheresis sampling. None of the MS patients included in this study had primary progressive, secondary progressive or progressive relapsing MS. MS patients did not use corticosteroids 60 days prior to leukapheresis and were treatment naïve to disease modifying immunomodulatory therapies including interferons, monoclonal antibodies, glatiramer acetate, or methotrexate. MS patient peripheral blood mononuclear cells (PBMC) were obtained from leukapheresis through ficoll density separation and cryopreserved on the same day of leukapheresis. Healthy donor (HD) buffy coats (white blood cell filter bags) were purchased from Carter Blood Care (Bedford, TX). Buffy coats from HD were processed via ficoll density separation to obtain PBMC, which were cryopreserved on the same day as the blood donation.
Table 1.
Patient Characteristics
| ID Number | Agee | Sex | EDSSe,f |
|---|---|---|---|
| MS-1 c,d | 23 | F | 1.5 |
| MS-2 a,b,c,d | 25 | F | 1.5 |
| MS-4 a,b,d | 43 | F | 1.5 |
| MS-5 a,b,c | 47 | F | 2.5 |
| MS-10 a,b,c,d | 47 | F | 2 |
| MS-11 a,b,c,d | 40 | M | 0 |
| MS-12 a,b | 52 | F | 1.5 |
| MS-13 a,b | 41 | F | 1 |
| MS-14 c | 41 | F | 2 |
| MS-15 c | 32 | F | 1.5 |
| MS-16 c | 25 | F | 0 |
| MS-17 c,d | 44 | F | 3.5 |
| MS-18 c,d | 37 | F | 2.5 |
| MS-19 a,b,d | 35 | F | 2 |
| MS-20 a,b,c | 27 | M | 1.5 |
| MS-21 a,b | 34 | F | 1 |
| MS-22 a,b | 44 | F | 1.5 |
| MS-23 a,b,d | 50 | F | 3 |
| MS-24 a,b,d | 34 | F | 2 |
| MS-25 a,d | 46 | M | 2.5 |
| MS-26 a | 23 | F | 2 |
| MS-27 a | 26 | F | 2.5 |
Sample used in measurement of peripheral B cell percentages, CD80 MFI
Sample used in measurement of HLA-DR MFI
Sample used in measurement of CD4+ T cell proliferation, IFN-γ secretion and antigen binding assay by flow cytometry
Sample used in measurement of LTα and IL-10 secretion
at time of leukapheresis
Expanded Disability Status Scale for MS [70]; n.d. = no data
B CELL PURIFICATION AND SORTING
B cells from both RRMS and HD were enriched from cryopreserved PBMC through CD19 magnetic positive selection using the CD19-DM system (BD Biosciences, San Jose, CA) according to manufacturers instructions. Enriched B cells were then stained with CD19-PECy5 and CD27-PE (BD Biosciences) and sorted on a FACS Aria (BD Biosciences). Live B cells based on FSC vs. SSC characteristics were sorted to purity (≥99%) into naïve (CD19+CD27-) and memory (CD19+CD27+) B cell populations. The naïve B cell populations used for these studies may have included a small subset of memory B cells that are CD27- [48].
INDUCTION OF B CELL CYTOKINE PRODUCTION IN RESPONSE TO CD40L STIMULATION
Cytokine production was measured in sorted naïve and memory B cell culture supernatants that had been stimulated with CD40L or CD40L plus anti-IgM/IgG using modifications of methods described previously [20]. Briefly, sorted naïve and memory B cells were plated into 96-well flat-bottom plates (Costar) at 1.5×10⁵ cells per well in 200 μL of human culture medium (10% human serum AB, 100 μg/mL Penicillin, 100 IU Streptomycin, 2 mM l-glutamine, 90% IMDM). For CD40L stimulation, NIH-3T3 cells expressing human CD40L (a gift from Gordon Freeman, [66]) were irradiated with 96 Gy and were added to B cells at a ratio of 15:1 B cells to NIH-3T3 cells. For BCR crosslinking plus CD40L stimulation, 1.5×10⁵ naïve or memory B cells were incubated with 0.5 μg/mL of F(ab)2 anti-human IgG and IgM (Jackson Immunoresearch) for 24 hours before being transferred to a pre-adhered monolayer of irradiated CD40L+ NIH-3T3 cells at a ratio of 15:1 B cells to NIH-3T3 cells.
B-T CULTURE SET UP
Purified T cells were obtained by negative magnetic selection from autologous donor cryopreserved PBMC using the T cell enrichment-DM system (BD Biosciences) according to manufacturers instructions. Purified T cells were diluted to 50×106 cells per milliliter (mL) and stained with 10 μM carboxyfluorescein diacetate, succinimidyl ester (CFSE; Invitrogen) for 5 minutes in PBS. CFSE labeled T cells were washed twice and resuspended in human culture medium (10% human serum AB, 100 μg/mL Penicillin, 100 IU Streptomycin, 2 mM l-glutamine, 90% IMDM). 1×10⁶ CFSE labeled T cells were cultured with no additional cells, 1×10⁵ naïve B cells, or 1×10⁵ memory B cells in 1 mL of human culture media in round bottom polystyrene tubes (Becton Dickinson). Neither the memory or naïve B cells were pre-activated for this series of experiments. For whole PBMC cultures, PBMC were cultured at a density of 1×10⁶ cells in 1 mL of human culture media in round bottom polystyrene tubes. PBMC and B-T cell co-cultures contained either no exogenous antigen, 5 μg/mL Tetanus Toxoid (TT; Massachusetts Biological Laboratories) 10 μg/mL native bovine myelin basic protein (MBP; Genway Bio-Products), 10 μg/mL glatiramer acetate (GA; Teva Pharmaceuticals), or 10 μg/mL of the recombinant extracellular domain of human oligodendrocyte glycoprotein (MOG; a kind gift from Jeri Anne Lyons, Milwaukee, WI), and were cultured for 5 days at 37°C in a humidified chamber.
EXAMINATION OF T CELL SUBSETS FOR ACTIVATION AND PROLIFERATIVE RESPONSES IN B-T CELL CO-CULTURES
B-T cell co-culture supernatants were harvested after 5 days in culture and frozen at −20°C for batch analysis of cytokine secretion. PBMC or cells in the B-T cell co-cultures were stained with optimal amounts of CD4-PE/CY7, and CD3-APC. At least 100,000 events in the live cell gate (based on FSC×SSC characteristics) were collected for each condition on a FACS LSRII (BD Biosciences). CD4+ T helper cells were considered CD4+CD3+. CD4+ T cell percent viability was estimated by dividing the number of CD4+ T cells in the live cell gates by the total number of CD4+ T cells collected. Proliferation was quantified as a percentage by dividing the number of CD4+ T cells in the CSFE low gate by the total number of T cells in the live gate. In order to normalize the data between assays, the percentage of T cell proliferation observed in the absence of antigen was subtracted from the percentage of T cell proliferation observed in the presence of antigen (ΔProliferation). If ΔProliferation was negative, the antigen-specific proliferation was graphed as a zero value. However, for statistical comparisons, the actual normalized values were used. To clarify, the ΔProliferation values represent the percent of proliferating input T cells and daughter cells. A threshold value for positive proliferation was set at 2%, similar to thresholds set for positive proliferation documented previously [67]. All fluorescently labeled monoclonal antibodies were obtained from BD Biosciences (San Jose, CA).
MEASUREMENT OF CYTOKINE SECRETION IN B-T CELL CULTURE SUPERNATANTS
Interleukin-5 (IL-5), Interferon-gamma (IFN-γ), Interleukin-10 (IL-10), or lymphotoxin-alpha (LTα) capture monoclonal antibodies were diluted to 2 μg/mL in 0.1 M NaHCO3 and coated onto Immulon 2HB 96-well plates (Thermo-Fisher Scientific, Pittsburgh, PA) overnight at 4°C. Plates were then washed twice with wash buffer (PBS, 0.1% v/v Tween-20) and incubated with blocking buffer (1% BSA in PBS) for 2 hours at room temperature. Plates were washed 2 times and samples which had been previously frozen at −20°C for batch analysis as well as standards were added to the plate and incubated overnight at 4°C. Plates were washed 4 times and incubated with 1 μg/mL paired-biotinylated anti-cytokine antibodies for 1 hour. Plates were then washed 6 times and incubated with 2.5μg/mL streptavidin-HRP (Jackson Immunoresearch, West Grove, PA) for 30 minutes. Signal was developed using TMB substrate (Sigma). All monoclonal antibodies used for capture and detection were purchased from BD Biosciences (San Jose, CA). Of note, low levels of IFN-γ were detected by ELISA in B-T cell cultures in the absence of antigen. Therefore, we set the threshold level of IFN-γ secretion at 237 pg/mL, which was the mean secretion (plus two standard deviations) observed in all B-T cell co-cultures from HD in the absence of antigen.
CONJUGATION OF WHOLE PROTEINS WITH FITC
Ovalbumin (OVA; Sigma, St. Louis, MO), Tetanus Toxoid (TT; Massachusetts Biologic Laboratories, Worchester, MA), Myelin Basic Protein (MBP; Genway Biotech, San Diego, CA), Myelin Oligodendrocyte Glycoprotein (MOG; a kind gift of Jeri Lyons, Milwaukee, WI) and Glatiramer Acetate (GA; TEVA Neuroscience, Kansas City, MO) were resuspended in PBS at a concentration of 2 mg/mL and incubated with 10 μM FITC (Pierce, Rockford, IL) for 60 min at room temperature. Unbound FITC and low molecular weight species of GA were removed by size exclusion gel filtration, using high performance desalting resin with molecular weight cutoff of 7,000 daltons (Pierce, Rockford, IL). 0.1% NaN3 was added to the conjugated protein preparations as preservative. OVA-FITC was generated to detect background of OVA (and FITC-) reactive B cells [68].
QUANTITATION OF ANTIGEN SPECIFIC B CELLS
Cryopreserved PBMC from HD and RRMS patients were assayed for their ability to bind FITC conjugated proteins as described by others [69] with modifications. Briefly, 2×10⁶ PBMC were resuspended in 80 μL of protein binding buffer (10% FBS, 0.1% NaN3, in PBS). PBMC were incubated with either no exogenous antigen, or pre-determined amounts of FITC conjugated OVA, TT, MBP, MOG, or GA. in a final volume of 100 μL on ice for 1 hour. Cells were then washed twice in ice-cold buffer and incubated with CD19-PE/CY5 and CD27-PE (BD Biosciences, San Jose, CA) for 30 min on ice. Cells were then washed once in ice-cold buffer, and 1 μL propidium iodide (PI; BD Biosciences, San Jose, CA) added to exclude dead cells. 1×10⁶ events in the live cell gate were collected on a C6 flow cytometer (Accuri, Ann Arbor, MI) and analyzed with Flowjo Software (Treestar, Ashland, OR). Cells were gated on live lymphocytes based on FSC×SSC characteristics and exclusion of PI, and further gated into naïve (CD19+CD27−) and memory (CD19+CD27+) B cell subsets. The percent of naïve and memory B cells binding FITC labeled proteins were quantified as antigen specific B cells.
STATISTICS
Mean values are reported plus and minus the standard error (SE). Unless noted otherwise, mean naïve or memory lymphocyte percentages, CD80 MFI, HLA-DR MFI, cytokine secretion, T cell proliferative responses, and B cell protein binding assays were compared between HD and RRMS patients (between donor group) and naïve and memory B cell responses (repeated measures within donor group) using two-way mixed model analysis of variance (ANOVA). When overall ANOVA p-values were found to be significant (less than 0.05) a multiple comparison post-hoc analysis with Bonferroni correction was used to determine which means differed significantly, and estimated p-values are reported. Non-significant p-values are reported as exact p values. In some cases where two-way ANOVA was not appropriate, mean responses were compared using un-paired t-test (between donor group) and paired t-test (within donor group) and exact p-values are reported. Chi-Squared analysis was used to compare number of positive responders between HD and RRMS.
Supplementary Material
ACKNOWLEDGEMENTS
We thank all of the patients who donated samples for use in this study. We also thank Gordon Freeman for the kind gift of CD40L+ NIH3T3 cells. This work was supported by grants from Teva Neuroscience, Kansas City, MO (NLM), Howson Funds (NLM), and the National Institute of Allergy and Immunology (NJK), and NRSA T32 AI005284-28 (CTH).
Abbreviations
- RRMS
relapsing remitting multiple sclerosis
- LTα
lymphotoxin-alpha
- HD
healthy donor
- CNS
central nervous system
- VLA-4
very late antigen-4
- CSF
cerebrospinal fluid
- EAE
experimental autoimmune encephalomyelitis
- APC
antigen presenting cell
- HEL
hen egg lysozyme
- IFN-γ
interferon-gamma
- PB
peripheral blood
- TT
tetanus toxoid
- MBP
myelin basic protein
- MOG
myelin oligodendrocyte glycoprotein
- GA
glatiramer acetate
- MFI
mean fluorescence intensity
Footnotes
Conflict of interest The authors declare no financial or commercial conflict of interest.
REFERENCES
- 1.Hauser SL, Waubant E, Arnold DL, Vollmer T, Antel J, Fox RJ, Bar-Or A, Panzara M, Sarkar N, Agarwal S, Langer-Gould A, Smith CH. B-cell depletion with rituximab in relapsing-remitting multiple sclerosis. N Engl J Med. 2008;358:676–688. doi: 10.1056/NEJMoa0706383. [DOI] [PubMed] [Google Scholar]
- 2.Bar-Or A, Fawaz L, Fan B, Darlington PJ, Rieger A, Ghorayeb C, Calabresi PA, Waubant E, Hauser SL, Zhang J, Smith CH. Abnormal B-cell cytokine responses a trigger of T-cell-mediated disease in MS? Ann Neurol. 67:452–461. doi: 10.1002/ana.21939. [DOI] [PubMed] [Google Scholar]
- 3.Stuve O, Leussink VI, Frohlich R, Hemmer B, Hartung HP, Menge T, Kieseier BC. Long-term B-lymphocyte depletion with rituximab in patients with relapsing-remitting multiple sclerosis. Arch Neurol. 2009;66:259–261. doi: 10.1001/archneurol.2008.551. [DOI] [PubMed] [Google Scholar]
- 4.Krumbholz M, Meinl I, Kumpfel T, Hohlfeld R, Meinl E. Natalizumab disproportionately increases circulating pre-B and B cells in multiple sclerosis. Neurology. 2008;71:1350–1354. doi: 10.1212/01.wnl.0000327671.91357.96. [DOI] [PubMed] [Google Scholar]
- 5.Gray D, Gray M, Barr T. Innate responses of B cells. Eur J Immunol. 2007;37:3304–3310. doi: 10.1002/eji.200737728. [DOI] [PubMed] [Google Scholar]
- 6.Martin F, Chan AC. B cell immunobiology in disease: evolving concepts from the clinic. Annu Rev Immunol. 2006;24:467–496. doi: 10.1146/annurev.immunol.24.021605.090517. [DOI] [PubMed] [Google Scholar]
- 7.Shlomchik MJ, Craft JE, Mamula MJ. From T to B and back again: positive feedback in systemic autoimmune disease. Nat Rev Immunol. 2001;1:147–153. doi: 10.1038/35100573. [DOI] [PubMed] [Google Scholar]
- 8.Cross AH, Stark JL, Lauber J, Ramsbottom MJ, Lyons JA. Rituximab reduces B cells and T cells in cerebrospinal fluid of multiple sclerosis patients. J Neuroimmunol. 2006;180:63–70. doi: 10.1016/j.jneuroim.2006.06.029. [DOI] [PMC free article] [PubMed] [Google Scholar]
- 9.Martin Mdel P, Cravens PD, Winger R, Kieseier BC, Cepok S, Eagar TN, Zamvil SS, Weber MS, Frohman EM, Kleinschmidt-Demasters BK, Montine TJ, Hemmer B, Marra CM, Stuve O. Depletion of B lymphocytes from cerebral perivascular spaces by rituximab. Arch Neurol. 2009;66:1016–1020. doi: 10.1001/archneurol.2009.157. [DOI] [PubMed] [Google Scholar]
- 10.Matsushita T, Yanaba K, Bouaziz JD, Fujimoto M, Tedder TF. Regulatory B cells inhibit EAE initiation in mice while other B cells promote disease progression. J Clin Invest. 2008;118:3420–3430. doi: 10.1172/JCI36030. [DOI] [PMC free article] [PubMed] [Google Scholar]
- 11.Pranzatelli MR, Tate ED, Travelstead AL, Colliver JA. Long-Term Cerebrospinal Fluid and Blood Lymphocyte Dynamics After Rituximab for Pediatric Opsoclonus-Myoclonus. J Clin Immunol. 2009 doi: 10.1007/s10875-009-9335-3. [DOI] [PubMed] [Google Scholar]
- 12.Fuchs EJ, Matzinger P. B cells turn off virgin but not memory T cells. Science. 1992;258:1156–1159. doi: 10.1126/science.1439825. [DOI] [PubMed] [Google Scholar]
- 13.Chen LC, Delgado JC, Jensen PE, Chen X. Direct expansion of human allospecific FoxP3+CD4+ regulatory T cells with allogeneic B cells for therapeutic application. J Immunol. 2009;183:4094–4102. doi: 10.4049/jimmunol.0901081. [DOI] [PubMed] [Google Scholar]
- 14.Eynon EE, Parker DC. Small B cells as antigen-presenting cells in the induction of tolerance to soluble protein antigens. J Exp Med. 1992;175:131–138. doi: 10.1084/jem.175.1.131. [DOI] [PMC free article] [PubMed] [Google Scholar]
- 15.Reichardt P, Dornbach B, Rong S, Beissert S, Gueler F, Loser K, Gunzer M. Naive B cells generate regulatory T cells in the presence of a mature immunologic synapse. Blood. 2007;110:1519–1529. doi: 10.1182/blood-2006-10-053793. [DOI] [PubMed] [Google Scholar]
- 16.Attanavanich K, Kearney JF. Marginal zone, but not follicular B cells, are potent activators of naive CD4 T cells. J Immunol. 2004;172:803–811. doi: 10.4049/jimmunol.172.2.803. [DOI] [PubMed] [Google Scholar]
- 17.Corinti S, Medaglini D, Prezzi C, Cavani A, Pozzi G, Girolomoni G. Human dendritic cells are superior to B cells at presenting a major histocompatibility complex class II-restricted heterologous antigen expressed on recombinant Streptococcus gordonii. Infect Immun. 2000;68:1879–1883. doi: 10.1128/iai.68.4.1879-1883.2000. [DOI] [PMC free article] [PubMed] [Google Scholar]
- 18.Good KL, Avery DT, Tangye SG. Resting human memory B cells are intrinsically programmed for enhanced survival and responsiveness to diverse stimuli compared to naive B cells. J Immunol. 2009;182:890–901. doi: 10.4049/jimmunol.182.2.890. [DOI] [PubMed] [Google Scholar]
- 19.Bar-Or A, Oliveira EM, Anderson DE, Krieger JI, Duddy M, O’Connor KC, Hafler DA. Immunological memory: contribution of memory B cells expressing costimulatory molecules in the resting state. J Immunol. 2001;167:5669–5677. doi: 10.4049/jimmunol.167.10.5669. [DOI] [PubMed] [Google Scholar]
- 20.Duddy M, Niino M, Adatia F, Hebert S, Freedman M, Atkins H, Kim HJ, Bar-Or A. Distinct effector cytokine profiles of memory and naive human B cell subsets and implication in multiple sclerosis. J Immunol. 2007;178:6092–6099. doi: 10.4049/jimmunol.178.10.6092. [DOI] [PubMed] [Google Scholar]
- 21.Niino M, Hirotani M, Miyazaki Y, Sasaki H. Memory and naive B-cell subsets in patients with multiple sclerosis. Neurosci Lett. 2009;464:74–78. doi: 10.1016/j.neulet.2009.08.010. [DOI] [PubMed] [Google Scholar]
- 22.Cepok S, Rosche B, Grummel V, Vogel F, Zhou D, Sayn J, Sommer N, Hartung HP, Hemmer B. Short-lived plasma blasts are the main B cell effector subset during the course of multiple sclerosis. Brain. 2005;128:1667–1676. doi: 10.1093/brain/awh486. [DOI] [PubMed] [Google Scholar]
- 23.Harp C, Lee J, Lambracht-Washington D, Cameron E, Olsen G, Frohman E, Racke M, Monson N. Cerebrospinal fluid B cells from multiple sclerosis patients are subject to normal germinal center selection. J Neuroimmunol. 2007;183:189–199. doi: 10.1016/j.jneuroim.2006.10.020. [DOI] [PMC free article] [PubMed] [Google Scholar]
- 24.Hansen A, Odendahl M, Reiter K, Jacobi AM, Feist E, Scholze J, Burmester GR, Lipsky PE, Dorner T. Diminished peripheral blood memory B cells and accumulation of memory B cells in the salivary glands of patients with Sjogren’s syndrome. Arthritis Rheum. 2002;46:2160–2171. doi: 10.1002/art.10445. [DOI] [PubMed] [Google Scholar]
- 25.Genc K, Dona DL, Reder AT. Increased CD80(+) B cells in active multiple sclerosis and reversal by interferon beta-1b therapy. J Clin Invest. 1997;99:2664–2671. doi: 10.1172/JCI119455. [DOI] [PMC free article] [PubMed] [Google Scholar]
- 26.Harp CT, Lovett-Racke AE, Racke MK, Frohman EM, Monson NL. Impact of myelin-specific antigen presenting B cells on T cell activation in multiple sclerosis. Clin Immunol. 2008;128:382–391. doi: 10.1016/j.clim.2008.05.002. [DOI] [PubMed] [Google Scholar]
- 27.Suen WE, Bergman CM, Hjelmstrom P, Ruddle NH. A critical role for lymphotoxin in experimental allergic encephalomyelitis. J Exp Med. 1997;186:1233–1240. doi: 10.1084/jem.186.8.1233. [DOI] [PMC free article] [PubMed] [Google Scholar]
- 28.Taga K, Tosato G. IL-10 inhibits human T cell proliferation and IL-2 production. J Immunol. 1992;148:1143–1148. [PubMed] [Google Scholar]
- 29.Correale J, Farez M, Razzitte G. Helminth infections associated with multiple sclerosis induce regulatory B cells. Ann Neurol. 2008;64:187–199. doi: 10.1002/ana.21438. [DOI] [PubMed] [Google Scholar]
- 30.Dhib-Jalbut S. Glatiramer acetate (Copaxone) therapy for multiple sclerosis. Pharmacol Ther. 2003;98:245–255. doi: 10.1016/s0163-7258(03)00036-6. [DOI] [PubMed] [Google Scholar]
- 31.Barth H, Berg PA, Klein R. Methods for the in vitro determination of an individual disposition towards TH1- or TH2-reactivity by the application of appropriate stimulatory antigens. Clin Exp Immunol. 2003;134:78–85. doi: 10.1046/j.1365-2249.2003.02265.x. [DOI] [PMC free article] [PubMed] [Google Scholar]
- 32.Lenarczyk A, Helsloot J, Farmer K, Peters L, Sturgess A, Kirkham B. Antigen-induced IL-17 response in the peripheral blood mononuclear cells (PBMC) of healthy controls. Clin Exp Immunol. 2000;122:41–48. doi: 10.1046/j.1365-2249.2000.01328.x. [DOI] [PMC free article] [PubMed] [Google Scholar]
- 33.Duda PW, Krieger JI, Schmied MC, Balentine C, Hafler DA. Human and murine CD4 T cell reactivity to a complex antigen: recognition of the synthetic random polypeptide glatiramer acetate. J Immunol. 2000;165:7300–7307. doi: 10.4049/jimmunol.165.12.7300. [DOI] [PubMed] [Google Scholar]
- 34.Sun J, Link H, Olsson T, Xiao BG, Andersson G, Ekre HP, Linington C, Diener P. T and B cell responses to myelin-oligodendrocyte glycoprotein in multiple sclerosis. J Immunol. 1991;146:1490–1495. [PubMed] [Google Scholar]
- 35.Julius MH, Masuda T, Herzenberg LA. Demonstration that antigen-binding cells are precursors of antibody-producing cells after purification with a fluorescence-activated cell sorter. Proc Natl Acad Sci U S A. 1972;69:1934–1938. doi: 10.1073/pnas.69.7.1934. [DOI] [PMC free article] [PubMed] [Google Scholar]
- 36.Pistoia V. Production of cytokines by human B cells in health and disease. Immunol Today. 1997;18:343–350. doi: 10.1016/s0167-5699(97)01080-3. [DOI] [PubMed] [Google Scholar]
- 37.Lindert RB, Haase CG, Brehm U, Linington C, Wekerle H, Hohlfeld R. Multiple sclerosis: B- and T-cell responses to the extracellular domain of the myelin oligodendrocyte glycoprotein. Brain. 1999;122(Pt 11):2089–2100. doi: 10.1093/brain/122.11.2089. [DOI] [PubMed] [Google Scholar]
- 38.Lovett-Racke AE, Trotter JL, Lauber J, Perrin PJ, June CH, Racke MK. Decreased dependence of myelin basic protein-reactive T cells on CD28-mediated costimulation in multiple sclerosis patients. A marker of activated/memory T cells. J Clin Invest. 1998;101:725–730. doi: 10.1172/JCI1528. [DOI] [PMC free article] [PubMed] [Google Scholar]
- 39.Hellings N, Baree M, Verhoeven C, D’Hooghe M,B, Medaer R, Bernard CC, Raus J, Stinissen P. T-cell reactivity to multiple myelin antigens in multiple sclerosis patients and healthy controls. J Neurosci Res. 2001;63:290–302. doi: 10.1002/1097-4547(20010201)63:3<290::AID-JNR1023>3.0.CO;2-4. [DOI] [PubMed] [Google Scholar]
- 40.de Rosbo N. Kerlero, Milo R, Lees MB, Burger D, Bernard CC, Ben-Nun A. Reactivity to myelin antigens in multiple sclerosis. Peripheral blood lymphocytes respond predominantly to myelin oligodendrocyte glycoprotein. J Clin Invest. 1993;92:2602–2608. doi: 10.1172/JCI116875. [DOI] [PMC free article] [PubMed] [Google Scholar]
- 41.de Rosbo N. Kerlero, Hoffman M, Mendel I, Yust I, Kaye J, Bakimer R, Flechter S, Abramsky O, Milo R, Karni A, Ben-Nun A. Predominance of the autoimmune response to myelin oligodendrocyte glycoprotein (MOG) in multiple sclerosis: reactivity to the extracellular domain of MOG is directed against three main regions. Eur J Immunol. 1997;27:3059–3069. doi: 10.1002/eji.1830271144. [DOI] [PubMed] [Google Scholar]
- 42.Scholz C, Patton KT, Anderson DE, Freeman GJ, Hafler DA. Expansion of autoreactive T cells in multiple sclerosis is independent of exogenous B7 costimulation. J Immunol. 1998;160:1532–1538. [PubMed] [Google Scholar]
- 43.Putheti P, Soderstrom M, Link H, Huang YM. Effect of glatiramer acetate (Copaxone) on CD4+CD25high T regulatory cells and their IL-10 production in multiple sclerosis. J Neuroimmunol. 2003;144:125–131. doi: 10.1016/j.jneuroim.2003.08.001. [DOI] [PubMed] [Google Scholar]
- 44.Haas J, Korporal M, Balint B, Fritzsching B, Schwarz A, Wildemann B. Glatiramer acetate improves regulatory T-cell function by expansion of naive CD4(+)CD25(+)FOXP3(+)CD31(+) T-cells in patients with multiple sclerosis. J Neuroimmunol. 2009;216:113–117. doi: 10.1016/j.jneuroim.2009.06.011. [DOI] [PubMed] [Google Scholar]
- 45.Mikulkova Z, Praksova P, Stourac P, Bednarik J, Strajtova L, Pacasova R, Belobradkova J, Dite P, Michalek J. Numerical defects in CD8+CD28− T-suppressor lymphocyte population in patients with type 1 diabetes mellitus and multiple sclerosis. Cell Immunol. 262:75–79. doi: 10.1016/j.cellimm.2010.02.002. [DOI] [PubMed] [Google Scholar]
- 46.Correale J, Villa A. Role of CD8+ CD25+ Foxp3+ regulatory T cells in multiple sclerosis. Ann Neurol. 67:625–638. doi: 10.1002/ana.21944. [DOI] [PubMed] [Google Scholar]
- 47.Zang YC, Li S, Rivera VM, Hong J, Robinson RR, Breitbach WT, Killian J, Zhang JZ. Increased CD8+ cytotoxic T cell responses to myelin basic protein in multiple sclerosis. J Immunol. 2004;172:5120–5127. doi: 10.4049/jimmunol.172.8.5120. [DOI] [PubMed] [Google Scholar]
- 48.Wei C, Anolik J, Cappione A, Zheng B, Pugh-Bernard A, Brooks J, Lee EH, Milner EC, Sanz I. A new population of cells lacking expression of CD27 represents a notable component of the B cell memory compartment in systemic lupus erythematosus. J Immunol. 2007;178:6624–6633. doi: 10.4049/jimmunol.178.10.6624. [DOI] [PubMed] [Google Scholar]
- 49.Barth H, Klein R, Berg PA, Wiedenmann B, Hopf U, Berg T. Analysis of the effect of IL-12 therapy on immunoregulatory T-cell subsets in patients with chronic hepatitis C infection. Hepatogastroenterology. 2003;50:201–206. [PubMed] [Google Scholar]
- 50.Davis LS, Schulze-Koops H, Lipsky PE. Human CD4+ T cell differentiation and effector function: implications for autoimmunity. Immunol Res. 1999;19:25–34. doi: 10.1007/BF02786474. [DOI] [PubMed] [Google Scholar]
- 51.Rivino L, Messi M, Jarrossay D, Lanzavecchia A, Sallusto F, Geginat J. Chemokine receptor expression identifies Pre-T helper (Th)1, Pre-Th2, and nonpolarized cells among human CD4+ central memory T cells. J Exp Med. 2004;200:725–735. doi: 10.1084/jem.20040774. [DOI] [PMC free article] [PubMed] [Google Scholar]
- 52.Moldovan IR, Cotleur AC, Zamor N, Butler RS, Pelfrey CM. Multiple sclerosis patients show sexual dimorphism in cytokine responses to myelin antigens. J Neuroimmunol. 2008;193:161–169. doi: 10.1016/j.jneuroim.2007.10.010. [DOI] [PMC free article] [PubMed] [Google Scholar]
- 53.Duda PW, Schmied MC, Cook SL, Krieger JI, Hafler DA. Glatiramer acetate (Copaxone) induces degenerate, Th2-polarized immune responses in patients with multiple sclerosis. J Clin Invest. 2000;105:967–976. doi: 10.1172/JCI8970. [DOI] [PMC free article] [PubMed] [Google Scholar]
- 54.Neuhaus O, Farina C, Yassouridis A, Wiendl H, Bergh F. Then, Dose T, Wekerle H, Hohlfeld R. Multiple sclerosis: comparison of copolymer-1- reactive T cell lines from treated and untreated subjects reveals cytokine shift from T helper 1 to T helper 2 cells. Proc Natl Acad Sci U S A. 2000;97:7452–7457. doi: 10.1073/pnas.97.13.7452. [DOI] [PMC free article] [PubMed] [Google Scholar]
- 55.Fridkis-Hareli M, Teitelbaum D, Gurevich E, Pecht I, Brautbar C, Kwon OJ, Brenner T, Arnon R, Sela M. Direct binding of myelin basic protein and synthetic copolymer 1 to class II major histocompatibility complex molecules on living antigen-presenting cells--specificity and promiscuity. Proc Natl Acad Sci U S A. 1994;91:4872–4876. doi: 10.1073/pnas.91.11.4872. [DOI] [PMC free article] [PubMed] [Google Scholar]
- 56.Reindl M, Linington C, Brehm U, Egg R, Dilitz E, Deisenhammer F, Poewe W, Berger T. Antibodies against the myelin oligodendrocyte glycoprotein and the myelin basic protein in multiple sclerosis and other neurological diseases: a comparative study. Brain. 1999;122(Pt 11):2047–2056. doi: 10.1093/brain/122.11.2047. [DOI] [PubMed] [Google Scholar]
- 57.Guggenmos J, Schubart AS, Ogg S, Andersson M, Olsson T, Mather IH, Linington C. Antibody cross-reactivity between myelin oligodendrocyte glycoprotein and the milk protein butyrophilin in multiple sclerosis. J Immunol. 2004;172:661–668. doi: 10.4049/jimmunol.172.1.661. [DOI] [PubMed] [Google Scholar]
- 58.Litzenburger T, Bluthmann H, Morales P, Pham-Dinh D, Dautigny A, Wekerle H, Iglesias A. Development of myelin oligodendrocyte glycoprotein autoreactive transgenic B lymphocytes: receptor editing in vivo after encounter of a self-antigen distinct from myelin oligodendrocyte glycoprotein. J Immunol. 2000;165:5360–5366. doi: 10.4049/jimmunol.165.9.5360. [DOI] [PubMed] [Google Scholar]
- 59.Vollmer J, Tluk S, Schmitz C, Hamm S, Jurk M, Forsbach A, Akira S, Kelly KM, Reeves WH, Bauer S, Krieg AM. Immune stimulation mediated by autoantigen binding sites within small nuclear RNAs involves Toll-like receptors 7 and 8. J Exp Med. 2005;202:1575–1585. doi: 10.1084/jem.20051696. [DOI] [PMC free article] [PubMed] [Google Scholar]
- 60.Wardemann H, Yurasov S, Schaefer A, Young JW, Meffre E, Nussenzweig MC. Predominant autoantibody production by early human B cell precursors. Science. 2003;301:1374–1377. doi: 10.1126/science.1086907. [DOI] [PubMed] [Google Scholar]
- 61.Cappione A, 3rd, Anolik JH, Pugh-Bernard A, Barnard J, Dutcher P, Silverman G, Sanz I. Germinal center exclusion of autoreactive B cells is defective in human systemic lupus erythematosus. J Clin Invest. 2005;115:3205–3216. doi: 10.1172/JCI24179. [DOI] [PMC free article] [PubMed] [Google Scholar]
- 62.Ekland EH, Forster R, Lipp M, Cyster JG. Requirements for follicular exclusion and competitive elimination of autoantigen-binding B cells. J Immunol. 2004;172:4700–4708. doi: 10.4049/jimmunol.172.8.4700. [DOI] [PubMed] [Google Scholar]
- 63.Guay HM, Larkin J, 3rd, Picca CC, Panarey L, Caton AJ. Spontaneous autoreactive memory B cell formation driven by a high frequency of autoreactive CD4+ T cells. J Immunol. 2007;178:4793–4802. doi: 10.4049/jimmunol.178.8.4793. [DOI] [PubMed] [Google Scholar]
- 64.Pugh-Bernard AE, Silverman GJ, Cappione AJ, Villano ME, Ryan DH, Insel RA, Sanz I. Regulation of inherently autoreactive VH4-34 B cells in the maintenance of human B cell tolerance. J Clin Invest. 2001;108:1061–1070. doi: 10.1172/JCI12462. [DOI] [PMC free article] [PubMed] [Google Scholar]
- 65.Beck RW, Chandler DL, Cole SR, Simon JH, Jacobs LD, Kinkel RP, Selhorst JB, Rose JW, Cooper JA, Rice G, Murray TJ, Sandrock AW. Interferon beta-1a for early multiple sclerosis: CHAMPS trial subgroup analyses. Ann Neurol. 2002;51:481–490. doi: 10.1002/ana.10148. [DOI] [PubMed] [Google Scholar]
- 66.Schultze JL, Cardoso AA, Freeman GJ, Seamon MJ, Daley J, Pinkus GS, Gribben JG, Nadler LM. Follicular lymphomas can be induced to present alloantigen efficiently: a conceptual model to improve their tumor immunogenicity. Proc Natl Acad Sci U S A. 1995;92:8200–8204. doi: 10.1073/pnas.92.18.8200. [DOI] [PMC free article] [PubMed] [Google Scholar]
- 67.Crawford MP, Yan SX, Ortega SB, Mehta RS, Hewitt RE, Price DA, Stastny P, Douek DC, Koup RA, Racke MK, Karandikar NJ. High prevalence of autoreactive, neuroantigen-specific CD8+ T cells in multiple sclerosis revealed by novel flow cytometric assay. Blood. 2004;103:4222–4231. doi: 10.1182/blood-2003-11-4025. [DOI] [PubMed] [Google Scholar]
- 68.Scott DW. Antifluorescein affinity columns. Isolation and immunocompetence of lymphocytes that bind fluoresceinated antigens in vivo or in vitro. J Exp Med. 1976;144:69–78. doi: 10.1084/jem.144.1.69. [DOI] [PMC free article] [PubMed] [Google Scholar]
- 69.Moody MA, Haynes BF. Antigen-specific B cell detection reagents: use and quality control. Cytometry A. 2008;73:1086–1092. doi: 10.1002/cyto.a.20599. [DOI] [PMC free article] [PubMed] [Google Scholar]
- 70.Kurtzke JF. Rating neurologic impairment in multiple sclerosis: an expanded disability status scale (EDSS) Neurology. 1983;33:1444–1452. doi: 10.1212/wnl.33.11.1444. [DOI] [PubMed] [Google Scholar]
Associated Data
This section collects any data citations, data availability statements, or supplementary materials included in this article.