

Abstract
The scarcity of empirically supported explanations for the Black/White prevalence difference in depression in the U.S. is a conspicuous gap in the literature. Recent evidence suggests that the paradoxical observation of decreased risk of depression but elevated rates of physical illness among Blacks in the U.S. compared with Whites may be accounted for by the use of coping behaviors (e.g., alcohol and nicotine consumption, overeating) among Blacks exposed to high stress levels. Such coping behaviors may mitigate deleterious effects of stressful exposures on mental health while increasing the risk of physical ailments. The racial patterning in mental and physical health outcomes could therefore be explained by this mechanism if a) these behaviors were more prevalent among Blacks than Whites and/or b) the effect of these behavioral responses to stress was differential by race. The present study challenges this hypothesis using longitudinal, nationally-representative data with comprehensive DSM-IV diagnoses. Data are drawn from 34,653 individuals sampled in Waves 1 (2001-2002) and 2 (2004-2005) as part of the US National Epidemiologic Survey on Alcohol and Related Conditions. Results showed that a) Blacks were less likely to engage in alcohol or nicotine consumption at low, moderate, and high levels of stress compared to Whites, and b) there was a significant three-way interaction between race, stress, and coping behavior for BMI only (F=2.11, df=12, p=0.03), but, contrary to the hypothesis, elevated BMI was protective against depression in Blacks at low, not high, levels of stress. Further, engagement in unhealthy behaviors, especially at pathological levels, did not protect against depression in Blacks or in Whites. In sum, the impact of stress and coping processes on depression do not appear to operate differently in Blacks versus Whites. Further research testing innovative hypotheses that would explain the difference in Black/White depression prevalence is warranted.
Keywords: race, depression, mental health, alcohol, obesity, socioeconomic position, African Americans, USA, stress
Introduction
Epidemiologic studies have consistently documented that Blacks living in the United States have higher rates of physical illness such as hypertension and diabetes, and higher rates of mortality, compared with non-Hispanic Whites controlling for indicators of socio-economic position (SEP) (Heckler 1985; McCord and Freeman 1990; Williams and Jackson 2005). Conversely, major psychiatric epidemiologic household surveys have reported that Blacks have equal or lower rates of most psychiatric disorders, including major depression (Kessler, McGonagle et al. 1994; Hasin, Goodwin et al. 2005; Breslau, Aguilar-Gaxiola et al. 2006; Williams, Gonzalez et al. 2007). These divergent patterns for mental and physical health outcomes have been termed a ‘paradox’ (Williams 2001). Blacks in the U.S. face historic and contemporary institutionalized discrimination which exposes them to disadvantaged SEP, worse living conditions, and greater stress and adversity due to marginalized social status (Kessler, Mickelson et al. 1999; Kreiger 2000; Williams and Williams-Morris 2000), all of which seemingly place Blacks at greater risk for depression compared with Whites (Dohrenwend 2000). Indeed, among Blacks in the U.S., perception of discrimination and adversity due to race is associated with greater psychological distress and depressive symptoms (Kessler, Mickelson et al. 1999; Williams and Williams-Morris 2000). However, absolute rates of depression remain lower among Blacks compared with Whites.
Many pathways have been posited to explain the elevated rates of physical health problems among Blacks in the U.S. compared with Whites. One well-studied mechanism is stress associated with disadvantaged social status. The physiologic responses to stress via allostatic load have been hypothesized to influence health by a process of ‘wear and tear’ whereby the body can no longer effectively regulate itself (McEwen 2000; McEwen 2004). “Weathering” (Geronimus 1994; Geronimus 1996), which describes a process of accelerated aging as an effect of the cumulative experience of stress and adversity, has been hypothesized to explain why Blacks have lower birthweights as well as higher mortality at younger ages than Whites after controlling for SEP. Further, interpersonal discrimination appraised by the individual as negative can result in fear, anger, and denial, thereby inducing injurious physiologic responses in cardiovascular, endocrine, neurologic and immune systems (Krieger 1990; Krieger and Sidney 1996; Kreiger 2000). Adverse neighborhood conditions, to which Blacks have greater exposure than Whites, can influence health through inadequate access to social and health services, exposures to health hazards, and reduction in social cohesion and connectedness (Massey 1985; Massey 2004). Greater stress, worse bodily wear and tear, reduced access to medical services, and greater exposure to deleterious neighborhood conditions are all risk factors for depression (Leonard 2000; McEwen 2003; Stansfeld 2005), and yet Blacks consistently generate estimates of depression below those of Whites; this poses a perplexing, unresolved issue for social and psychiatric epidemiology.
Two methodological hypotheses advanced to explain this mental/physical health paradox posit that rates of depression among Blacks are underestimated in major psychiatric epidemiologic studies due to selection bias and measurement error. The selection bias hypothesis reflects the fact that all major psychiatric epidemiologic surveys conducted in the U.S. exclude institutionalized populations. Young Black men in the U.S. are overrepresented in prison and jail populations (Petit and Western 2004), where depression is more prevalent compared with household populations (Teplin 1990; Teplin, Abram et al. 1996). Thus, the underestimation of depression prevalence in household samples could affect Blacks to a greater extent compared with Whites, though the effect of this bias would primarily be age- and gender-specific. The measurement error hypothesis suggests potential diagnostic bias in the major survey instruments used to capture depression. Given the same symptom presentation, Blacks interviewed by clinicians in unstructured or semi-structured formats are more likely to be diagnosed as having a disorder in the psychotic spectrum and Whites as having a disorder in the mood spectrum (Neighbors, Trierweiler et al. 1999; Neighbors, Trierweiler et al. 2003; Strakowski, Keck et al. 2003). Additionally, some argue that depression may manifest differently in Blacks compared with Whites, and current diagnostic nosology more appropriately captures depression in Whites compared with Blacks (Rogler 1999; Baker 2001; Brown 2003; Kleinman 2004). Available data suggest that while these hypotheses may explain some of the Black/White difference in depression, methodological issues cannot account for the all of the difference (Williams, Gonzalez et al. 2007; Breslau, Javaras et al. 2008). Thus, hypotheses exploring alternative mechanisms through which Blacks may have a lower prevalence of depression compared with Whites remain necessary.
In contrast to methodological hypotheses explaining the mental/physical health ‘paradox’, a recently advanced alternative hypothesis is that the patterning in physical and mental health outcomes in Blacks versus Whites arises from mechanisms for coping with stressors that on average operate differently for Black and White Americans (Jackson and Knight 2006; Jackson, Knight et al. 2009). Jackson and colleagues have argued that Blacks in the U.S. face greater, and unique, stressors compared with Whites, and that strategies deployed to cope emotionally with this increased stress may protect mental health while having deleterious consequences for physical health. Recently, Jackson and colleagues reported that at high levels of stress, Blacks with elevated body mass index (BMI) and/or who smoke cigarettes and/or drink alcohol (collectively termed ‘unhealthy behaviors’ or ‘UHBs’ (Jackson, Knight et al. 2009)) were less likely than Blacks not engaging in these behaviors to develop depression, whereas the pattern trended in the opposite direction for Whites (Jackson, Knight et al. 2009). Further empirical support for this hypothesis was recently reported using data from the Baltimore Epidemiologic Catchment Area Study (Mezuk, Rafferty et al. 2010). Evidence indicates that UHBs can ameliorate immediate anxiety and depressive symptoms in response to stressful experiences by regulating corticotropin-releasing factor in the hypothalamic-pituitary-adrenalcortical (HPA) axis (Benowitz 1988; Koob, Roberts et al. 1998; Dallman, Pecoraro et al. 2003). However, long-term heavy alcohol consumption, smoking, and high BMI can lead to a cascade of physical health consequences. This hypothesis suggests that, in the context of chronic stress, Blacks’ engagement in UHBs may serve to buffer the deleterious consequences of stress on depression through the HPA pathway, leading to a lower prevalence of depression but a greater prevalence of physical health problems than would have otherwise occurred. This hypothesis also suggests that the same processes operate differently or with different consequences in Whites. In the interest of brevity, we refer to these potentially differential patterns in the relationships between stress, coping, and depression between Blacks and Whites as “group-specific,” meaning that they arise from the unequal distribution of exposures and coping resources engendered by a racialized environment, rather than differences embedded in the individual.
Differences in stress and coping processes between Blacks and Whites could account for the mental/physical health ‘paradox’ under two scenarios. (1) UHBs are indeed protective against depression, among both Blacks and Whites, but Blacks are much more likely to engage in them compared with Whites at a given level of stress. This is unlikely in light of previous epidemiologic evidence suggesting that a) substance disorders and obesity are comorbid with depression (Reiger, Farmer et al. 1990; Kessler, Crum et al. 1997; Hasin, Goodwin et al. 2005) and b) Blacks are less likely than Whites to engage in alcohol and nicotine consumption (Grant, Hasin et al. 2004; Hasin, Stinson et al. 2007). However, patterns of comorbidity and Black/White differences in depression at all levels of stress have not been investigated systematically. (2) UHBs operate differentially by race, whereby they protect against depression to a greater extent among Blacks compared with Whites (either overall or variably by level of stress). This hypothesis is supported by data from the Americans’ Changing Lives Survey (Jackson, Knight et al. 2009) and the Baltimore Epidemiologic Catchment Area Study (Mezuk, Rafferty et al. 2010), as described above.
We propose to comprehensively investigate each of the above scenarios in a large nationally representative prospective study of U.S. adults. The present study is intended to both replicate and extend the analyses presented in Jackson et al. (2009) to provide a comprehensive test of the underlying theory. Using the National Epidemiologic Survey on Alcohol and Related Conditions (NESARC) we accomplish five main aims. First, we construct as exact a replication as possible of Jackson et al. (2009) in order to provide a baseline for comparison and from which to broaden the analyses. The remaining four aims systematically test the theory underlying the two scenarios outlined above. We examine whether alcohol consumption, nicotine consumption, and body mass index (as a proxy for overeating, consistent with Jackson et al., (2009)) are prospectively protective against depression; we examine whether Blacks engage in more of these behaviors than Whites at low, moderate, and/or high levels of stress; and we test the hypothesis that Blacks exposed to high levels of stress are protected against depression if engaged in UHBs at the time of the stressors and, simultaneously, that Whites are not similarly conferred such protection from these behaviors. Finally, the hypothesis outlined by Jackson et al. (2009) suggests that the stress exposure of Blacks is qualitatively different compared to that of Whites. The NESARC data allows us to examine a measure of perceived racial discrimination in order to test whether Blacks who report high levels of discrimination and engage in UHBs have less depression than Blacks who report high levels of discrimination and do not engage in UHBs.
The data used in the present study have distinct advantages over those in (Jackson, Knight et al. 2009): namely a larger sample size, DSM-IV diagnoses of major depression at two time points, DSM-IV diagnoses of nicotine dependence and alcohol use disorders, and comprehensive measures of nicotine, alcohol consumption, and stressful life events. Extending the analyses of Jackson et al, (2009) to include pathological alcohol and nicotine consumption is important in testing the hypothesis, as high and chronic levels of nicotine and alcohol use are behaviors most associated with poor physical health outcomes; if the Black/White “paradox” can be attributed to discrepant mental and physical health consequences of unhealthy behaviors, the nature and degree of engagement in those behaviors most implicated in poor somatic health should be considered.
Methods
Sample
Data are drawn from the National Epidemiologic Survey on Alcohol and Related Conditions (NESARC), a two-wave longitudinal survey of adults in the United States residing in households and group quarters. Wave 1 was conducted in 2001-2002 (N=43,093); young adults, Hispanics and Blacks were oversampled, with an overall response rate of 81%. Respondents were re-interviewed for Wave 2 approximately three years after Wave 1, with 34,653 (80.4%) successfully re-interviewed. More information on the study methods is found elsewhere (Grant, Goldstein et al. 2009). The research protocol, including written informed consent procedures, received full ethical review and approval from the U.S. Census Bureau and the U.S. Office of Management and Budget.
Measures
All measures were assessed using the Alcohol Use Disorder and Associated Disabilities Interview Schedule-DSM-IV Version (AUDADIS-IV). We used measures of race/ethnicity, UHBs, and stressful life events ascertained at Wave 1 and measures of the outcomes, major depression and physical illness, from Wave 2. This design established the temporality of the exposures as occurring prior to the outcome; we controlled for major depression at Wave 1 in all analyses for which depression at Wave 2 was an outcome to further establish temporal sequence.
Race/ethnicity
We included self-identified non-Hispanic Whites (N=19,216) and non-Hispanic Blacks (N=6,065) who reported being born in the U.S. Foreign-born Blacks (N=664) and Whites (N=1,264) were excluded from the present analysis because patterns of substance use, depression and stressful life events differ between foreign- and non-foreign born individuals.
‘Unhealthy behaviors’ (UHBs)
We considered three types of ‘UHBs’: alcohol consumption, nicotine consumption, and body mass index (BMI). While a compelling argument can be made regarding the validity of terming alcohol consumption, nicotine consumption, and BMI collectively as ‘UHBs’ (e.g., moderate consumption of alcohol may be cardioprotective (Klatsky 2009)), we have used this terminology to remain consistent with the prior empirical support for the hypothesis we are testing (Jackson, Knight et al. 2009). For our replication analysis, we use definitions exactly consistent with Jackson, Knight et al. (2009), namely a UHB count measure (0-3) indicating if the individual ever consumed at least one alcoholic beverage in their lifetime, ever smoked at least 100+ cigarettes in their lifetime, and whether they currently have a BMI≥30. For our extended test of the overall theory, we used the following definitions:
Alcohol consumption in the past 12-months at Wave 1 was operationalized as a three-level variable: no consumption (N=2,293); non-pathological consumption (i.e., any level of consumption but no alcohol abuse/dependence diagnosis) at levels less than weekly binge (>4 drinks for men or >3 drinks per women on at least one occasion in the past year) (N=13,765); and DSM-IV alcohol abuse/dependence or at least weekly binge drinking (N=8,593). Measurement of alcohol consumption and diagnoses is a particular strength of the AUDADIS-IV instrument; diagnoses are made based on assessment of over 40 symptom items, and the excellent reliability and validity of alcohol diagnosis in the AUDADIS-IV have been extensively documented both the United States and internationally (see Hasin et al., 2007). Limited differential item functioning by race/ethnicity has been noted for alcohol disorder criteria in Item Response Theory analysis (Saha, Chou et al. 2006).
Nicotine consumption in the past 12-months at Wave 1 was operationalized as a three-level variable: no nicotine use (N=18,601); non-pathological use (any level of use but no DSM-IV-defined nicotine dependence diagnosis) (N=3,358); and DSM-IV nicotine dependence (N=3,313). The good reliability and validity of nicotine dependence in the AUDADIS-IV have been well-documented (Grant, Hasin et al. 2004). Limited differential item functioning by race/ethnicity has been noted for nicotine dependence criteria in Item Response Theory analysis (Saha, Compton et al. 2010).
Unhealthy eating in the past 12-months at Wave 1 was operationalized using current BMI based on respondent’s self-reported height and weight. BMI an imperfect proxy for unhealthy eating; BMI is known to be determined by more than simply caloric intake, including exercise patterns and genetic vulnerability (Hetherington and Cecil 2010). However, empirical studies have documented a robust correlation between unhealthy eating and BMI (e.g., (Haimoto, Iwata et al. 2008; Kent and Worsley 2009)). Three categories were created: BMI<25 (N=10,252), BMI greater than or equal to 25 but less than 35 (N=12,615), and BMI≥35 (N=2,414). While conventional cut-points define overweight as BMI between 25 and <30 and obese as ≥30 (Centers for Disease Control and Prevention 2010), we chose more conservative cut points due to known error in the measurement BMI (Rothman 2008), often overestimating an individual’s true body size.
UHB count. The three measures described above were combined to create an overall measure of UHBs, comparable to that in Jackson et al. (2009). Respondents were given a score of 0 for the least severe level of each behavior (i.e., no alcohol consumption, no nicotine consumption, or BMI<25), one point for the moderate level, and two points for the most severe level (i.e., DSM-IV alcohol abuse/dependence or at-least weekly binge drinking, DSM-IV nicotine dependence, or BMI≥35) within each unhealthy behavior category. Based on this summary score, we created a three level variable indicating no unhealthy behaviors (count was equal to zero) (N=2,539), low levels of unhealthy behavior (count was 1, 2, or 3) (N=20,077), and high levels of unhealthy behaviors (count of 4 or more) (N=2,656).
Stressful life events in the past 12-months
Twelve stressful life events were assessed at Wave 1 using a checklist with dichotomous response options: family member or close friend had a serious illness (38.4%), family member or close friend died (32.1%), respondent changed jobs/job responsibilities/work hours (23.8%), moved or someone new came to live with respondent (15.8%), major financial crisis/unable to pay bills/bankruptcy (10.6%), trouble with a boss or co-worker (8.7%), unemployed and looking for work >1 month (7.7%), respondent or family member was the victim of a crime (6.7%), fired or laid off (5.9%), problems with neighbor/friend/relative (5.8%), separated/divorced/broke up (5.4%), and respondent or a family member had trouble with police/got arrested/sent to jail (5.1%).
Figure 1 shows the relationship between number of past year stressful life events, race, and depression. As shown, the number of stressful life events at Wave 1 was not linearly related to depression at Wave 2 among Blacks, though the difference in prevalence between Blacks and Whites was not statistically significantly different at any level of stressful life events save for among those with one stressful life event (p=0.04). Also shown in Figure 1, the confidence intervals for the proportions substantially overlap, indicative of the small sample sizes among those with high levels of stress. Therefore, we created a categorical measure of the number of stressful life events reported by the respondent. We extensively evaluated the appropriate threshold for ‘high stress’, and found that the direction and magnitude of the results were not dependent on the upper cutpoint used. We also evaluated whether the data would fit a quadratic term for past year stressful life events; the results did not change when a quadratic term was used. Therefore, to maximize statistical power and to provide the best fit to these data, we used the following cut points: no stressful life events in the past-year (N=7,274), one or two stressful life events (N=11,832), and three or more (N=6,175). Finer categorizations could not be utilized due to the minimum cell sizes required to conduct large-sample statistics.
Figure 1.
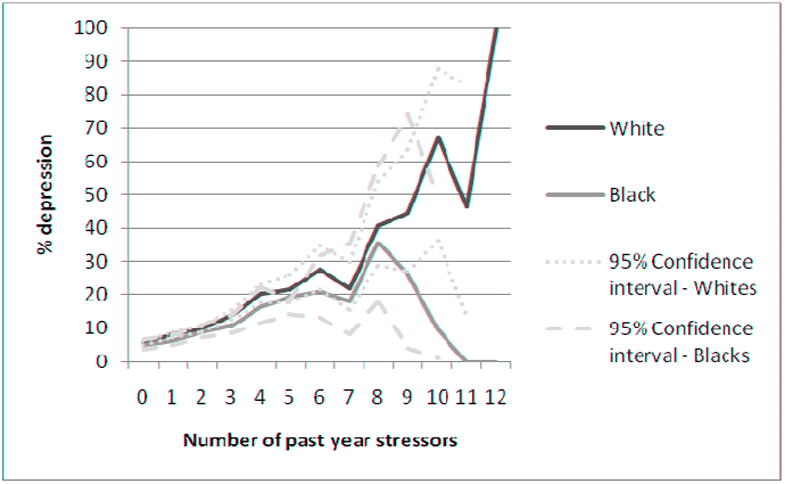
Prevalence of depression at Wave 2 by number of past year stressor among non-Hispanic U.S.-born Whites (N=19,216) and non-Hispanic U.S.-born Blacks (N=6,065) in the general population
Perceived discrimination
Respondents self-reporting Black race were asked at the Wave 2 interview, “How often have you experienced discrimination, been prevented from doing something, or been hassled or made to feel inferior in any of the following situations because of your race?” The frequencies of seven discrimination experiences in the past 12 months were assessed (e.g., obtaining health care or health insurance coverage, obtaining a job or while on the job, or being called a racist name) (Krieger, Smith et al. 2005). The scale showed good internal consistency reliability (α=0.76) (Ruan, Goldstein et al. 2008). Responses were summed and a three-level variable was created indicating: no discriminatory experiences reported (N=3,708), a low level of discriminatory experiences (more than zero but less than the 75th percentile on the scale, N=1,753), and a high level of discriminatory experiences (75th percentile or greater, N=604).
Major Depressive Episode (MDE)
The good reliability and validity of DSM-IV major depression diagnosis in the AUDADIS-IV have been well-documented (Hasin, Goodwin et al. 2005). At Wave 1, major depression in the past 12-months or prior to the past 12-months was assessed; we combined these timeframes to create a W1 lifetime depression diagnosis, and used this variable as a control in all analyses predicting major depression at Wave 2. At Wave 2, major depression was assessed in the past 12-months, and since the last interview but prior to the past 12-months. We combined these times frames to create a W2 depression diagnosis.
Physical illness
We examined Black/White differences in fourteen physical illnesses (e.g., arteriosclerosis, hypertension, diabetes, heart attack, high cholesterol, ulcer) assessed at Wave 2. Physical illness status was based on respondent self-report of a physician diagnosis.
Control variables
In all analyses we also controlled for age, sex, past-year personal income, education, and region of residence as assessed at Wave 1. We also controlled for major depression at prior to the past-year or the past-year Wave 1; Blacks had a lower prevalence of past year (OR=0.80, 95% C.I. 0.66-0.96) and lifetime depression (OR=0.56, 95% C.I. 0.49-0.64) at Wave 1.
Statistical analysis
Prevalence estimates by race, stressful life events, and UHBs were generated using cross-tabulations. Odds ratios and 95% confidence intervals were generated using logistic regression. All interaction tests are on the multiplicative scale. All analyses were conducted using SUDAAN software to adjust standard errors for the non-random probability of selection into the sample. All prevalence estimates and odds ratios are sample weighted to be representative of the U.S. population based on the year 2000 census.
Results
Overall Black/White differences in the NESARC data
Consistent with prior literature, Blacks were less likely to have Wave 2 major depression (OR=0.80, 95% C.I. 0.70-0.91) and more likely to have a Wave 2 physical illness (OR=1.20, 95% C.I. 1.08-1.35) compared with Whites (data not shown).
Results of the Jackson et al. (2009) replication attempt
Our findings did not replicate those of Jackson et al. (2009). Figures 2a and 2b show the predicted probability of depression based on the results of a logistic regression model categorizing UHB consumption (any lifetime smoking, any lifetime drinking, and/or current obesity) and past-year stressful life events, and controlling for age, sex, past-year personal income, education, region of residence, and major depression at Wave 1. Among Whites, the figures indicate a higher predicted probability of depression with each increasing level of UHB consumption and each increasing level of stressful life events. Among Blacks, the pattern is less consistent, but no evidence emerges suggesting that those who engage in more UHB consumption have less depression. There were no significant interactions between stressful life events and UHBs predicting depression among Blacks (F=1.20, df=6, p=0.32) or Whites (F=0.43, df=6, p=0.86), and no significant three-way interaction between stressful life events, UHBs, and race (F=1.05, df=17, p=0.42).
Figure 2.
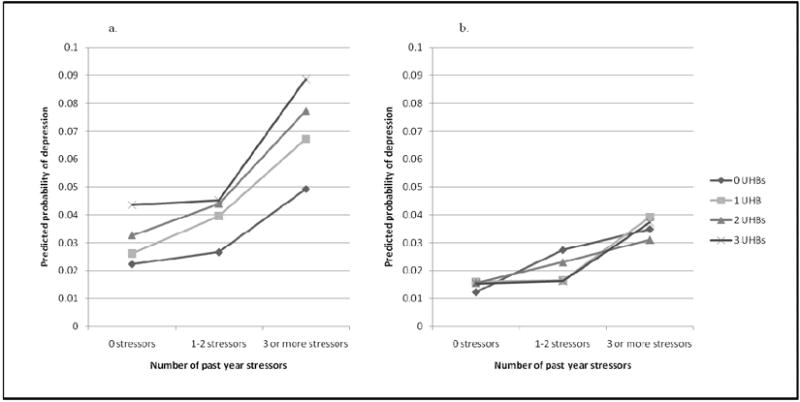
Predicted probability of depression at Wave 2 based on unhealthy behaviors as defined by Jackson et al. (2009)* and past-year stressful life events at Wave 1, by race, among non-Hispanic U.S.-born Whites (Figure 2a, N=19,216) and non-Hispanic U.S.-born Blacks Figure 2b, N=6,065) in the general population
* UHBs defined to be consistent with Jackson et al. (2009): any consumption of at least one alcoholic beverage in lifetime, any consumption of 100+ cigarettes in lifetime, and/or current BMI≥30.
As part of our replication attempt, we also conducted an analysis with a mean centered, continuous stress variable in order to more closely approximate Jackson et al. (2009) and Mezuk et al. (2010), despite the evident violation of the linearity assumption among Blacks (shown in Figure 1). Among Blacks at high levels of mean-centered stress, those with 0 UHBs have a higher predicted probability of depression compared to those with 1 UHB, and those with 1 UHB have a higher predicted probability of depression compared to those with 2 or 3 UHBs (consistent with Jackson et al. (2009) and Mezuk et al. (2010)). The same pattern is not evident among Whites (results not shown). However, this result arises entirely from the misspecification of the regression model by entering stress as a continuous variable among Blacks. Further, none of the interactions were significant when using the mean centered, continuous stress variable (interaction of stress and UHBs among Blacks: F=0.89, df=3, p=0.45; interaction of stress and UHBs among Whites: F=1.46, df=3, p=0.23; three way interaction of stress, UHBs, and race: F=1.37, df=7, p=0.23).
Results of the extended test of the Jackson et al hypothesis
Are UHBs protective against depression and is stress associated with more depression?
We found that Wave 1 UHBs, at any level, are not protective against Wave 2 depression. Stress, however, is prospectively predictive of Wave 2 depression. Table 1 shows the odds of Wave 2 depression given Wave 1 UHBs among the whole sample, and for Blacks and Whites separately. Among Whites, greater Wave 1 alcohol, nicotine, BMI severity, and overall UHB score predicted higher odds of depression at Wave 2. Among Blacks, no significant odds ratios were observed for the relation between Wave 1 UHBs and Wave 2 depression. However, all four odds ratios for the highest UHB category were in the direction consistent with high levels of UHB predicting greater odds of depression. Among both Whites and Blacks, more stressful life events at Wave 1 predicted greater odds of depression at Wave 2 (see Table 1).
Table 1.
Alcohol consumption, nicotine consumption, BMI, and stressful life events prospectively predicting major depression three years later among non-Hispanic U.S.-Born Whites (N=19,216) and non-Hispanic U.S-born Blacks (N=6,065)
| All (N=25281) | Whites (N=19216) | Blacks (N=6065) | |||||||
|---|---|---|---|---|---|---|---|---|---|
| N | % | AOR (95% C.I.) | N | % | AOR (95% C.I.) | N | % | AOR (95% C.I.) | |
| Alcohol consumption | |||||||||
| Alcohol abuse/dependence or at least weekly binge drinking | 2923 | 11.89 | 1.31 (1.10-1.57) | 2361 | 12.06 | 1.33 (1.10-1.61) | 562 | 10.54 | 1.20 (0.77-1.87) |
| Non-pathological drinking | 13765 | 9.79 | 1.01 (0.89-1.13) | 11192 | 9.90 | 1.02 (0.90-1.16) | 2573 | 8.74 | 0.87 (0.67-1.14) |
| Abstention from alcohol | 8593 | 9.64 | 1.00 | 5663 | 9.63 | 1.00 | 2930 | 9.68 | 1.00 |
| Nicotine use | |||||||||
| Nicotine dependence | 3313 | 17.43 | 1.76 (1.52-2.03) | 2689 | 17.88 | 1.80 (1.54-2.11) | 624 | 13.10 | 1.29 (0.90-1.85) |
| Non-pathological nicotine use | 3358 | 9.12 | 1.06 (0.91-1.24) | 2526 | 9.26 | 1.07 (0.90-1.28) | 832 | 8.23 | 0.96 (0.61-1.50) |
| No nicotine use | 18601 | 8.78 | 1.00 | 13995 | 8.73 | 1.00 | 4606 | 9.09 | 1.00 |
| BMI | |||||||||
| ≥35 | 2414 | 14.14 | 1.44 (1.22-1.70) | 1478 | 14.66 | 1.52 (1.26-1.82) | 936 | 12.25 | 1.14 (0.80-1.62) |
| >25-<35 | 12615 | 9.38 | 1.16 (1.03-1.29) | 9349 | 9.54 | 1.19 (1.05-1.34) | 3266 | 8.41 | 0.94 (0.73-1.23) |
| ≤25 | 10252 | 9.89 | 1.00 | 8389 | 9.92 | 1.00 | 1863 | 9.69 | 1.00 |
| Count of unhealthy behaviors | |||||||||
| Four or more | 2539 | 14.97 | 1.96 (1.56-2.48) | 1970 | 15.51 | 2.12 (1.64-2.73) | 569 | 11.09 | 1.16 (0.66-2.02) |
| One to three | 20077 | 9.62 | 1.28 (1.06-1.55) | 15337 | 9.69 | 1.34 (1.09-1.65) | 4740 | 9.18 | 1.03 (0.68-1.56) |
| None | 2656 | 7.81 | 1.00 | 1903 | 7.55 | 1.00 | 753 | 9.19 | 1.00 |
| Past 12-month stressful life events | |||||||||
| Three or more | 6175 | 18.07 | 2.59 (2.22-3.03) | 4427 | 18.59 | 2.64 (2.23-3.13) | 1748 | 15.43 | 2.41 (1.64-3.53) |
| One or two | 11832 | 8.68 | 1.39 (1.20-1.62) | 9046 | 8.83 | 1.40 (1.19-1.65) | 2786 | 7.58 | 1.36 (0.94-1.98) |
| None | 7274 | 5.48 | 1.00 | 5743 | 5.55 | 1.00 | 1531 | 4.89 | 1.00 |
Bold text indicates statistical significance at p<0.05
AOR = odds ratio adjusted for age, sex, past-year personal income, education, region of residence, and major depression at Wave 1
Do Blacks report higher levels of UHBs?
Blacks had lower odds of Wave 1 alcohol consumption, nicotine consumption, and any UHBs compared with Whites, but a higher proportion of Blacks were in high Wave 1 BMI categories compared with Whites. This finding held in every level of Wave 1 stressful life events (see Table 2) save the lowest level. Among those with no stressful life events, there was no significant relationship between UHBs and race. The magnitude and strength of the relationship between UHB and race increased with each level of stressful life event category.
Table 2.
Odds of alcohol consumption, nicotine consumption, high BMI, and ‘unhealthy behaviors’ in non-Hispanic U.S.-born Blacks (N=6, 065) compared to non-Hispanic U.S.-born Whites (N=19,216) at low, moderate, and high levels of stress
| No stressful life events (N=7274) | 1-2 stressful life events (N=11832) | Three or more stressful life events (N=6175) | |||||||
|---|---|---|---|---|---|---|---|---|---|
| Blacks | Whites | Blacks | Whites | Blacks | Whites | ||||
| N=1531 | N=5743 | N=2786 | N=9046 | N=1748 | N=4427 | ||||
| % | % | AOR (95% C.I.) | % | % | AOR (95% C.I.) | % | % | AOR (95% C.I.) | |
| Alcohol consumption | |||||||||
| Alcohol abuse/dependence or at least weekly binge drinking | 7.58 | 8.46 | 0.55 (0.39-0.79) | 8.59 | 10.85 | 0.57 (0.45-0.72) | 16.49 | 21.40 | 0.50 (0.40-0.63) |
| Non-pathological and less than weekly binge drinking | 37.12 | 56.74 | 0.45 (0.37-0.55) | 43.03 | 59.06 | 0.52 (0.45-0.59) | 48.72 | 58.43 | 0.52 (0.43-0.61) |
| Alcohol abstention | 55.30 | 34.80 | 1.00 | 48.37 | 30.09 | 1.00 | 34.79 | 20.17 | 1.00 |
| Nicotine consumption | |||||||||
| Nicotine dependent | 5.31 | 7.65 | 0.54 (0.39-0.74) | 9.12 | 12.04 | 0.56 (0.46-0.69) | 15.36 | 26.99 | 0.35 (0.28-0.42) |
| Non-dependent nicotine use | 13.73 | 12.66 | 0.83 (0.67-1.03) | 15.17 | 13.31 | 0.90 (0.74-1.08) | 13.46 | 14.26 | 0.63 (0.52-0.78) |
| Nicotine abstention | 80.96 | 79.69 | 1.00 | 75.71 | 74.65 | 1.00 | 71.18 | 58.75 | 1.00 |
| BMI | |||||||||
| ≥35 | 11.09 | 6.26 | 2.38 (1.78-3.19) | 13.97 | 7.29 | 2.43 (1.94-3.04) | 17.56 | 10.29 | 2.16 (1.74-2.68) |
| >25-<35 | 55.98 | 49.41 | 1.82 (1.49-2.21) | 55.58 | 51.07 | 1.55 (1.32-1.83) | 50.00 | 46.24 | 1.62 (1.33-1.96) |
| ≤25 | 32.93 | 44.33 | 1.00 | 30.45 | 41.64 | 1.00 | 32.44 | 43.47 | 1.00 |
| Unhealthy behavior count | |||||||||
| Four or more | 6.11 | 5.57 | 0.85 (0.56-1.28) | 8.39 | 8.75 | 0.69 (0.52-0.92) | 15.09 | 20.86 | 0.33 (0.24-0.45) |
| One to three | 76.79 | 80.81 | 1.00 (0.71-1.10) | 79.54 | 81.82 | 0.82 (0.67-1.01) | 75.36 | 74.07 | 0.55 (0.43-0.71) |
| None | 17.10 | 13.61 | 1.00 | 12.07 | 9.42 | 1.00 | 9.55 | 5.13 | 1.00 |
Bold text indicates statistical significance at p<0.05
AOR = odds ratio adjusted for age, sex, past-year personal income, education, and region of residence
Do UHBs have a differential effect on depression among Blacks and Whites at certain stress levels?
Little support was found for the hypothesis that UHBs have a differential effect on Blacks and Whites at high levels of stress. We examined whether the effect of Wave 1 UHBs on Wave 2 depression differed by race and Wave 1 stressful life event status (Table 3). Results indicated that a low level of unhealthy behaviors is protective against depression in Blacks (OR=0.06, 95% C.I. 0.01-0.24) but not Whites (OR=2.14, 95% C.I. 0.71-6.48) among those at low levels of stress. However, the three-way interaction test was not significant, limiting the conclusions that can be drawn from this association. We did find a significant three-way interaction between race, Wave 1 stress, and Wave 1 BMI (F=2.11, df=12, p=0.03). Based on the patterns of odds ratios shown in Table 3, we conclude that there is evidence to suggest a protective effect of Wave 1 BMI 25-34 on Wave 2 depression in Blacks but not Whites, but only at very low levels of stress.
Table 3.
Odds of depression at Wave 2 based on unhealthy behaviors and past-year stressful life events at Wave 1, by race and sex, among non-Hispanic U.S.-born Blacks (N=6,065) and non-Hispanic U.S.-born Whites (N=19,216) in the general population
| White (N=19216) | Black (N=6065) | Two way interaction between race and unhealthy behavior | ||
|---|---|---|---|---|
| AOR (95% C.I.) | AOR (95% C.I.) | |||
| No stressors | Alcohol abuse/dependence or at least weekly binge drinking | 0.92 (0.54-1.55) | 1.85 (0.47-7.23) | 0.49, df=2, 0.61 |
| Non-pathological drinking | 1.04 (0.78-1.38) | 0.88 (0.34-2.29) | ||
| Abstention from alcohol | 1.00 | 1.00 | ||
| Nicotine dependence | 1.79 (1.20-2.65) | 1.58 (0.50-4.99) | 0.19, df=2, 0.82 | |
| Non-pathological nicotine use | 1.20 (0.82-1.75) | 1.66 (0.69-3.98) | ||
| No nicotine use | 1.00 | 1.00 | ||
| BMI ≥35 | 1.29 (0.80-2.09) | 0.49 (0.21-1.14) | 1.98, df=2, 0.15 | |
| BMI >25-<35 | 0.90 (0.69-1.18) | 0.49 (0.26-0.93) | ||
| BMI ≤25 | 1.00 | 1.00 | ||
| High unhealthy behavior count | 1.60 (0.91-2.82) | 0.58 (0.13-2.52) | 3.35, df=2, 0.04 | |
| Low unhealthy behavior count | 1.39 (0.97-2.01) | 0.42 (0.18-0.96) | ||
| No unhealthy behaviors | 1.00 | 1.00 | ||
| 1-2 stressors | Alcohol abuse/dependence or at least weekly binge drinking | 1.15 (0.84-1.57) | 0.60 (0.32-1.15) | 1.50, df=2, 0.23 |
| Non-pathological drinking | 0.93 (0.76-1.13) | 0.75 (0.46-1.21) | ||
| Abstention from alcohol | 1.00 | 1.00 | ||
| Nicotine dependence | 1.65 (1.28-2.12) | 1.26 (0.74-2.12) | 0.34, df=2, 0.71 | |
| Non-pathological nicotine use | 1.04 (0.79-1.38) | 1.22 (0.57-2.60) | ||
| No nicotine use | 1.00 | 1.00 | ||
| BMI ≥35 | 1.11 (0.81-1.53) | 1.30 (0.82-2.08) | 0.98, df=2, 0.38 | |
| BMI >25-<35 | 1.09 (0.91-1.31) | 0.92 (0.64-1.32) | ||
| BMI ≤25 | 1.00 | 1.00 | ||
| High unhealthy behavior count | 1.38 (0.93-2.04) | 1.24 (0.53-2.90) | 0.38, df=2, p=0.69 | |
| Low unhealthy behavior count | 1.06 (0.79-1.43) | 1.29 (0.74-2.24) | ||
| No unhealthy behaviors | 1.00 | 1.00 | ||
| 3 or more stressors | Alcohol abuse/dependence or at least weekly binge drinking | 1.20 (0.90-1.60) | 1.18 (0.69-2.04) | 0.22, df=2, 0.80 |
| Non-pathological drinking | 0.96 (0.76-1.22) | 0.82 (0.55-1.21) | ||
| Abstention from alcohol | 1.00 | 1.00 | ||
| Nicotine dependence | 1.44 (1.15-1.80) | 0.96 (0.62-1.48) | 1.90, df=2, 0.16 | |
| Non-pathological nicotine use | 0.94 (0.71-1.24) | 0.62 (0.37-1.05) | ||
| No nicotine use | 1.00 | 1.00 | ||
| BMI ≥35 | 1.81 (1.39-2.37) | 1.19 (0.73-1.94) | 1.49, df=2, 0.23 | |
| BMI >25-<35 | 1.43 (1.18-1.74) | 1.21 (0.83-1.77) | ||
| BMI ≤25 | 1.00 | 1.00 | ||
| High unhealthy behavior count | 2.03 (1.26-3.27) | 1.12 (0.52-2.45) | 1.36 df=2, 0.26 | |
| Low unhealthy behavior count | 1.39 (0.92-2.11) | 1.13 (0.57-2.25) | ||
| No unhealthy behaviors | 1.00 | 1.00 | ||
| Three way interctions | Stress by race by | |||
| Alcohol consumption | 0.55, df=12, 0.87 | |||
| Nicotine consumption | 0.91, df=12, 0.54 | |||
| BMI | 2.11, df=12, 0.03 | |||
| UHB count | 1.02, df=12, 0.44 | |||
Bold text indicates statistical significance at p<0.05
AOR = odds ratio adjusted for age, sex, past-year personal income, education, region of residence, and major depression at Wave 1
We also examined these patterns by sex (results not shown). UHBs significantly interacted with race among men only (F=6.07, df=2, p=0.004), whereby Black men reporting a low level of unhealthy behaviors had significantly lower odds of depression compared to White men (OR=0.06, 95% C.I. 0.01-0.24). Similar to the aggregated analysis, a three way interaction between Wave 1 BMI, race, and Wave 1 stress was statistically significant in men (F=2.28, df=12, p=0.02). This interaction was significant at the trend level among women (F=1.7, df=12, p=0.09).
Are UHBs protective against depression among Blacks reporting more race-specific stress?
Wave 1 UHBs did not moderate the effect of perceived discrimination reported at Wave 2 among Blacks. The observed prevalence of Wave 2 depression by UHB consumption and discrimination experiences are shown in Figure 3. In unadjusted analyses, Wave 1 non-pathological nicotine use was associated with a lower odds of depression at Wave 2 compared to no nicotine use (OR=0.48, 95% C.I. 0.24-0.96) (data not shown). However, the effect was no longer significant when lifetime depression at Wave 1 was controlled (OR=0.52, 95% C.I. 0.26, 1.05) (data not shown). No other odds ratios were significant in unadjusted or adjusted analyses. We also replicated these analyses using UHBs defined at Wave 2 (concurrent to measurement of discrimination): results were unchanged.
Figure 3.
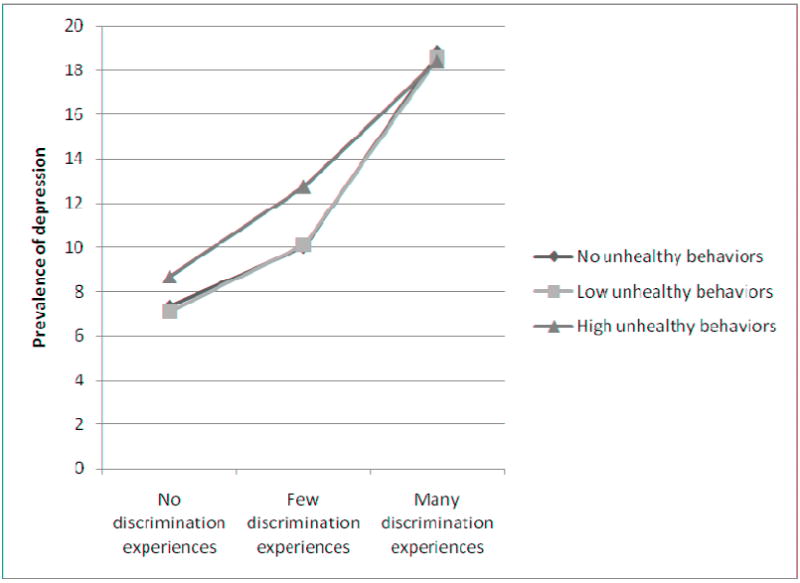
Prevalence of depression at Wave 2 based on unhealthy behaviors and lifetime perceived discrimination exposure among non-Hispanic U.S.-born Blacks (N=6,065) in the general population
Discussion
The present study did not find support for the hypothesis that engaging in unhealthy behaviors ameliorates major depression among Blacks in the U.S. exposed to high levels of stress, or that a differential effect of UHBs on depression among Blacks compared with Whites accounts for the mental/physical health paradox. First, we showed that the results presented in Jackson et al. (2009) and Mezuk et al (2010) do not replicate in a nationally-representative sample using model specification to account for the non-linear association between stress and depression among Blacks that we observed in these data. Next, as part of a more in-depth investigation of the hypothesis, we demonstrated that the relationship between depression and alcohol consumption, nicotine consumption, and BMI among Blacks is not statistically significant and, in fact, the direction of association between UHBs and depression is positive, not negative. Third, we documented that Blacks are less likely to engage in alcohol and nicotine consumption but have higher BMI than Whites at all levels of stress. We note, however, that an overall count of UHBs was not associated with race among those with no stressful life events. This suggests a complex patterning of unhealthy behaviors and race across stress levels that should be more comprehensively examined in these and other data in future analyses.
Finally, we showed that while race, stress, and BMI did interact significantly to predict depression in this sample, being overweight was protective against depression among Blacks only at very low levels of stress. Similarly, among those with no stressful life events, we found that low levels of UHBs were associated with less depression in Blacks but not Whites, though this result was significant among men only and a three-way interaction test was not significant. Furthermore, examination of perceived discrimination as a measure of stress in Blacks revealed no significant effects of unhealthy behaviors on depression at any exposure level. Taken together, these results indicate that engagement in unhealthy behaviors, especially at pathological levels, does not protect against depression, and that stress pathways do not operate differently in Blacks compared with Whites in the U.S. Thus, our confidence in the group-specific stress and coping hypothesis proposed by Jackson and colleagues (Jackson and Knight 2006; Jackson, Knight et al. 2009; Mezuk et al. 2010) is diminished. Although UHBs may have immediate positive psychological effects via the HPA axis, the evidence presented here suggests these effects are not robust enough to prevent the clinical manifestation of major depression.
We did find evidence that some measures of unhealthy behaviors were significant predictors of depression in Whites but not Blacks. For example, at high levels of stress, Whites with high BMI, nicotine dependence, and a high unhealthy behavior count were more likely to evidence depression compared with Whites without these unhealthy behaviors, but the same predictors were not significant among Blacks. However, we caution against over-interpretation of these findings; as noted by Gelman and Stern: “The Difference Between ‘Significant’ and ‘Not Significant’ is not Itself Statistically Significant” (Gelman and Stern 2006). There were no significant interactions between race and unhealthy behaviors at high levels of stress, indicating that the odds ratios across race categories were not statistically distinguishable. Further, ignoring significance levels, thirty-two of forty-eight odds ratios calculated (67%) in the total sample were in the same direction for Whites and Blacks. Thus, the most appropriate conclusion from these data is the pathway through which unhealthy behaviors and stress impact depression does not differ in Blacks compared with Whites in the U.S., and that in general, UHBs increase the risk for depression at all levels of stress.
In the present analysis we predicted major depression during a three-year follow-up based on stressful events and UHBs assessed at baseline. While this strategy is most appropriate to establish temporality, it may overlook a key component of the hypothesis, namely, that UHBs in response to stress are active coping strategies for the suppression of immediate depressive symptoms (Benowitz 1988; Koob, Roberts et al. 1998; Dallman, Pecoraro et al. 2003; Jackson and Knight 2006; Jackson, Knight et al. 2009). Thus, we may have failed to capture protective effects because we did not examine major depressive episodes concurrent with stressors and unhealthy behaviors. To explore this possibility, we re-analyzed our data using stress, UHBs and depression diagnoses all measured concurrently, at both baseline and follow-up. Neither analysis suggested different conclusions; results were generally consistent with those presented in our main analyses. Thus, we conclude that these data, analyzed multiple ways at multiple time points, do not provide sufficient evidence for either a protective effect of UHBs on depression, or a differential pathway through which unhealthy behaviors affect depression in Blacks compared with Whites, regardless of the exposure to stress.
These results decrease confidence in the validity of the hypothesis that group-specific stress processes explain the depression difference in Blacks and Whites, leaving open other theories to be tested. Measurement and selection bias hypotheses are unlikely to fully explain the “paradox” (Breslau, Javaras et al. 2008), suggesting the need for both new theories and more direct tests of existing theories based on the premise that the lower prevalence of depression in Blacks is not artefactual. Studies suggest that Blacks develop different coping strategies when faced with life stress compared with Whites (Smith 1985; Wilson 1989; Maton, Teti et al. 1996), which, given the extraordinary nature and degree of stress to which Blacks are exposed starting at a young age, are hypothesized to develop over the life course. Compared with Whites, Blacks are more likely to find emotional strength and support in religious communities (Taylor, Chatters et al. 1996; Gibson and Hendricks 2006; Giger, Appel et al. 2008), and develop racial self-esteem and strong ethnic identity (Nagel 1994). Further, extensive research has documented the ‘John Henryism’ effect among Blacks in the U.S., the personality trait characterized by active coping with stressful and negative experiences and associated with worse health outcomes for Blacks at high levels of socio-economic position (James, Strogatz et al. 1987; James 1994). Alternatively, the present DSM nosology may not accurately tap Black psychological responses to their unique stress exposures, and therefore DSM-IV depression as currently defined may not be the appropriate outcome to fully understand racial differences in depressive mood states (Brown 2003; Kendrick, Anderson et al. 2007). Support for this theory can be drawn from the multiple studies showing that Blacks report lower levels of well-being, higher levels of distress, and higher depressive scores when measured on non-DSM instruments (Brown 2003; Mabry and Kiecolt 2005). Taken together, the results from the present study should serve as a catalyst to promote the advancement of innovative and alternative theories to explain the Black/White paradox in mental and physical health. Few studies are conducted with the primary aim of untangling this paradox, a situation that should be redressed. Such research should include rich measurement of the social and political context, and conduct in-depth examination of the role of ethnic identity, religion, and responses to group-specific stressor, such as racial discrimination.
Several limitations should be noted. First, our measure of stressful life events is a checklist of experiences susceptible to respondent subjectivity and appraisal processes, and without regard to salience, severity, or context of experience. Substantial evidence indicates that objective measures of stressful experiences as well as information on the context of the experience is necessary to fully analyze and interpret stress in mental health research (Dohrenwend 1998 ; Dohrenwend 2006). Additionally, the stressful events experienced by Blacks in the U.S. may be more chronic and race-specific than what is captured in the scale of past-year stressors (Jones 2000; Kreiger 2000). We attempted to mitigate this limitation by also using a measure of perceived racial/ethnic discrimination. Further, we evaluated whether results changed if higher cut-offs of past-year stressful experiences were used to define the ‘high stress’ exposure group; higher cut-offs did not change the results. Thus, the conclusions from these data are limited by the available stress measure.
In conclusion, the persistent differences in health outcomes between White and Black adults remain one of the most challenging public health issues in the U.S. As theories regarding the etiology of these differences continue to develop, the mental health ‘paradox’ will be increasingly important to explain as part of a robust etiologic pathway. Substantive etiologic hypotheses that simultaneously explain why Blacks in the U.S. have higher rates of physical illness and lower rates of mood disorders need to be tested directly in order to resolve the ‘paradox’ and progress toward intervention and prevention efforts.
Hypothesis that Black-White depression paradox is due to protective effects of unhealthy behaviors at high stress unsupported.
Blacks less likely to engage in alcohol consumption or cigarette smoking compared with Whites, but have higher average BMI.
Engaging in unhealthy behaviors is not protective against depression at any stress level in either Blacks or Whites.
Acknowledgments
This research was supported in part by a fellowship from the National Institute of Mental Health (T32MH013043-36, Barnes) and a fellowship from the National Institute of Drug Abuse (F31-DA026689, K. Keyes).
Footnotes
Publisher's Disclaimer: This is a PDF file of an unedited manuscript that has been accepted for publication. As a service to our customers we are providing this early version of the manuscript. The manuscript will undergo copyediting, typesetting, and review of the resulting proof before it is published in its final citable form. Please note that during the production process errors may be discovered which could affect the content, and all legal disclaimers that apply to the journal pertain.
References
- Baker FM. Diagnosing depression in African Americans. Community Mental Health Journal. 2001;37(1):31–38. doi: 10.1023/a:1026540321366. [DOI] [PubMed] [Google Scholar]
- Benowitz NL. Drug therapy. Pharmacologic aspects of cigarette smoking and nicotine addition. N Engl J Med. 1988;319(20):1318–30. doi: 10.1056/NEJM198811173192005. [DOI] [PubMed] [Google Scholar]
- Breslau J, Aguilar-Gaxiola S, et al. Specifying race-ethnic differences in risk for psychiatric disorder in a USA national sample. Psychol Med. 2006;36(1):57–68. doi: 10.1017/S0033291705006161. [DOI] [PMC free article] [PubMed] [Google Scholar]
- Breslau J, Javaras KN, et al. Differential item functioning between ethnic groups in the epidemiological assessment of depression. J Nerv Ment Dis. 2008;196(4):297–306. doi: 10.1097/NMD.0b013e31816a490e. [DOI] [PMC free article] [PubMed] [Google Scholar]
- Brown T. Critical race theory speaks to the sociology of mental health: mental health problems produced by racial stratification. Journal of Health and Social Behavior. 2003;44(3):292–301. [PubMed] [Google Scholar]
- Centers for Disease Control and Prevention. 2010 http://www.cdc.gov/healthyweight/assessing/bmi/adult_bmi/index.html.
- Dallman MF, Pecoraro N, et al. Chronic stress and obesity: a new view of “comfort food”. Proc Natl Acad Sci U S A. 2003;100(20):11696–701. doi: 10.1073/pnas.1934666100. [DOI] [PMC free article] [PubMed] [Google Scholar]
- Dohrenwend BP. Adversity, stress, and Psychopathology. New York: Oxford University Press, USA; 1998. [Google Scholar]
- Dohrenwend BP. The role of adversity and stress in psychopathology: some evidence and its implications for theory and research. J Health Soc Behav. 2000;41(1):1–19. [PubMed] [Google Scholar]
- Dohrenwend BP. Inventorying stressful life events as risk factors for psychopathology: Toward resolution of the problem of intracategory variability. Psychol Bull. 2006;132(3):477–95. doi: 10.1037/0033-2909.132.3.477. [DOI] [PMC free article] [PubMed] [Google Scholar]
- Gelman A, Stern H. The Difference Between “Significant” and “Not Significant” is not Itself Statistically Significant. American Statistician. 2006;60(4):328–331. [Google Scholar]
- Geronimus AT. Power and Decision: The Social Control of Reproduction. Cambridge, MA: Harvard University Press; 1994. The weathering hypothesis and the health of African American women and infants: Implicatins for reproductive strategies and policy analysis. [Google Scholar]
- Geronimus AT. Black/White differences in the relationship of maternal age to brithweight: A population basd test of the weathering hypothesis. Soc Sci Med. 1996;42(4):589–597. doi: 10.1016/0277-9536(95)00159-x. [DOI] [PubMed] [Google Scholar]
- Gibson LM, Hendricks CS. Integrative review of spirituality in African American breast cancer survivors. ABNF J. 2006;17(2):67–72. [PubMed] [Google Scholar]
- Giger JN, Appel SJ, et al. Church and spirituality in the lives of the African American community. J Transcult Nurs. 2008;19(4):375–83. doi: 10.1177/1043659608322502. [DOI] [PubMed] [Google Scholar]
- Grant BF, Goldstein RB, et al. Sociodemographic and psychopathologic predictors of first incidence of DSM-IV substance use, mood and anxiety disorders: results from the Wave 2 National Epidemiologic Survey on Alcohol and Related Conditions. Mol Psychiatry. 2009;14(11):1051–66. doi: 10.1038/mp.2008.41. [DOI] [PMC free article] [PubMed] [Google Scholar]
- Grant BF, Hasin DS, et al. Nicotine dependence and psychiatric disorders in the United States: results from the national epidemiologic survey on alcohol and related conditions. Arch Gen Psychiatry. 2004;61(11):1107–15. doi: 10.1001/archpsyc.61.11.1107. [DOI] [PubMed] [Google Scholar]
- Haimoto H, Iwata M, et al. Long-term effects of a diet loosely restricting carbohydrates on HbA1c levels, BMI and tapering of sulfonylureas in type 2 diabetes: a 2-year follow-up study. Diabetes Res Clin Pract. 2008;79(2):350–6. doi: 10.1016/j.diabres.2007.09.009. [DOI] [PubMed] [Google Scholar]
- Hasin DS, Goodwin RD, et al. Epidemiology of major depressive disorder: results from the National Epidemiologic Survey on Alcoholism and Related Conditions. Arch Gen Psychiatry. 2005;62(10):1097–106. doi: 10.1001/archpsyc.62.10.1097. [DOI] [PubMed] [Google Scholar]
- Hasin DS, Stinson FS, et al. Prevalence, correlates, disability, and comorbidity of DSM-IV alcohol abuse and dependence in the United States: results from the National Epidemiologic Survey on Alcohol and Related Conditions. Arch Gen Psychiatry. 2007;64(7):830–42. doi: 10.1001/archpsyc.64.7.830. [DOI] [PubMed] [Google Scholar]
- Heckler MM. Report of the Secretary’s Task Force on Black and Minority Health. Wasington, DC: Natl. Academy Press; 1985. Task Force on Black and Minority Health. [Google Scholar]
- Hetherington MM, Cecil JE. Gene-environment interactions in obesity. Forum Nutr. 2010;63:195–203. doi: 10.1159/000264407. [DOI] [PubMed] [Google Scholar]
- Jackson JS, Knight KM. Race and self-regulatory behaviors: the role of the stress response and HPA axis in physical and mental health disparities. In: Carstensen LL, Schaie KW, editors. Social structure, Aging, and Self-Regulation in the Elderly. New York, NY: Springer; 2006. [Google Scholar]
- Jackson JS, Knight KM, et al. Race and Unhealthy Behaviors: Chronic Stress, the HPA Axis, and Physical and Mental Health Disparities Over the Life Course. Am J Public Health. 2009 doi: 10.2105/AJPH.2008.143446. [DOI] [PMC free article] [PubMed] [Google Scholar]
- James SA. John Henryism and the health of African Americans. Culture of Medicine and Psychiatry. 1994;18:163–182. doi: 10.1007/BF01379448. [DOI] [PubMed] [Google Scholar]
- James SA, Strogatz DS, et al. Socioeconomic status, John Henryism, and hypertension in blacks and whites. Am J Epidemiol. 1987;126(4):664–73. doi: 10.1093/oxfordjournals.aje.a114706. [DOI] [PubMed] [Google Scholar]
- Jones CP. Levels of racism: a theoretic framework and a gardener’s tale. Am J Public Health. 2000;90(8):1212–5. doi: 10.2105/ajph.90.8.1212. [DOI] [PMC free article] [PubMed] [Google Scholar]
- Kendrick L, Anderson NLR, et al. Perceptions of depression among young African American men. Family and Community Health. 2007;30(1):63–73. doi: 10.1097/00003727-200701000-00008. [DOI] [PubMed] [Google Scholar]
- Kent LM, Worsley A. Trends in BMI, diet and lifestyle between 1976 and 2005 in North Sydney. Asia Pac J Clin Nutr. 2009;18(3):453–61. [PubMed] [Google Scholar]
- Kessler RC, Crum RM, et al. Lifetime co-occurrence of DSM-III-R Alcohol Abuse and Dependence WIth Other Psychiatric Disorders in the National COmorbidity Survey. Arch Gen Psychiatry. 1997;54:313–321. doi: 10.1001/archpsyc.1997.01830160031005. [DOI] [PubMed] [Google Scholar]
- Kessler RC, McGonagle KA, et al. Lifetime and 12-month prevalence of DSM-III-R psychiatric disorders in the United States. Results from the National Comorbidity Survey. Arch Gen Psychiatry. 1994;51(1):8–19. doi: 10.1001/archpsyc.1994.03950010008002. [DOI] [PubMed] [Google Scholar]
- Kessler RC, Mickelson KD, et al. The prevalence, distribution, and mental health correlates of perceived discrimination in the United States. J Health Soc Behav. 1999;40(3):208–30. [PubMed] [Google Scholar]
- Klatsky AL. Alcohol and cardiovascular diseases. Expert Rev Cardiovasc Ther. 2009;7(5):499–506. doi: 10.1586/erc.09.22. [DOI] [PubMed] [Google Scholar]
- Kleinman A. Culture and depression. N Engl J Med. 2004;351(10):951–3. doi: 10.1056/NEJMp048078. [DOI] [PubMed] [Google Scholar]
- Koob GF, Roberts AJ, et al. Neurocircuitry targets in ethanol reward and dependence. Alcohol Clin Exp Res. 1998;22(1):3–9. [PubMed] [Google Scholar]
- Kreiger N. Social Epidemiology. New York: Oxford University Press; 2000. Discrimination and health; pp. 36–75. [Google Scholar]
- Krieger N. Racial and gender discrimination: risk factors for high blood pressure? Soc Sci Med. 1990;30(12):1273–81. doi: 10.1016/0277-9536(90)90307-e. [DOI] [PubMed] [Google Scholar]
- Krieger N, Sidney S. Racial discrimination and blood pressure: the CARDIA Study of young black and white adults. Am J Public Health. 1996;86(10):1370–8. doi: 10.2105/ajph.86.10.1370. [DOI] [PMC free article] [PubMed] [Google Scholar]
- Krieger N, Smith K, et al. Experiences of discrimination: validity and reliability of a self-report measure for population health research on racism and health. Soc Sci Med. 2005;61(7):1576–96. doi: 10.1016/j.socscimed.2005.03.006. [DOI] [PubMed] [Google Scholar]
- Leonard B. Stress, Depression, and the Activation of the Immune System. World Journal of Biological Psychiatry. 2000;1(1):17–25. doi: 10.3109/15622970009150562. [DOI] [PubMed] [Google Scholar]
- Mabry JB, Kiecolt KJ. Anger in black and white: race, alienation, and anger. J Health Soc Behav. 2005;46(1):85–101. doi: 10.1177/002214650504600107. [DOI] [PubMed] [Google Scholar]
- Massey DS. Residential segregation and neighborhood conditions in U.S. metropolitan areas. In: Smesler N, Wilson WJ, Mitchell F, editors. America Becoming Racial: Trends and Their Consequences. Wasington, D.C.: Natl Acad Press; 1985. pp. 391–434. [Google Scholar]
- Massey DS. Segregation and stratification: a biosocial perspective. DuBois Reviews of Social Science. 2004;1:7–25. [Google Scholar]
- Maton KI, Teti DM, et al. Cultural specificity of support sources, correlates and contexts: three studies of African-American and caucasian youth. Am J Community Psychol. 1996;24(4):551–87. doi: 10.1007/BF02506796. [DOI] [PubMed] [Google Scholar]
- McCord C, Freeman HP. Excess mortality in Harlem. N Engl J Med. 1990;322(3):173–7. doi: 10.1056/NEJM199001183220306. [DOI] [PubMed] [Google Scholar]
- McEwen BS. Allostasis and allostatic load: implications for neuropsychopharmacology. Neuropsychopharmacology. 2000;22(2):108–24. doi: 10.1016/S0893-133X(99)00129-3. [DOI] [PubMed] [Google Scholar]
- McEwen BS. Mood disordesr and allostatic load. Biological Psychiatry. 2003;54(3):200–207. doi: 10.1016/s0006-3223(03)00177-x. [DOI] [PubMed] [Google Scholar]
- McEwen BS. Protection and damage from acute and chronic stress: allostasis and allostatic overload and relevance to the pathophysiology of psychiatric disorders. Ann N Y Acad Sci. 2004;1032:1–7. doi: 10.1196/annals.1314.001. [DOI] [PubMed] [Google Scholar]
- Mezuk B, Rafferty JA, et al. Reconsidering the Role of Social Disadvantage in Physical and Mental Health: Stressful Life Events, Health Behaviors, Race, and Depression. Am J Epidemiology. 2010;172(11):1238–1249. doi: 10.1093/aje/kwq283. [DOI] [PMC free article] [PubMed] [Google Scholar]
- Nagel J. Constructing Ethnicity: Creating and Recreating Ethnic Identity and Culture. Social Problems. 1994;41(1) [Google Scholar]
- Neighbors HW, Trierweiler SJ, et al. Racial differences in DSM diagnosis using a semi-structured instrument: the importance of clinical judgment in the diagnosis of African Americans. J Health Soc Behav. 2003;44(3):237–56. [PubMed] [Google Scholar]
- Neighbors HW, Trierweiler SJ, et al. Psychiatric diagnosis of African Americans: diagnostic divergence in clinician-structured and semistructured interviewing conditions. J Natl Med Assoc. 1999;91(11):601–12. [PMC free article] [PubMed] [Google Scholar]
- Petit B, Western B. Mass imprisonment and the life course: race and class inequality in U.S. incarceration. American Sociological Review. 2004;69:601–612. [Google Scholar]
- Reiger DA, Farmer ME, et al. Comorbidity of mental disorders with alcohol and other drug abuse: results from the Epidemiologic Catchment Area (ECA) study. JAMA. 1990;264(19):2511–2518. [PubMed] [Google Scholar]
- Rogler LH. Methodological sources of cultural insensitivity in mental health research. Am Psychol. 1999;54(6):424–33. doi: 10.1037//0003-066x.54.6.424. [DOI] [PubMed] [Google Scholar]
- Rothman KJ. BMI-related errors in the measurement of obesity. Int J Obes (Lond) 2008;32(Suppl 3):S56–9. doi: 10.1038/ijo.2008.87. [DOI] [PubMed] [Google Scholar]
- Ruan WJ, Goldstein RB, et al. The alcohol use disorder and associated disabilities interview schedule-IV (AUDADIS-IV): reliability of new psychiatric diagnostic modules and risk factors in a general population sample. Drug Alcohol Depend. 2008;92(1-3):27–36. doi: 10.1016/j.drugalcdep.2007.06.001. [DOI] [PMC free article] [PubMed] [Google Scholar]
- Saha TD, Chou SP, et al. Toward an alcohol use disorder continuum using item response theory: results from the National Epidemiologic Survey on Alcohol and Related Conditions. Psychol Med. 2006;36(7):931–41. doi: 10.1017/S003329170600746X. [DOI] [PubMed] [Google Scholar]
- Saha TD, Compton WM, et al. Dimensionality of DSM-IV nicotine dependence in a national sample: an item response theory application. Drug Alcohol Depend. 2010;108(1-2):21–8. doi: 10.1016/j.drugalcdep.2009.11.012. [DOI] [PMC free article] [PubMed] [Google Scholar]
- Smith E. Ethnic minorities: life stress, social support, and mental health issues. The Counseling Psychologist. 1985;13:537–579. [Google Scholar]
- Stansfeld SA. Social support and social cohesion. In: Marmot MG, Wilkinson RG, editors. Social determinants of health. New York: Oxford University Press; 2005. [Google Scholar]
- Strakowski SM, Keck PE, Jr, et al. Ethnicity and diagnosis in patients with affective disorders. J Clin Psychiatry. 2003;64(7):747–54. doi: 10.4088/jcp.v64n0702. [DOI] [PubMed] [Google Scholar]
- Taylor RJ, Chatters LM, et al. Black and white differences in religious participation: A multi-sample comparison. Journal for the Scientific Study of Religion. 1996;35:403–410. [Google Scholar]
- Teplin LA. The prevalence of severe mental disorder among male urban jail detainees: comparison with the Epidemiologic Catchment Area Program. Am J Public Health. 1990;80(6):663–9. doi: 10.2105/ajph.80.6.663. [DOI] [PMC free article] [PubMed] [Google Scholar]
- Teplin LA, Abram KM, et al. Prevalence of psychiatric disorders among incarcerated women. I. Pretrial jail detainees. Arch Gen Psychiatry. 1996;53(6):505–12. doi: 10.1001/archpsyc.1996.01830060047007. [DOI] [PubMed] [Google Scholar]
- Williams DR. Racial variations in adult health status: patterns, paradoxes, and prospects. In: Smelser NJ, Wilson WJ, Mitchell F, editors. America Becoming: Racial Trends and Their Consequences. Washington, D.C.: National Academy Press; 2001. [Google Scholar]
- Williams DR, Gonzalez HM, et al. Prevalence and distribution of major depressive disorder in African Americans, Caribbean blacks, and non-Hispanic whites: results from the National Survey of American Life. Arch Gen Psychiatry. 2007;64(3):305–15. doi: 10.1001/archpsyc.64.3.305. [DOI] [PubMed] [Google Scholar]
- Williams DR, Jackson PB. Social sources of racial disparities in health. Health Aff (Millwood) 2005;24(2):325–34. doi: 10.1377/hlthaff.24.2.325. [DOI] [PubMed] [Google Scholar]
- Williams DR, Williams-Morris R. Racism and mental health: the African American experience. Ethn Health. 2000;5(3-4):243–68. doi: 10.1080/713667453. [DOI] [PubMed] [Google Scholar]
- Wilson MN. Child development in the context of the Black extended family. American Psychologist. 1989;44:380–383. [Google Scholar]