Abstract
Purpose
To determine the reproducibility of proton MR spectroscopy (1H-MRS) for assessing vertebral bone marrow adiposity at 3 Tesla (T); to evaluate variation of marrow adiposity at different vertebral levels; and to demonstrate the feasibility of using 1H-MRS at 3 T for evaluating marrow adiposity in subjects with low bone density.
Materials and Methods
Single voxel MRS was acquired at vertebral body L1 to L4 at 3 T in 51 post-menopausal females including healthy controls (n = 13) and patients with osteoporosis/osteopenia (n = 38). Marrow fat contents were compared between vertebral levels and between groups using analysis of variance (ANOVA). Six subjects were scanned twice to evaluate technique reproducibility.
Results
The average coefficient of variation of vertebral marrow fat content quantification was 1.7%. Marrow fat content significantly increased from L1 to L4. The average fat content was significantly elevated in patients with osteoporosis/osteopenia and in patients with diabetes compared to controls, adjusted for age and body mass index (BMI) (P < 0.05).
Conclusions
In vivo MRS at high field strength provides reliable measurement of marrow adiposity with excellent reproducibility and can be a valuable tool for providing complementary information on bone quality and potentially also fracture risk.
Keywords: bone marrow adiposity, magnetic resonance spectroscopy, osteoporosis
Introduction
Bone marrow adiposity may play a significant role in affecting both bone quantity, including bone size and density, and bone quality (1). Animal and cell models suggest that marrow adiposity is linked to the process of mesenchymal stem cell (MSC) allocation in the bone marrow and affects bone metabolism (2, 3). As a result, bone marrow adiposity quantification has recently gained increasing attention as a potential biomarker for bone quantity and quality.
Proton magnetic resonance spectroscopy (1H-MRS) has been proposed as a promising candidate for quantifying marrow adiposity non-invasively that can be easily integrated into routine clinical procedures (4–7). Previous studies have shown that 1H-MRS was able to detect age- and gender-related differences in marrow adiposity (5, 8). Increased bone marrow adiposity measured by 1H-MRS has also been associated with decreased bone mineral density (BMD) in patients with osteoporosis or osteopenia (4, 9, 10).
While most of the previous MRS studies on quantifying bone marrow adiposity were performed at 1.5 Tesla (T), 3 T MR provides advantages for MRS including enhanced spectral resolution and higher signal-to-noise ratio (SNR) (11). No data has yet been reported for vertebral bone marrow adiposity quantification in osteoporosis or diabetes using 3 T MR. Further, previous studies were primarily focused on measuring vertebral bodies only at one level (typically L2 or L3). Our understanding of variation in marrow adiposity between different vertebral levels is very limited (11). Finally, few studies evaluated the reproducibility of marrow fat content measured by 1H-MRS (12, 13). Such evaluation is critical during interpretation of 1H-MRS results for both cross-sectional and longitudinal studies.
Thus the goals of this study were three-fold: 1) to determine the reproducibility of 1H-MRS for assessing vertebral bone marrow fat content at 3 T; 2) to evaluate variation of marrow fat content at different vertebral levels; and 3) to demonstrate the feasibility of using 1H-MRS at 3 T for evaluating marrow adiposity in subjects with low bone density.
Methods
Subjects
A total of 51 post-menopausal female subjects, at least 50 years old, were included for this study analysis, composed of two groups: Group I (n = 13): healthy controls with no history of diagnosed osteoporosis/osteopenia or diabetes; Group II (n = 38): subjects with either osteopenia or osteoporosis at the spine and/or hip based on dual-energy X-ray aborptiopmetry (DXA) measurement. DXA scans were available on 7 of the 14 women in Group I. Both groups excluded women who reported current use of medications known to affect bone, including thiazolidinediones, oral steroids, hormone replacement therapy, bisphosphonates, and other osteoporosis medications. The study was approved by the Committee for Human Research at our institution. Written informed consent was obtained from all of the subjects after the nature of the examinations had been fully explained.
Imaging protocols
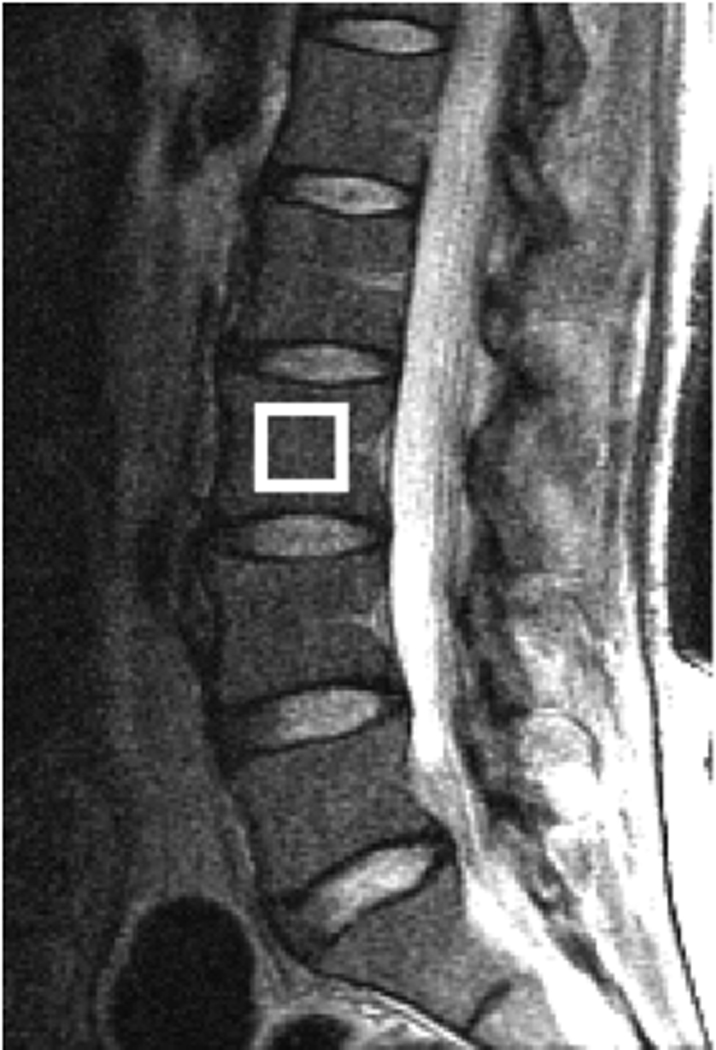
All MR data were acquired using a GE Signa 3 T scanner (GE Healthcare, Milwaukee, WI) with a four-channel cervical-thoracic-lumber (CTL) spine coil (the lower two elements, GE Healthcare). The imaging protocol included a standard clinical sagittal T2-weighted FSE sequence (TR/TE = 5000/87 ms, echo train length [ETL] = 32, field of view [FOV] = 22 cm, slice thickness = 6 mm), which was used for visual assessment of lumbar vertebrae and for prescription of the spectral acquisition box. Single voxel 1H-MRS was acquired in vertebral bodies from L1 to L4 using the Point Resolved Spectroscopy (PRESS) sequence. The parameters of PRESS 1H-MRS were: TR/TE = 3000/37 ms, 64 averages without water suppression, sweep width = 5000 Hz, data points = 4096, voxel size = 15 × 15 × 20 mm3 = 4.5 cm3. The PRESS box was positioned in the middle of the vertebral body, Figure 1A. The PRESS box size was kept the same (4.5 cm3) for each vertebral level and for all subjects. Six outer volume saturation bands (one on each side of the PRESS box) were used to eliminate potential contamination of outside signals. The default auto-shimming provided by the manufacturer was used, which is a first order linear shimming.
Figure 1.
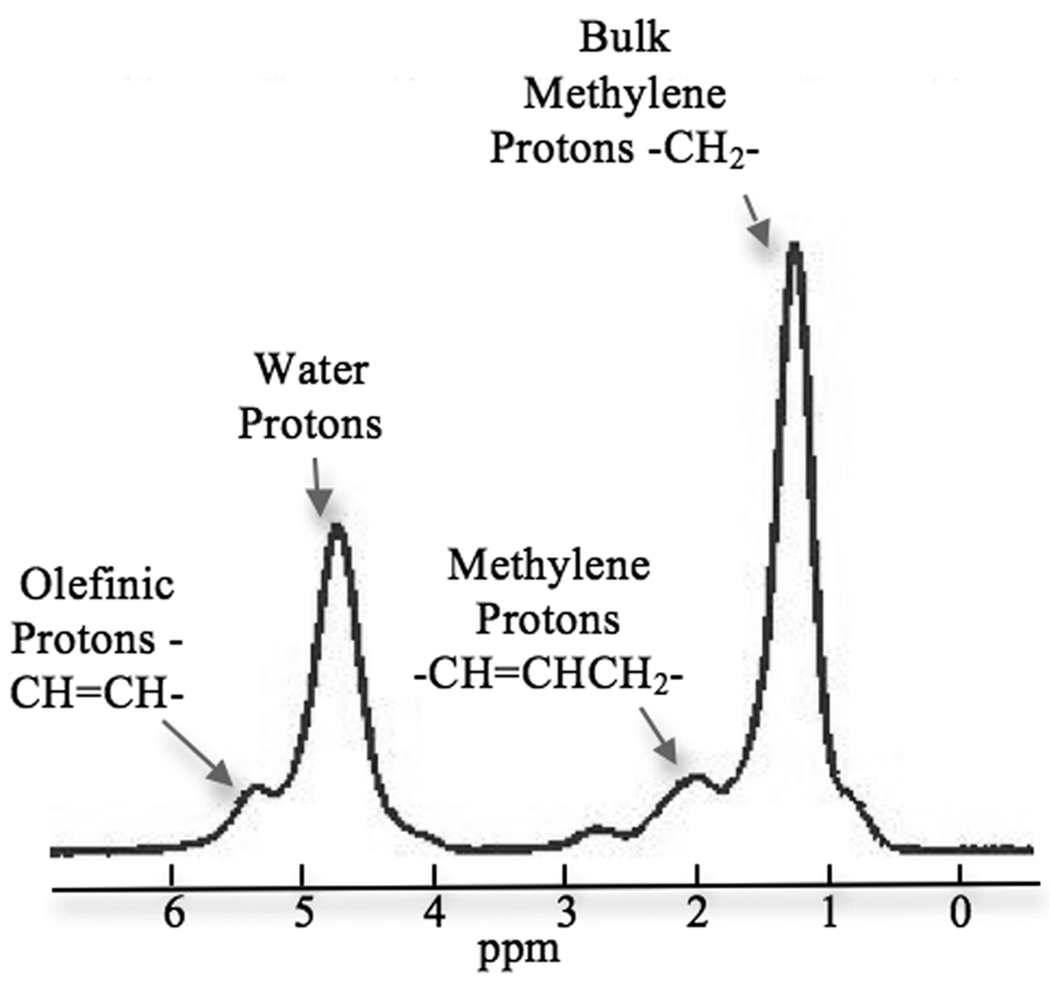
Single voxel MR spectroscopy (SV-1H-MRS) was acquired from L1-L4 vertebral bodies using PRESS acquisition. (A) PRESS box was positioned in the middle of the vertebral body (using L3 as an example). (B) Example spectrum in vertebral bone marrow. Four peaks were well resolved using the present technique: olefinic, double bond -CH=CH- protons at 5.31 ppm, water protons at 4.65 ppm, the CH2methylene protons α- to a double bond (-CH=CHCH2-), at 2.03 ppm, and the bulk CH2methylene protons at 1.3 ppm.
In order to evaluate the reproducibility of the 1H-MRS technique, six subjects (five healthy controls and one patient with osteoporosis) were scanned twice at four vertebral body levels (L1-L4) on the same day with repositioning between the two scans. The repositioning of the subjects was done by the same technologist.
Data analysis
The spectral data were transferred to a workstation immediately after the scan for offline analysis. The spectra from each of the four channels were automatically reconstructed, and then corrected for phase, frequency shift and baseline distortion using an in-house developed software (14). The corrected spectra from each channel of the coil were then combined using sum of squares of the data. Spectral peaks were assigned based on previously published studies (15). Specifically in this study, four peaks were well resolved (Figure 1B): olefinic, double bond -CH=CH- protons at 5.31 ppm, water protons at 4.65 ppm, the CH2methylene protons α- to a double bond (-CH=CHCH2-), at 2.03 ppm, and the bulk CH2methylene protons at 1.3 ppm. These four peaks were fitted in the frequency domain with Voigt models using a non-linear least-squares fitting algorithm (16) and were optimized for marrow spectral data. The fitting parameters included linewidth, amplitude and shift of each peak, and the Voigt model fractional parameter. After fitting, the fat content was calculated as below:
Fat content = Imethylene/(Imethylene + Iwater) × 100%
where Imethylene and Iwater are the signal amplitudes of the bulk methylene peak (1.3 ppm) and the water peak (4.65 ppm), respectively.
Fat content was calculated for each vertebrae. Average fat content (L1-L4) was calculated using all available levels for each participant. No relaxation correction was performed.
Statistical Analysis
The reproducibility of fat content quantification was evaluated using coefficients of variation (CV). Spearman correlation coefficients were calculated between fat contents at each vertebral levels. Generalized linear models (GLM) were used to test the significance of increasing trend in fat content at each vertebral level. One-way analysis of variation (ANOVA) was used to determine whether the fat content was different at any vertebral level. If ANOVA indicated a significant difference, a paired t-test was used to compare fat content between each of the two levels. The marrow fat content between controls and patients, adjusted for age and BMI, was compared using ANOVA. The software R (www.r-project.org/) (17) was used, and the significance level was 0.05.
RESULTS
Subject Characteristics
Table 1 summarizes the characteristics of subjects included in this study.
Table 1.
Participant characteristics (all subjects were post-menopausal female). Data were presented as mean ± SD (range).
| Group | N | Age (years) | BMI (kg/m2) | BMD T Score (Spine) |
BMD T score (Hip) |
|---|---|---|---|---|---|
| Healthy controls | 13# | 57.4 ± 4.4 (54 – 65) | 28.3 ± 4.6 (23 – 35.6) | 1.0 ± 1.7 (−0.7 – 3.4) | 0.02 ± 0.8 (−1.0 – 1.1) |
| Osteoporosis/Osteopenia | 38 | 61.8 ± 4.3* (56 – 73) | 24.5 ± 3.6 (18.4 – 33.2) | −1.6 ± 1.1* (−4.5 – 0.8) | −1.4 ± 0.6* (−2.7 – −0.4) |
Among 13 controls, seven had BMD measured with DXA.
P < 0.05
Reproducibility of marrow fat content measurement
The average CV of fat content measured in the 6 subjects was 1.7% (fat content ranged from 45.5% to 66.1%), suggesting excellent in vivo reproducibility. The CV of fat content at each vertebral level was 1.2%, 1.9%, 2.0% and 1.2% for L1, L2, L3 and L4, respectively.
Marrow fat content at different vertebral levels
Among all participants, 40 had acceptable data at all four levels; seven participants had only three acceptable levels; three participants had only two acceptable levels, and one participant had only one acceptable level. The analysis comparing fat content between each vertebral level was performed in the 40 participants who had data from all four levels.
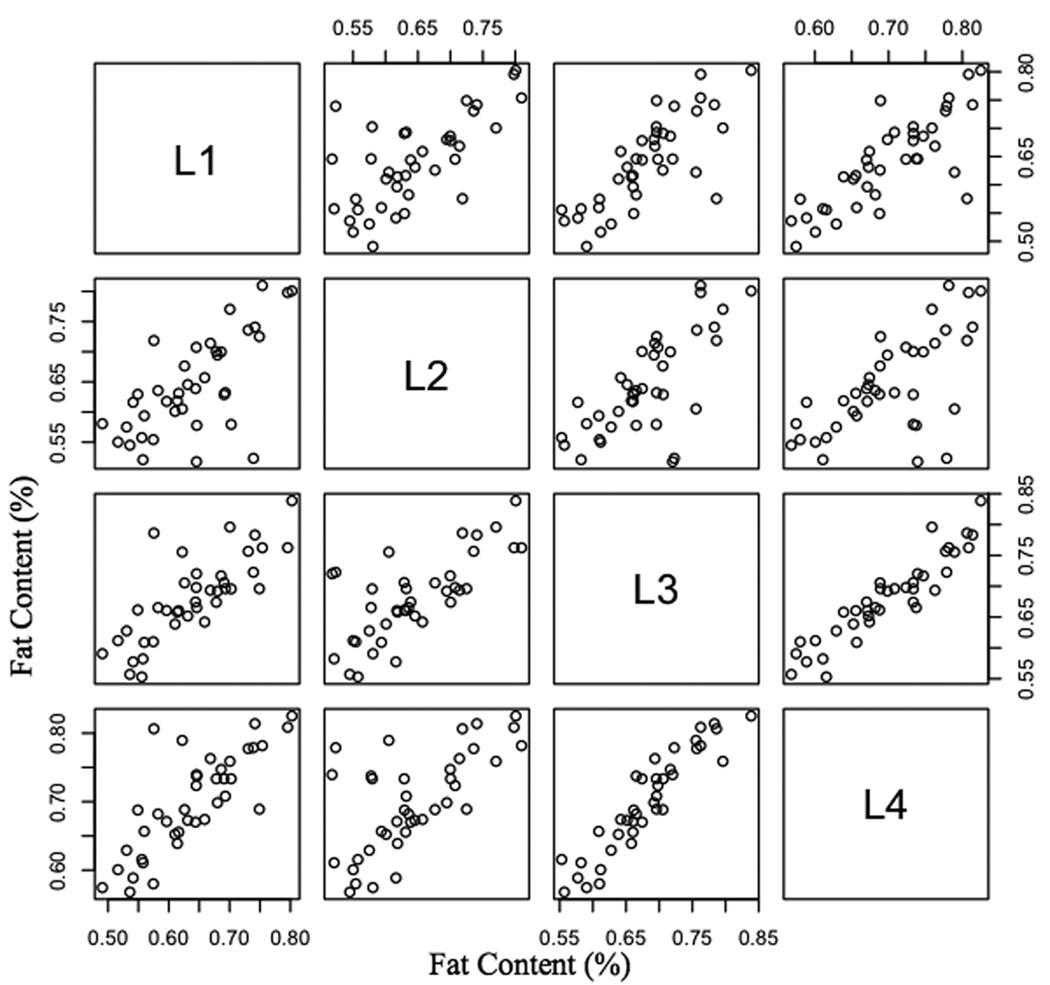
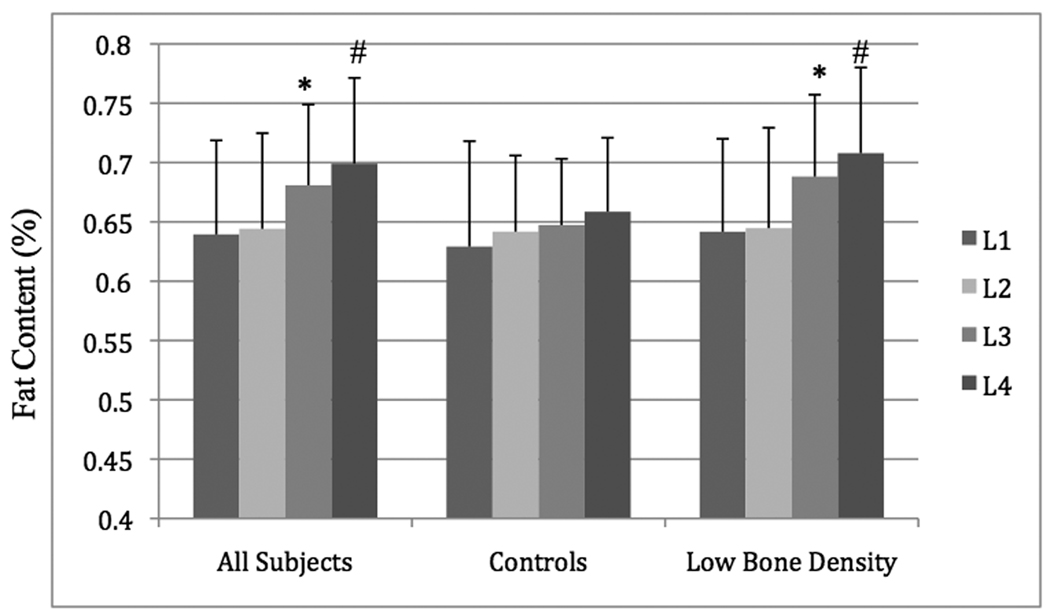
Fat contents at different vertebral levels were significantly correlated to each other, Figure 2, Table 2. There was an increasing trend of marrow fat content from L1 to L4, Figure 3. This increase was not significant in controls (slope = 0.9%, P = 0.23) but was significant in subjects with low bone density (slope = 2.2%, P < 0.0001), adjusted for age and BMI. One-way ANOVA showed that the fat content was significantly different in at least one level with low bone density (P = 0.0007). Specifically, fat contents in L3 were significantly higher than L2 (P = 0.00003), and fat contents in L4 were significantly higher than L3 (P = 0.00001). No significant difference was found between L1 and L2 (P = 0.24).
Figure 2.
Scatter plots of marrow fat contents from L1 to L4, showing fat contents at different vertebral levels are significantly correlated to each other. Table 2 shows the spearman correlation coefficients of marrow fat content at each vertebral levels from L1 to L4.
Table 2.
Spearman correlation coefficients of marrow fat content between each vertebral level (P < 0.001).
| Vertebral Levels | L2 | L3 | L4 |
|---|---|---|---|
| L1 | 0.636 | 0.793 | 0.802 |
| L2 | 0.656 | 0.615 | |
| L3 | 0.937 |
Figure 3.
Bar graph of vertebral fat content at L1, L2, L3 and L4 in all subject, healthy controls, and patients with low bone density. Marrow fat content increased significantly from L1 to L4. In patients with low bone density, the fat content at L3 was significantly higher than at L2, and the fat content at L4 was significantly higher than at L3. Fat content between L1 and L2 was not significantly different. (*P < 0.05 between L2 and L3. #P < 0.05 between L3 and L4.)
Difference in marrow fat content between controls and patients
The average fat content was significantly elevated in patients with low bone density (62.9% ± 6.6% in controls vs. 67.6% ± 6.0% in patients, P = 0.03) as compared to controls, adjusted for age and BMI. Among individual vertebral levels, the difference between controls and patients with low bone density was significant at L3 (P = 0.009) and L4 (P = 0.04), adjusted for age and BMI, but was not significant at L1 and L2 (P > 0.05).
DISCUSSION
We demonstrated in this study that in vivo 1H-MRS at a high field of 3 T is a highly reproducible method for quantitatively and non-invasively evaluating fat contents in vertebral bone marrow. Variations of marrow adiposity between vertebral bodies were also demonstrated. Increased fat contents were found in subjects with low bone density compared to healthy controls.
The major advantages of acquiring spectral data at high field strength are increased SNR and wider spectral dispersion in frequency. Higher SNR allows either higher spatial resolution, i.e., smaller spectral acquisition box in the case of single voxel 1H-MRS, or shorter acquisition time. A small spectral box helps to improve shimming (i.e., the homogeneity of local external field strength) and consequently reduces the line width of the spectral peaks. The shorter acquisition time helps to minimize motion artifacts, and allows time for data acquisition from multiple vertebral bodies rather than only one level.
The wider spectral dispersion at high field increases the spectral resolution and helps to better resolve individual peaks of interest. In particular for bone marrow, a high spectral resolution may be helpful with quantifying other lipid compartments, such as the unsaturated lipids (olefinic double bond –CH=CH- protons) at 5.31 ppm. This peak is partially overlapped with the water peak at 4.65 ppm and glycerol backbone (CH) peak at 5.25 ppm. Yeung et al. suggested that the unsaturation level decreased in osteoporotic subjects as compared to controls using 1H-MRS at 1.5 T (9). In a recent study by Liney et al., the comparison of spectra acquired from 1.5 T versus 3 T (from one subject) showed clear improvement in spectral quality at 3 T with smaller lipid resonances (such as the unsaturated lipids) visible at 3 T that are not distinguishable at 1.5 T (11). In our study, the unsaturated lipids were well resolved, as shown in Figure 1. However, the reproducibility of unsaturation level quantification was less optimal (CV = 10.7%, data not shown). Further development is needed to improve in vivo quantification of unsaturation level before investigating the clinical significance of this parameter.
Despite the advantages that the high field studies provide, it should be noted that the presence of trabecular bone causes broader peaks with bigger line widths due to the magnetic susceptibility effect (6). Further comparison study is needed to prove the benefits of using high field or ultra high field strength to investigate marrow adiposity.
Multiple levels of vertebral bodies were examined in the current study. The fat content was increased from the superior (L1) to inferior (L4) levels. This increasing trend was consistent with a previous report based on 1H-MRS measures (11), in which the authors suggested that such an increase may be reflecting the “peripheral to axial” conversion from red to yellow marrow with increasing age. Our finding of increased marrow fat from L1 to L4 indicates a need for caution in comparing marrow fat results across studies that have measured different vertebral levels.
Interestingly in this study, the increase of fat content from L1 to L4 was not significant in healthy controls, while it is significant in subjects with low bone density. The sample size of controls in this study is small therefore we may be underpowered to observe the significance of fat content increase from L1 to L4 in controls. Further comparison of fat content between vertebral levels in subjects with low bone density showed that the significant increase was primarily driven by the relatively large increase of fat content from L2 to L3 (6.7%). This suggested that during pathology such as osteoporosis, vertebral bodies may experience different adiposity at different levels, potentially due to their different biomechanical and biochemical environment.
To identify which level of vertebrae shows the most marked difference between those with osteoporosis or osteopenia and healthy controls may help with study design for large-scale studies. Although the reproducibility of measurement for each vertebra was comparable, the effect sizes of marrow fat difference between controls and patients were different. Among individual vertebral levels, L3 and L4were significantly higher in the patient groups. The other levels, L1 and L2 had a higher fat content in patients compared to controls, but the difference did not reach significance for this cohort. This preliminary result suggests that L3 and/or L4 could be the optimal level to acquire data if a study is limited to measuring marrow fat at one or two vertebral levels. Larger scale studies are warranted to confirm this finding.
In the present study, significantly elevated vertebral marrow fat content was found in patients with osteoporosis or osteopenia. This result is consistent with findings in many previous 1H-MRS studies (4, 9). Elevated bone marrow adiposity may be an important factor contributing to poor bone quality in post-menopausal women. In vivo quantification of marrow fat will provide valuable complementary information to other methods that examine bone quality in such patients.
Despite promising results, the current study has several limitations. The study cohort is relatively small, especially the healthy controls, and DXA data were not available in a subset of controls. In addition, the controls were younger than the subjects with low bone density. However, our models comparing FC in these two groups were adjusted for age. Larger scale studies are needed to recruit age-matched controls, and to further examine the relationship between marrow adiposity and other bone measures and determine if this relationship differs in those with diabetes.
In conclusion, in vivo 1H-MRS at high field strength provides reliable measurement of marrow adiposity with excellent reproducibility. Marrow adiposity increases from superior to inferior vertebral levels. Marrow fat content is significantly elevated in subjects with low bone density compared to healthy controls. These preliminary data suggest that in vivo 1H-MRS at 3 T may be a valuable tool, providing complementary information on bone quality and potentially also fracture risk.
Acknowledgments
Funding: Roche Inc. (DB, XL, DK); UCSF Research Evaluation and Allocation Committee (REAC) BROOKS Fund (AVS); NIH/NCRR UCSF-CTSI Grant Number UL1 RR024131-01 (AVS); NIH/NIAMS RC1AR058405-01 (TML)
Contributor Information
Xiaojuan Li, Email: xiaojuan.li@ucsf.edu.
Daniel Kuo, Email: dankuo@gmail.com.
Anne L. Schafer, Email: Anne.Schafer@ucsf.edu.
Anne Porzig, Email: Anne.Porzig@ucsf.edu.
Thomas M. Link, Email: Thomas.Link@ucsf.edu.
Dennis Black, Email: dblack@psg.ucsf.edu.
Ann V. Schwartz, Email: aschwartz@psg.ucsf.edu.
REFERENCES
- 1.Rosen CJ, Ackert-Bicknell C, Rodriguez JP, Pino AM. Marrow fat and the bone microenvironment: developmental, functional, and pathological implications. Crit Rev Eukaryot Gene Expr. 2009;19(2):109–124. doi: 10.1615/critreveukargeneexpr.v19.i2.20. PMCID: 2674609. [DOI] [PMC free article] [PubMed] [Google Scholar]
- 2.Moerman EJ, Teng K, Lipschitz DA, Lecka-Czernik B. Aging activates adipogenic and suppresses osteogenic programs in mesenchymal marrow stroma/stem cells: the role of PPAR-gamma2 transcription factor and TGF-beta/BMP signaling pathways. Aging Cell. 2004;3(6):379–389. doi: 10.1111/j.1474-9728.2004.00127.x. PMCID: 1850101. [DOI] [PMC free article] [PubMed] [Google Scholar]
- 3.Sottile V, Seuwen K, Kneissel M. Enhanced marrow adipogenesis and bone resorption in estrogen-deprived rats treated with the PPARgamma agonist BRL49653 (rosiglitazone) Calcif Tissue Int. 2004;75(4):329–337. doi: 10.1007/s00223-004-0224-8. [DOI] [PubMed] [Google Scholar]
- 4.Griffith J, Yeung D, Antonio G, Lee F, Hong A, Wong S, et al. Vertebral bone mineral density, marrow perfusion, and fat content in healthy men and men with osteoporosis: dynamic contrast-enhanced MR imaging and MR spectroscopy. Radiology. 2005;236(3):945–951. doi: 10.1148/radiol.2363041425. [DOI] [PubMed] [Google Scholar]
- 5.Schellinger D, Lin CS, Fertikh D, Lee JS, Lauerman WC, Henderson F, et al. Normal lumbar vertebrae: anatomic, age, and sex variance in subjects at proton MR spectroscopy--initial experience. Radiology. 2000;215(3):910–916. doi: 10.1148/radiology.215.3.r00jn42910. [DOI] [PubMed] [Google Scholar]
- 6.Machann J, Stefan N, Schick F. (1)H MR spectroscopy of skeletal muscle, liver and bone marrow. Eur J Radiol. 2008;67(2):275–284. doi: 10.1016/j.ejrad.2008.02.032. [DOI] [PubMed] [Google Scholar]
- 7.Schellinger D, Lin CS, Hatipoglu HG, Fertikh D. Potential value of vertebral proton MR spectroscopy in determining bone weakness. AJNR Am J Neuroradiol. 2001;22(8):1620–1627. [PMC free article] [PubMed] [Google Scholar]
- 8.Kugel H, Jung C, Schulte O, Heindel W. Age- and sex-specific differences in the 1H-spectrum of vertebral bone marrow. J Magn Reson Imaging. 2001;13(2):263–268. doi: 10.1002/1522-2586(200102)13:2<263::aid-jmri1038>3.0.co;2-m. [DOI] [PubMed] [Google Scholar]
- 9.Yeung D, Griffith J, Antonio G, Lee F, Woo J, Leung P. Osteoporosis is associated with increased marrow fat content and decreased marrow fat unsaturation: a proton MR spectroscopy study. J Magn Reson Imaging. 2005;22(2):279–285. doi: 10.1002/jmri.20367. [DOI] [PubMed] [Google Scholar]
- 10.Blake G, Griffith J, Yeung D, Leung P, Fogelman I. Effect of increasing vertebral marrow fat content on BMD measurement, T-Score status and fracture risk prediction by DXA. Bone. 2008 doi: 10.1016/j.bone.2008.11.003. Epub ahead of print. [DOI] [PubMed] [Google Scholar]
- 11.Liney G, Bernard C, Manton D, Turnbull L, Langton C. Age, gender, and skeletal variation in bone marrow composition: a preliminary study at 3.0 Tesla. J Magn Reson Imaging. 2007;26(3):787–793. doi: 10.1002/jmri.21072. [DOI] [PubMed] [Google Scholar]
- 12.Griffith JF, Yeung DK, Chow SK, Leung JC, Leung PC. Reproducibility of MR perfusion and (1)H spectroscopy of bone marrow. J Magn Reson Imaging. 2009;29(6):1438–1442. doi: 10.1002/jmri.21765. [DOI] [PubMed] [Google Scholar]
- 13.Bredella MA, Fazeli PK, Miller KK, Misra M, Torriani M, Thomas BJ, et al. Increased bone marrow fat in anorexia nervosa. J Clin Endocrinol Metab. 2009;94(6):2129–2136. doi: 10.1210/jc.2008-2532. PMCID: 2690416. [DOI] [PMC free article] [PubMed] [Google Scholar]
- 14.Nelson SJ. Analysis of volume MRI and MR spectroscopic imaging data for the evaluation of patients with brain tumors. Magn Reson Med. 2001;46(2):228–239. doi: 10.1002/mrm.1183. [DOI] [PubMed] [Google Scholar]
- 15.Ren J, Dimitrov I, Sherry AD, Malloy CR. Composition of adipose tissue and marrow fat in humans by 1H NMR at 7 Tesla. J Lipid Res. 2008;49(9):2055–2062. doi: 10.1194/jlr.D800010-JLR200. PMCID: 2515528. [DOI] [PMC free article] [PubMed] [Google Scholar]
- 16.Li X, Nelson SJ, editors. Reliable in vivo Lactate and Lipid Estimation in Glioma Patients. 25th Annual Inter Conf of IEEE Eng in Medicine and Biology Society (EMBS); 2003 September; Cancun, Mexico. [Google Scholar]
- 17.Verzani J. Using R for Introductory Statistics. Raton, FL: Chapman & Hall/CRC; 2005. [Google Scholar]


