Abstract
Objective
This study sought to determine whether renovating low-income housing using “green” and healthy principles improved resident health and building performance.
Methods
We investigated resident health and building performance outcomes at baseline and one year after the rehabilitation of low-income housing using Enterprise Green Communities green specifications, which improve ventilation; reduce moisture, mold, pests, and radon; and use sustainable building products and other healthy housing features. We assessed participant health via questionnaire, provided Healthy Homes training to all participants, and measured ventilation, carbon dioxide, and radon.
Results
Adults reported statistically significant improvements in overall health, asthma, and non-asthma respiratory problems. Adults also reported that their children's overall health improved, with significant improvements in non-asthma respiratory problems. Post-renovation building performance testing indicated that the building envelope was tightened and local exhaust fans performed well. New mechanical ventilation was installed (compared with no ventilation previously), with fresh air being supplied at 70% of the American Society of Heating, Refrigerating, and Air-Conditioning Engineers standard. Radon was <2 picocuries per liter of air following mitigation, and the annual average indoor carbon dioxide level was 982 parts per million. Energy use was reduced by 45% over the one-year post-renovation period.
Conclusions
We found significant health improvements following low-income housing renovation that complied with green standards. All green building standards should include health requirements. Collaboration of housing, public health, and environmental health professionals through integrated design holds promise for improved health, quality of life, building operation, and energy conservation.
Low-income families are more likely to encounter environmental health and safety hazards in their homes and communities and are, therefore, disproportionately affected by environmental diseases.1,2 Low-income children are eight times more likely to suffer from lead poisoning,3 and childhood asthma rates are higher in low-income communities.4 Housing affects health directly and indirectly, and the burden of housing-related diseases and injuries is substantial.5 Physical, chemical, and biological exposures in the home that produce adverse health outcomes and associated housing interventions have been reviewed elsewhere.6–9 Data are needed to elucidate the complex links between health, buildings, and communities to enable building owners, community planners, and others to more confidently implement health-based housing interventions. This study sought to determine whether renovating low-income housing using green and healthy principles improved resident health and building performance.
Several different “green” rating systems have appeared recently, including Enterprise Green Communities Criteria,10 U.S. Environmental Protection Agency's (EPA's) Energy Star Plus Indoor Air Program (Indoor airPLUS),11 and Leadership in Energy and Environmental Design (LEED).12 While such systems may improve health, evidence to support this claim is sparse. The definition of “green” construction is fluid and developing. These leading green building systems differ greatly with regard to whether health aspects of green are required or optional. For example, the Enterprise Green Communities standards used in the renovation described in this study include several required health-related specifications, while LEED only provides a certain number of optional points for health items.
Although two earlier studies demonstrated significant respiratory health improvements in new green construction,13,14 this is the first study to investigate whether renovating low-income housing using green principles improves resident health.
METHODS
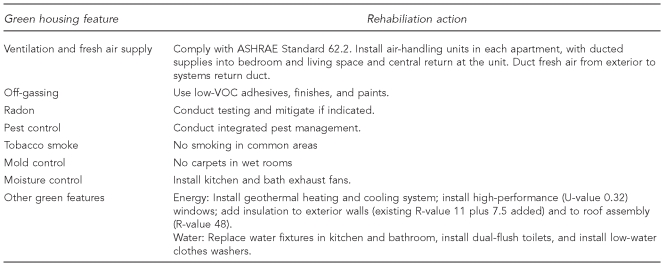
A three-building, 60-unit apartment complex in southwest Minnesota underwent substantial green renovation in 2006–2007, complying with the voluntary Enterprise Green Communities Criteria,10 which cover eight renovation areas: integrated design process, location and neighborhood fabric, site, water conservation, energy conservation, materials and resources, healthy living environment, and operations and management. Of the housing improvements conducted, eight were health-related (Figure 1).
Figure 1.
Health-related green housing rehabilitation features: Green Housing Renovation Study, Minnesota, 2006–2008
ASHRAE = American Society of Heating, Refrigerating, and Air-Conditioning Engineers
VOC = volatile organic compound
We administered a structured health interview to assess self-reported health status of participating adults and children. The health interview was adapted from the Centers for Disease Control and Prevention's (CDC's) annual National Health Interview Survey,15 CDC's Behavioral Risk Factor Surveillance System,16 and the National Institute of Environmental Health Sciences' National Survey of Lead and Allergens in Housing (sponsored in conjunction with the U.S. Department of Housing and Urban Development [HUD]).17
Interviews were administered one to four months after residents moved into renovated apartments and were repeated 12 to 18 months later. We assessed pre-renovation health status through respondent recall at this interview, which included questions concerning housing characteristics, demographics, cleaning practices, smoking history, respiratory health, and physical injury. One adult per dwelling was interviewed and provided information on his or her health and the health of other resident adults and children. Study data collection began in November 2006 and was completed in September 2008.
Time 0 (T0) refers to the residents' recall of conditions in their old homes prior to renovation; time 1 (T1) refers to the first study visit, which occurred an average of 67 days after people moved into the renovated apartments; and time 2 (T2) refers to the follow-up visit approximately 12 to 18 months later. Following each interview, residents received training on maintaining a healthy home using a HUD booklet focusing on methods of keeping housing dry, clean, pest-free, safe, contaminant-free, ventilated, and maintained.18
Building performance testing was conducted in the third renovated building (the only one that was vacant after renovation was complete but before re-occupancy) to compare it with design criteria and building standards. The renovated air-handling system was designed to supply outdoor air to individual apartments, instead of the pre-renovation system, which supplied outdoor air only through unplanned building envelope leakage. Airflow was measured with the air handler running continuously. Total building shell leakage was measured using a calibrated blower door, which was also used to test two apartments. Inlet airflow was tested during operation of the air handler, bathroom exhaust fans, and kitchen exhaust fans. Kitchen and bathroom exhaust fan airflows were compared with design specifications. Duct return airflows and duct leakage from the total air-handling system were evaluated using a duct blaster. Interstitial pressures were measured between rooms within individual units, with interior doors closed if rooms were positively pressured and opened if neutral or negatively pressured relative to the main living space. Pressure tests were conducted to determine if return air within living areas was adequate.
We placed three-day radon test dosimeters in 25 locations in the three buildings before renovation. After renovation but before any radon mitigation, alpha-track long-term (approximately 90-day) radon dosimeters were placed in 17 locations in two buildings. After radon mitigation in two buildings, 90-day dosimeters were placed in 26 locations. Using Onset® HOBO data loggers (Onset Computer Corp., Bourne, Massachusetts), carbon dioxide (CO2) levels were tracked in the living space of four units for approximately 12 months post-renovation. Funding limitations prevented testing more units. CO2 data were retrieved quarterly and compared with the commonly used indoor air quality guideline of 1,000 parts per million (ppm) to determine if fresh air ventilation was adequate.19–21
We analyzed utility bills to determine overall energy use and carbon gas emissions before renovation and one year after renovation. Total annual energy use (measured in kilo British thermal units per year [kBTU/yr]) was divided by the square footage (ft2) of the conditioned space and heating degree days (HDD) to compensate for yearly weather fluctuations (kBTU/HDD/ft2/yr). When utility bill data were missing for individual apartments, we estimated energy use by using average energy use for the same unit type.
For interview questions that could be answered either yes or no, we used McNemar's test to test the hypothesis that the percent of people answering yes to a question was different at two specific times. When all people had the same responses at both times, the p-value could be calculated. The binomial test of proportion was used to test the hypothesis that the proportion of respondents with better health was different from the proportion reporting worse health. For questions that could be answered with a multiple list of options representing some order of intensity (e.g., whether general health was “very good/excellent,” “good,” or “fair/poor”), we used the Cochran-Mantel-Haenszel row mean score test for ordinal variables to test the hypothesis that the means at two specific times were significantly different. When comparing interview data at two different time periods, we first matched data for both participants and apartments. Statistical significance was defined as p<0.05 and marginal significance as 0.05≤p<0.1. We did not control for multiple testing.
RESULTS
Thirty-one (31) of the 54 occupied units (57%) were enrolled in the study. Due to differing start times for building renovation and the study, residents could not be interviewed before renovation, so baseline data were based on recall. At the initial visit, residents had lived in their newly renovated apartments less than one month to approximately four months. Housing data for T0 and T1 were gathered for 31 units. Interviewed adults from 29 apartments provided T0 and T1 health data about themselves, 21 other adults, and 30 children younger than 18 years of age residing in these apartments. Fifteen (52%) of the 29 apartments that provided T0 and T1 health data had children. Residents in 18 of the 31 units agreed to participate in the T2 follow-up visit, a retention rate of 58%. The 18 interviewed adults provided T2 data for themselves, six other adults, and 17 children living in these apartments. Nine (50%) of the 18 apartments had children at T2. Of the 17 children, two were 17 years old at the T1 visit and 18 years old at the T2 visit.
Demographic data
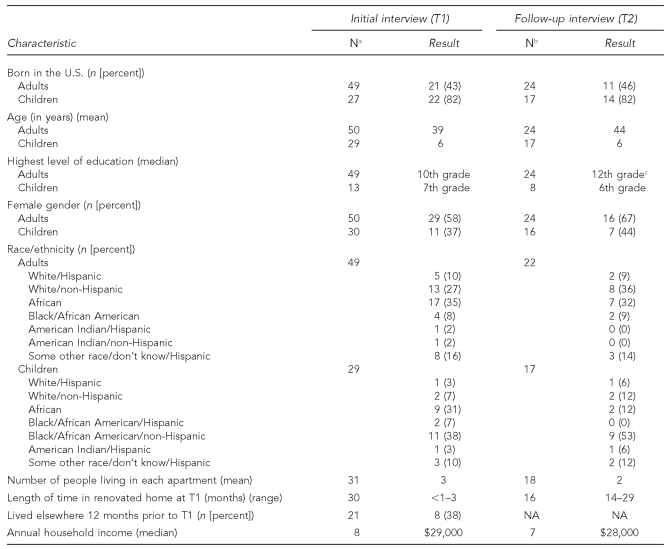
Study participants were largely immigrants of minority race/ethnicity and all low-income (Table 1). Less than half (43%) of the adults but most (82%) of the children were born in the U.S. Most adults were either white (37%) or African (not African American) (35%). Mean annual household income was $29,000. There were no statistically significant differences in resident demographics between T1 and T2 (all p>0.1).
Table 1.
Demographic data of participants: Green Housing Renovation Study, Minnesota, 2006–2008
aAlthough some T1 data were reported for 50 adults and 30 children in 31 homes, some values were missing.
bAlthough some T2 data were reported for 24 adults and 17 children in 18 homes, some values were missing.
cTwo residents that were children at T1 were adults at T2.
T1 = time 1 (refers to the first study visit, which occurred an average of 67 days after people moved into the renovated apartments)
T2 = time 2 (refers to the follow-up visit approximately 12 to 18 months after people moved into the renovated apartments)
NA = not applicable
Adult health
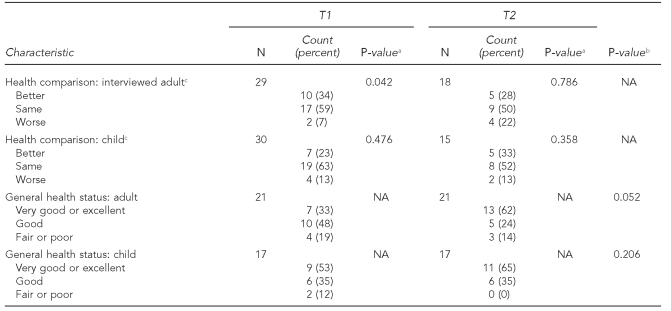
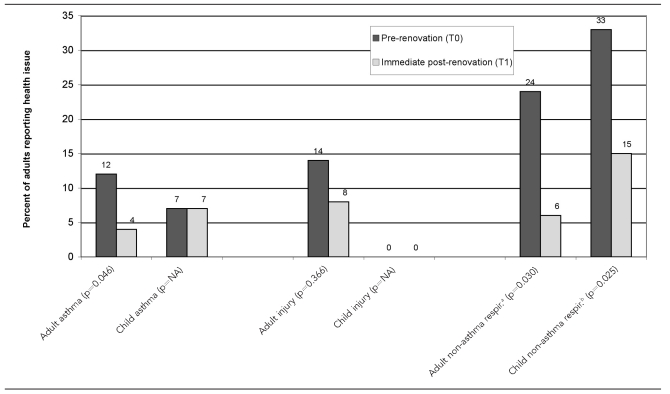
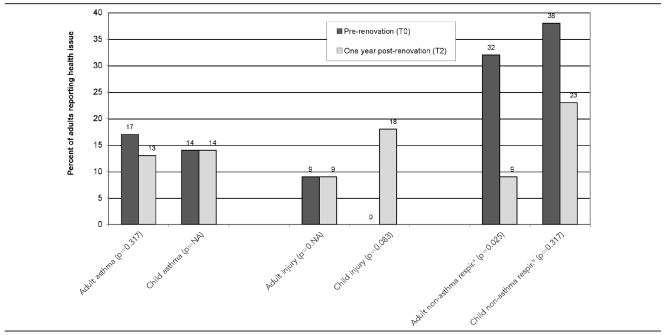
More adults reported better vs. worse overall health at T1 compared with T0 (34% vs. 7%; p=0.042; Table 2). Adult health status was better at T2 than T1 (p=0.052). Sixty-two percent reported that adult health was very good/excellent at T2, compared with 33% at T1. Those reporting health status as fair/poor decreased from 19% at T1 to 14% at T2. The percentage of adults reporting several specific health problems significantly improved from T0 to T1 (Figure 2) for asthma (p=0.046) and non-asthma respiratory problems (p=0.030). Improvements in reports of non-asthma respiratory problems (p=0.025) remained significant from T0 to T2 (Figure 3). For adults, non-asthma respiratory problems included emphysema, hay fever, sinusitis, and chronic bronchitis.
Table 2.
General health data for adults and children: Green Housing Renovation Study, Minnesota, 2006–2008
aP-value from the binomial test of proportion that the percent with better health is greater than the percent with worse
bP-value from the Cochran-Mantel-Haenszel row mean score test (for ordinal variables) that there was a difference in the means at T1 and T2
cAt T1 respondents were asked about changes from time 0. At T2 respondents were asked about changes from T1.
T1 = time 1 (refers to the first study visit, which occurred an average of 67 days after people moved into the renovated apartments)
T2 = time 2 (refers to the follow-up visit approximately 12 to 18 months after people moved into the renovated apartments)
NA = not applicable
Figure 2.
Change in reports of specific adult (n=49) and child (n=27) health issues, pre-renovation (T0) vs. immediate post-renovation (T1): Green Housing Renovation Study, Minnesota, 2006–2008
aFor adults, non-asthma respiratory problems include emphysema, hay fever, sinusitis, and chronic bronchitis.
bFor children, non-asthma respiratory problems include hay fever, sinusitis, chronic bronchitis, ear infections, and respiratory allergies.
T0 = time 0 (refers to the residents' recall of conditions in their old home prior to renovation)
T1 = time 1 (refers to the first study visit, which occurred an average of 67 days after people moved into the renovated apartments)
NA = not applicable
Figure 3.
Change in reports of specific adult (n=22) and child (n=13) health issues, pre-renovation (T0) vs. one year post-renovation (T2): Green Housing Renovation Study, Minnesota, 2006–2008
aFor adults, non-asthma respiratory problems include emphysema, hay fever, sinusitis, and chronic bronchitis.
bFor children, non-asthma respiratory problems include hay fever, sinusitis, chronic bronchitis, ear infections, and respiratory allergies.
T0 = time 0 (refers to the residents' recall of conditions in their old home prior to renovation)
T2 = time 2 (refers to the follow-up visit approximately 12 to 18 months after people moved into the renovated apartments)
NA = not applicable
Child health
More children had better overall health vs. worse health at T1 than T0, although the difference was not significant (23% vs. 13%; p=0.476; Table 2). Reports of general child health status did not significantly change when comparing T1 to T2 (p=0.206). The percentage of children with non-asthma respiratory problems improved from 33% to 15% between T0 and T1 (p=0.025) (Figure 2). For children, non-asthma respiratory problems included hay fever, sinusitis, chronic bronchitis, ear infections, and respiratory allergies. At T0 and T1, only 7% of children reportedly had doctor-diagnosed asthma.
Housing condition
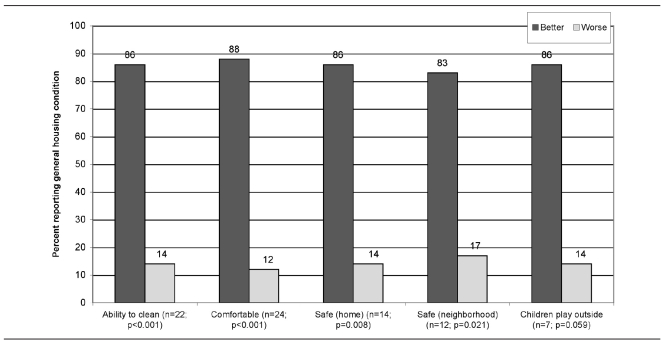
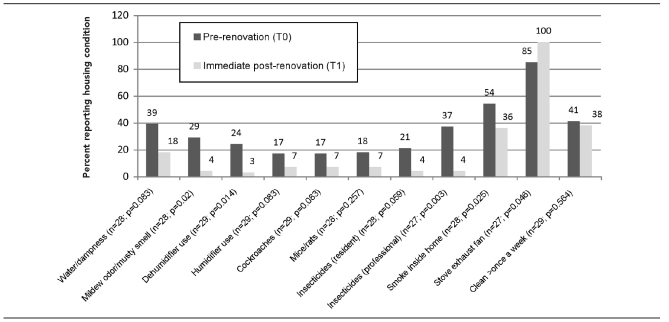
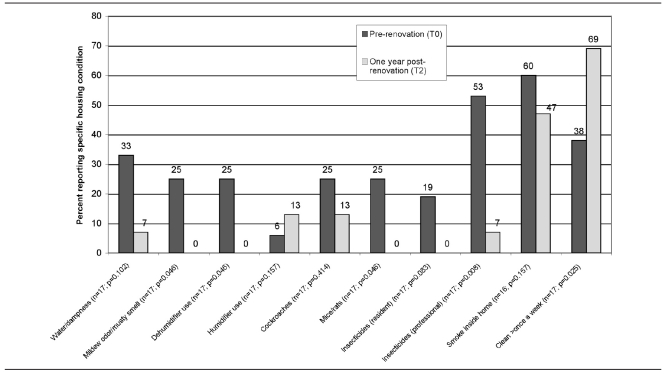
The majority of people reported that their newly renovated homes at T1 were easier to clean (p<0.001), more comfortable (p<0.001), and safer (p=0.008) than their old homes at T0; their neighborhood was safer (p=0.021); and their children played outside more (p=0.059) (Figure 4). At T1, significantly fewer people reported that their renovated homes had a mildew odor/musty smell (p=0.020) or evidence of water/dampness (p=0.083) (Figure 5). At T2, only one person reported dampness, and none reported mildew odors/musty smells (Figure 6).
Figure 4.
Changes in reports of general housing condition (better vs. worse), pre-renovation (T0) vs. immediate post-renovation (T1): Green Housing Renovation Study, Minnesota, 2006–2008
T0 = time 0 (refers to the residents' recall of conditions in their old home prior to renovation)
T1 = time 1 (refers to the first study visit, which occurred an average of 67 days after people moved into the renovated apartments)
Figure 5.
Changes in reports of specific housing conditions, pre-renovation (T0) to immediate post-renovation (T1): Green Housing Renovation Study, Minnesota, 2006–2008
T0 = time 0 (refers to the residents' recall of conditions in their old home prior to renovation)
T1 = time 1 (refers to the first study visit, which occurred an average of 67 days after people moved into the renovated apartments)
Figure 6.
Changes in specific housing conditions, pre-renovation (T0) to one year post-renovation (T2): Green Housing Renovation Study, Minnesota, 2006–2008
T0 = time 0 (refers to the residents' recall of conditions in their old home prior to renovation)
T2 = time 2 (refers to the follow-up visit approximately 12 to 18 months after people moved into the renovated apartments)
The percentage of residents reporting a cockroach problem marginally improved at T1 compared with T0 (p=0.083; Figure 5). From T0 to T1, the use of insecticides by either residents or exterminators/maintenance personnel significantly improved (p=0.059 and p=0.003, respectively). At T2, only two people still reported having cockroach problems, and none reported using insecticides at home (Figure 6). The percentage of residents reporting mice/rat problems in the previous 12 months decreased from T0 to T2 (p=0.046).
From T0 to T1, fewer people reported smoke inside their homes due to incense, cigarettes, cigars, pipes, wood fires, or non-tobacco cigarettes (p=0.025) (Figure 5). The percentage increased slightly between T0 and T2, but not significantly (p=0.157) (Figure 6).
Building performance testing and indoor CO2
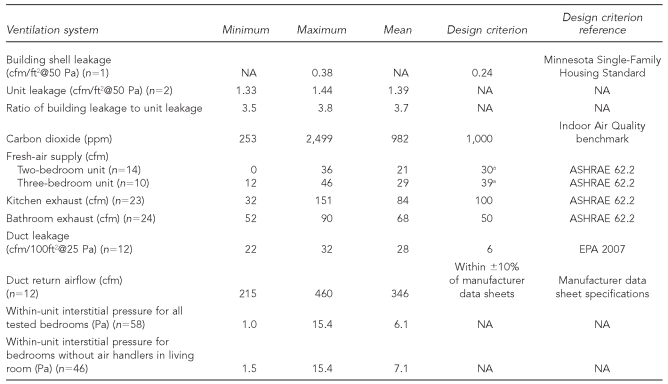
Blower door testing showed building air leakage was 0.38 cubic feet per minute per square foot at 50 pascals (cfm/ft2@50 Pa) (Table 3), higher than the current standard for Minnesota single family housing of 0.24 cfm/ft2@50 Pa.22 The mean leakage in individual units was 3.7 times greater than that for the building. Mean fresh air supply rates to individual units were 21 cfm and 29 cfm for two- and three-bedroom units, respectively, approximately 70% of the American Society of Heating, Refrigerating, and Air-Conditioning Engineers (ASHRAE) 62.2 standards of 30 cfm and 39 cfm, respectively.23 The mean annual level of CO2 was 982 ppm, slightly less than the 1,000 ppm guideline. The mean kitchen exhaust fan high-speed airflow of 84 cfm was slightly below ASHRAE's 100-cfm standard, but the mean bathroom exhaust airflow of 68 cfm exceeded ASHRAE's 50-cfm standard. The mean measured return airflow for tested air handlers was 346 cfm, within 10% of manufacturer-specified values. However, the mean duct leakage was 28 cfm/100ft2@25 Pa, more than 3.5 times higher than EPA's Indoor airPLUS new construction criterion of 6 cfm/100ft2@25 Pa.11 The bedrooms were under positive pressure with the ventilation system on, contrary to design specifications.
Table 3.
Building ventilation performance results: Green Housing Renovation Study, Minnesota, 2006–2008
aASHRAE 62.2 ventilation rate is calculated according to the following equation: (number of bedrooms + 1) 3 (7.5 cfm) + (square feet 3 0.01 cfm).
cfm = cubic feet per minute
ft2 = square foot
Pa = Pascal
NA = not applicable
ppm = parts per million
ASHRAE = American Society of Heating, Refrigerating, and Air-Conditioning Engineers
EPA = Environmental Protection Agency
Radon
Of the 25 areas having pre-renovation short-term radon tests, seven had radon levels equal to or greater than the EPA's 4-picocuries-per-liter (pCi/L) action level (Table 4).24 Because the renovation included sealing of all basement foundation cracks, radon mitigation was not included in the original renovation. But post-renovation long-term measurements conducted before radon mitigation yielded two of 17 tested areas with levels greater than 4 pCi/L; therefore, radon -mitigation was added. The mitigation utilized the existing foundation drain tile and sub-slab plumbing along with fan-powered exterior vertical stacks to vent soil gas outdoors. Post-mitigation long-term average radon levels were 0.7 pCi/L, with no test results exceeding 4 pCi/L.
Table 4.
Radon testing results (pCi/L): Green Housing Renovation Study, Minnesota, 2006–2008
a4 pCi/L = Environmental Protection Agency action level
pCi/L = picocuries per liter
Energy use
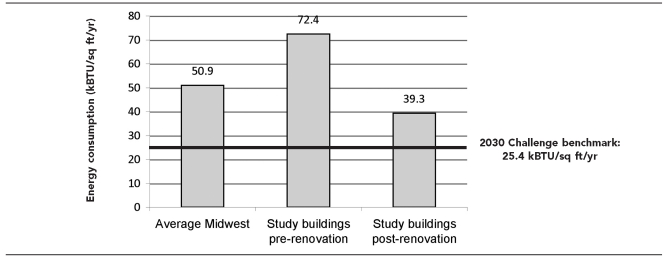
The annual complex-wide post-renovation combined electric/natural gas energy use was 5.05 BTU/HDD/ft2/yr compared with 9.76 BTU/HDD/ft2/yr for pre-renovation, a 48% reduction. Without considering HDD, the total combined one-year post-renovation electric and natural gas energy use was 39.3 kBTU/ft2/yr (Figure 7; October 2007 through September 2008). This result, while well below the pre-renovation energy use of 72.4 kBTU/ ft2/yr, was 56% higher than the Architecture 2030 Challenge benchmark of 25.4 kBTU/ft2/yr set for U.S. Midwest residential projects of five or more units.25 Differentiation of energy use intensity by end use could not be determined due to overlapping end use from the same sources. Electricity use combines household use with all heating, cooling, and ventilation energy.
Figure 7.
One-year post-intervention total building energy consumption—electricity and natural gas combined: Green Housing Renovation Study, Minnesota, 2006–2008
kBTU/sq ft/yr = kilo British thermal unit per square foot per year
DISCUSSION
Primary drivers of the green building movement are improved energy conservation and reduced carbon emissions. In the 1970s, some of the first energy efficiency efforts yielded major indoor air-quality problems.26 By contrast, this study yielded improvements in energy efficiency, health, and indoor environmental quality. However, retrofitting ventilation systems in buildings that previously relied solely on building leakage for fresh air supply is difficult. Even the most well-designed renovation needs post-renovation commissioning, including building performance testing. Study data suggest that had the buildings achieved the full ASHRAE-specified fresh air rates, average CO2 levels, which were only barely below the benchmark of 1,000 ppm, may have been lower.
Results also suggest that the benefits of improved housing for low-income households likely include significant health cost reductions and could contribute to health-care cost containment, not to mention reduced suffering from avoidable illnesses.
Limitations
This study had several limitations. First, it was difficult to discern whether health improvements were due to the nature of “green” renovation vs. “normal” renovation. In Minnesota and other jurisdictions, most federal- and state-assisted renovations are mandated “green,” making this distinction less important. Another limitation was that one adult answered the health questions for children and other adults in the apartment, potentially introducing bias. Cultural differences between interviewers and interviewees may have caused misunderstanding of some questions. While 14 households required no translation services, the rest did. Self-reported health at two points in time may be subject to recall bias and uncertainty, especially because, due to the timing of study funding, residents interviewed had to recall pre-renovation health and housing information just after renovation was complete. Although evidence indicates that recall reports were reasonably well-correlated with actual health,27 future studies should endeavor to find funds for rehabilitation and research simultaneously so that baseline data can be gathered before renovation begins.
For the building performance testing, the fact that fresh-air delivery was lower than design specifications was likely due to complex pressure differentials, making air more likely to be drawn from adjacent units than from outside. Although the building shell was made tighter, interior walls were not sealed during renovation, potentially causing increased odor or smoke migration between apartments, a common post-renovation resident complaint. Duct leakage was high because the contractor failed to seal each duct joint. These findings led to retrofits, which may have cost less if implemented during the original rehabilitation. Some ventilation systems did not perform to design specifications, likely due to limited equipment choices/sizing options, budgetary constraints, and existing building characteristics. Ventilation design could be improved by using a secondary energy-efficient fan in the fresh-air duct to improve airflow volume and an intermittent timer-cycling thermostat to ensure regular fresh-air delivery. The high positive pressures within each unit could drive air and moisture into exterior walls or ceiling assemblies, potentially causing future deterioration and mold problems. In each unit, the design team installed a transfer grill linking bedrooms to the living spaces, creating a return path and equalizing pressure. Future projects with central air return options should include jump-ducting or transfer grills with light and acoustic dampening grills.
At the design stage, no protocols existed for conducting radon tests and mitigation in multifamily buildings. The American Association of Radon Scientists and Technologists is working to develop protocols for multifamily testing and mitigation. Minnesota has adopted mandatory radon construction techniques for single-family new construction, and Minnesota Housing requires radon-resistant construction for new multifamily housing in EPA Radon Zone 1. Had radon mitigation been included in the original renovation instead of retrofitting, costs would have been reduced.
Overall, building performance results demonstrate that sufficient planning at the design stage and immediate post-renovation testing are essential to ensure that building ventilation works as intended. Building performance testing results underscore the need for early formation of an integrated design team (including architecture, engineering, environment, public health, and other expertise) to yield more cost-effective results.
The statistical strength of future studies could be improved by larger enrollment and the use of both medical data and self-reported data to evaluate health outcomes. Although it would have been preferable to account for the lack of independence of health reports between residents in the same apartment, this was not possible due to the small study sample size. Initial interviews indicated that participants were generally in good health at the start of the study, possibly indicating that healthier people agreed to participate. A larger sample size and a baseline population in poorer health may have shown additional health improvements.
CONCLUSIONS
The green renovation produced improvements in resident health, particularly adults, whose overall health, asthma, and non-asthma respiratory problems significantly improved during the one- to four-month follow-up period. Adults' non-asthma respiratory problems also improved one year post-renovation. Children's non-asthma respiratory problems improved during the one- to four-month and one-year follow-up periods. Exposures to radon declined, children played outside more, and security and ventilation were improved. Energy use declined dramatically. The renovations yielded improved housing conditions, making homes easier to clean, more comfortable, and safer both inside the apartment and in the community. There were fewer moisture and dampness issues, little or no pest problems, and less smoke indoors. All green housing standards should include health-related requirements. Integrated design teams could yield more sustainable, energy-efficient, and healthy housing.
Acknowledgments
The authors acknowledge the following project partners for their contributions to this study: the building residents and property managers, Southwest Minnesota Housing Partnership, Minnesota Green Communities, Greater Minnesota Housing Fund, University of Minnesota Center for Sustainable Building Research, and National Center for Healthy Housing. Study funding was provided by the Blue Cross Blue Shield of Minnesota Foundation, the U.S. Environmental Protection Agency, and Enterprise Community Partners.
REFERENCES
- 1.Jacobs DE. Environmental health disparities in housing. Am J Public Health. 2011 doi: 10.2105/AJPH.2010.300058. In press. [DOI] [PMC free article] [PubMed] [Google Scholar]
- 2.Krieger J, Higgins DL. Housing and health: time again for public health action. Am J Public Health. 2002;92:758–68. doi: 10.2105/ajph.92.5.758. [DOI] [PMC free article] [PubMed] [Google Scholar]
- 3.Blood lead levels—United States, 1999–2002. MMWR Morb Mortal Wkly Rep. 2005;54(20):513–6. [PubMed] [Google Scholar]
- 4.Mannino DM, Homa DM, Akinbami LJ, Moorman JE, Gwynn C, Redd SC. Surveillance for asthma—United States, 1980–1999. MMWR Surveill Summ. 2002;51(1):1–13. [PubMed] [Google Scholar]
- 5.World Health Organization. Report of the WHO technical workshop on quantifying disease from inadequate housing, Bonn, Germany, 28–30 November 2005. Geneva: WHO; 2006. [Google Scholar]
- 6.Jacobs DE, Brown MJ, Baeder A, Sucosky MS, Margolis S, Hershovitz J, et al. A systematic review of housing interventions and health: introduction, methods, and summary findings. J Public Health Manag Pract. 2010;16(5 Suppl):S5–10. doi: 10.1097/PHH.0b013e3181e31d09. [DOI] [PubMed] [Google Scholar]
- 7.Krieger J, Jacobs DE, Ashley PJ, Baeder A, Chew GL, Dearborn D, et al. Housing interventions and control of asthma-related indoor biologic agents: a review of the evidence. J Public Health Manag Pract. 2010;16(5) Suppl:S11–20. doi: 10.1097/PHH.0b013e3181ddcbd9. [DOI] [PMC free article] [PubMed] [Google Scholar]
- 8.Sandel M, Baeder A, Bradman A, Hughes J, Mitchell C, Shaughnessy R, et al. Housing interventions and control of health-related chemical agents: a review of the evidence. J Public Health Manag Pract. 2010;16(5) Suppl:S24–33. doi: 10.1097/PHH.0b013e3181e3cc2a. [DOI] [PubMed] [Google Scholar]
- 9.DiGuiseppi C, Jacobs DE, Phelan KJ, Mickalide AD, Ormandy D. Housing interventions and control of injury-related structural deficiencies: a review of the evidence. J Public Health Manag Pract. 2010;16(5) Suppl:S34–43. doi: 10.1097/PHH.0b013e3181e28b10. [DOI] [PMC free article] [PubMed] [Google Scholar]
- 10.Enterprise Community Partners. Enterprise Green Communities Criteria. 2005. [cited 2009 Nov 30]. Available from: URL: http://www.greencommunitiesonline.org/tools/criteria/index.asp.
- 11.Environmental Protection Agency (US). Indoor airPLUS construction specifications. [cited 2009 Nov 30]. Available from: URL: http://www.epa.gov/indoorairplus/construction_specifications.html.
- 12.U.S. Green Building Council, Leadership for Environment and Energy Design (LEED). LEED rating systems. [cited 2009 Nov 30]. Available from: URL: http://www.usgbc.org/DisplayPage.aspx?CMSPageID=222.
- 13.Krieger J, Takaro TK, Song L, Beaudet N, Edwards K. A randomized controlled trial of asthma self-management support comparing clinic-based nurses and in-home community health workers: the Seattle-King County Healthy Homes II Project. Arch Pediatr Adolesc Med. 2009;163:141–9. doi: 10.1001/archpediatrics.2008.532. [DOI] [PMC free article] [PubMed] [Google Scholar]
- 14.Leech JA, Raizenne M, Gusdorf J. Health in occupants of energy efficient new homes. Indoor Air. 2004;14:169–73. doi: 10.1111/j.1600-0668.2004.00212.x. [DOI] [PubMed] [Google Scholar]
- 15.National Center for Health Statistics (US). 2006 National Health Interview Survey questionnaire. [cited 2011 Jan 18]. Available from: URL: ftp://ftp.cdc.gov/pub/Health_Statistics/NCHS/Survey_Questionnaires/NHIS/2006/English.
- 16.Centers for Disease Control and Prevention (US). Behavioral Risk Factor Surveillance System. [cited 2010 Jan 6]. Available from: URL: http://www.cdc.gov/BRFSS.
- 17.National Institute of Environmental Health Sciences. National Survey of Lead and Allergens in Housing (NSLAH) [cited 2011 Jan 18]. Available from: URL: http://www.niehs.nih.gov/research/clinical/join/studies/riskassess/nslah.cfm.
- 18.Department of Housing and Urban Development (US). Help yourself to a healthy home: protect your children's health. Washington: HUD, Department of Agriculture (US) (in conjunction with the Cooperative State Research Education and Extension Service); 2001. [Google Scholar]
- 19.Shendell DG, Prill R, Fisk WJ, Apte MG, Blake D, Faulkner D. Associations between classroom CO2 concentrations and student attendance in Washington and Idaho. Indoor Air. 2004;14:333–41. doi: 10.1111/j.1600-0668.2004.00251.x. [DOI] [PubMed] [Google Scholar]
- 20.Erdmann CA, Apte MG. Mucous membrane and lower respiratory building related symptoms in relation to indoor carbon dioxide concentrations in the 100-building BASE dataset. Indoor Air. 2004;14(Suppl 8):127–34. doi: 10.1111/j.1600-0668.2004.00298.x. [DOI] [PubMed] [Google Scholar]
- 21.Bartlett K, Martinez M, Bert J. Modeling of occupant-generated CO2 dynamics in naturally ventilated classrooms. J. Occup Environ Hyg. 2004;1:139–48. doi: 10.1080/15459620490424393. [DOI] [PubMed] [Google Scholar]
- 22.ASTM International. ASTM International Standard E1677-95: standard specification for an air retarder (AB) material or system for low-rise framed building walls, 1995. As incorporated by reference in the State of Minnesota. Residential Energy Code: codes adopted by reference. St. Paul (MN): Minnesota Office of the Revisor of Statutes; 2005. [Google Scholar]
- 23.American Society of Heating Refrigerating and Air-Conditioning Engineers. ASHRAE Standard 62.2-2007: ventilation and acceptable indoor air quality in low-rise residential buildings. Atlanta: ASHRAE; 2007. [Google Scholar]
- 24.Environmental Protection Agency (US). A citizen's guide to radon: the guide to protecting yourself and your family from radon. Washington: EPA Indoor Environments Division; 2009. [Google Scholar]
- 25.Architecture 2030. 2030 challenge targets: U.S. residential regional averages. [cited 2009 Dec 15]. Available from: URL: http://www.architecture2030.org/downloads/2030_Challenge_Targets_Res_Regional.pdf.
- 26.Sundell J. On the history of indoor air quality and health. Indoor Air. 2004;14(Suppl 7):51–8. doi: 10.1111/j.1600-0668.2004.00273.x. [DOI] [PubMed] [Google Scholar]
- 27.Miilunpalo S, Vuori I, Oja P, Pasanen M, Urponen H. Self-rated health status as a health measure: the predictive value of self-reported health status on the use of physician services and on mortality in the working-age population. J Clin Epidemiol. 1997;50:517–28. doi: 10.1016/s0895-4356(97)00045-0. [DOI] [PubMed] [Google Scholar]


