Abstract
Objectives.
Carbon monoxide (CO) poisoning is a leading cause of morbidity and mortality during natural disasters. On January 26–27, 2009, a severe ice storm occurred in Kentucky, causing widespread, extended power outages and disrupting transportation and communications. After the storm, CO poisonings were reported throughout the state. The objectives of this investigation were to determine the extent of the problem, identify sources of CO poisoning, characterize cases, make recommendations to reduce morbidity and mortality, and develop prevention strategies.
Methods.
We obtained data from the Kentucky Regional Poison Center (KRPC), hyperbaric oxygen treatment (HBOT) facilities, and coroners. Additionally, the Kentucky Department for Public Health provided statewide emergency department (ED) and hospitalization data.
Results.
During the two weeks after the storm, KRPC identified 144 cases of CO poisoning; exposure sources included kerosene heaters, generators, and propane heaters. Hospitals reported 202 ED visits and 26 admissions. Twenty-eight people received HBOT. Ten deaths were attributed to CO poisoning, eight of which were related to inappropriate generator location. Higher rates of CO poisoning were reported in areas with the most ice accumulation.
Conclusions.
Although CO poisonings are preventable, they continue to occur in postdisaster situations. Recommendations include encouraging use of CO alarms, exploring use of engineering controls on generators to decrease CO exposure, providing specific information regarding safe use and placement of CO-producing devices, and using multiple communication methods to reach people without electricity.
Each year in the United States, carbon monoxide (CO) poisoning is responsible for approximately 450 unintentional, non-fire-related deaths and more than 20,000 emergency department (ED) visits.1,2 It is a primary cause of morbidity and mortality after natural disasters, mainly because power outages lead to high-risk behaviors for CO poisoning, including improper placement and use of portable generators, use of alternative heating units (e.g., kerosene or propane heaters), and use of cooking devices as heating sources (e.g., charcoal grills or gas stoves).3–6
After hurricanes Katrina and Rita struck the U.S. Gulf Coast in 2005, 10 deaths and 78 nonfatal injuries were attributed to CO poisoning.4 After four major hurricanes in Florida in 2004, six CO-related deaths and 167 nonfatal CO-poisoning cases from 51 incidents were reported; portable generators were the reported source in the majority of cases.3 Outbreaks of CO poisoning after ice storms have also been reported.5–9 Simple measures, including ventilation of heating appliances, avoidance of indoor use of grills, and installation of battery-powered CO alarms can prevent unintentional CO-poisoning cases.2 Characterizing the nature of CO exposures and identifying the population at risk is crucial to developing effective prevention strategies.
During January 26–27, 2009, a severe ice storm occurred in Kentucky, causing widespread, extended power outages and disrupting transportation and communications. Kentucky residents received less than one day' warning before the storm, and 103 of Kentucky's 120 counties were eventually declared disaster areas. Damage was particularly severe in western Kentucky, where households were without electricity for more than two weeks. Soon after the storm, CO poisonings were reported, which prompted an investigation to determine the extent of the problem, identify sources of CO poisoning in this cold-weather disaster, describe the epidemiology of cases, make recommendations to reduce morbidity and mortality, and develop prevention strategies.
METHODS
The definition of CO poisoning was based on Council of State and Territorial Epidemiologists (CSTE) case definitions,10 as described for each of the following data sources.
Exposures
The Kentucky Regional Poison Center (KRPC) provided case reports that included demographics, symptoms, and a narrative description of the exposure, which included the source of CO. KRPC generated these reports from calls to the center originating from health-care providers and the general public. In case of multiple calls referring to the same person, KRPC staff de-duplicated records based on patient identifiers. People with confirmed CO poisoning on the basis of KRPC data had exhibited signs or symptoms of CO poisoning, had been exposed to CO, and either had a carboxyhemoglobin level ≥12% or elevated CO found in an air sample at the exposure site; people with probable CO poisoning had exhibited signs or symptoms and had been exposed to CO, but had no reported carboxyhemoglobin or environmental CO measurements.
ED visits and hospitalizations
The Kentucky Department for Public Health (KDPH), Office of Health Policy provided International Classification of Diseases, Ninth Revision (ICD-9) coded outpatient hospital visit and inpatient hospitalization data for confirmed cases (ICD-9 codes 986, E868.3, E868.8, E868.9, and E982.1). Cases were included if one or more ICD-9 codes were listed among the diagnoses. Data were collected from 108 hospitals, which included all acute care hospitals in Kentucky, with the exception of Veterans Administration hospitals and state psychiatric hospitals. All outpatient visits were assumed to be ED visits, although the possibility that some were hospital walk-in clinic visits could not be excluded.
Hyperbaric oxygen treatment
The two Kentucky hyperbaric oxygen treatment (HBOT) facilities that treat people with emergent CO poisoning provided HBOT data. One facility provided data through a surveillance system operated by the Centers for Disease Control and Prevention (CDC) and the Undersea and Hyperbaric Medical Society; the other facility provided data directly. For data from HBOT facilities, only probable cases were defined, requiring a history of CO exposure and receipt of HBOT.
Mortality
County coroners provided mortality data. Confirmed fatalities had signs of CO poisoning and either a carboxyhemoglobin level ≥12% or elevated CO in an air sample with an indicative source; suspected fatalities had signs of CO poisoning and an indicative source of CO.
Power outages and meteorologic data
The Kentucky Public Service Commission, Kentucky Municipal Utility Association, and Kentucky Association of Electric Cooperatives provided power-outage data. Ice accumulation data were based on maps provided by the National Weather Service. We used temperature data for Bowling Green, Kentucky,11 a city near the most severely affected area.
The storm affected western and central Kentucky most severely; the far southern and far eastern Kentucky counties were affected to varying but lesser degrees. Because the storm was essentially a statewide event, the analysis included the entire state. Data were collected for the period January 26–February 14, by which time power had been restored to about 95% of the approximately 770,000 customers experiencing outages (Personal communications, various personnel, Kentucky Public Service Commission, February 2009). Intentional exposures and one exposure in Indiana that had been treated in Kentucky were excluded. This investigation underwent human subjects review by CDC, was determined to represent public health problem evaluation and control rather than research, and was granted exempt status.
RESULTS
CO exposures
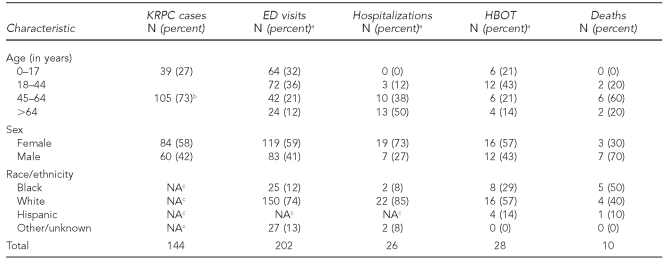
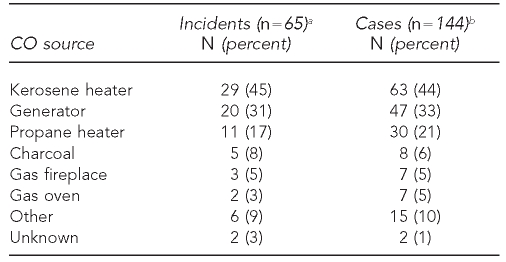
KRPC logged 115 CO exposure calls, representing possible exposures of 275 people, compared with nine calls during the same period in 2008. Illness among 144 people from 65 of the 115 calls met the case definition (105 probable and 39 confirmed). The remaining 131 potentially exposed people did not represent cases, often because they were asymptomatic family members of exposed, symptomatic people. Twenty-seven percent of the cases were in children younger than aged 18 years (Table 1). Of the 65 calls that included at least one case, 20 calls representing 43 cases were from health-care providers. The other 45 calls were from an affected person, a friend, or a family member. KRPC data included two of the 10 deaths. The most common reported exposure sources among the cases were heating devices and generators (Table 2).
Table 1.
Carbon monoxide poisoning cases after an ice storm, demographics by data source—Kentucky, January 26–February 14, 2009
aPercentages may not total 100 because of rounding.
bIncludes all people aged ≥18 years; adult ages often not collected
cData not collected
KRPC = Kentucky Regional Poison Center
ED = emergency department
HBOT = hyperbaric oxygen treatment
NA = not available
Table 2.
CO sources for CO-poisoning incidents and cases reported to the Kentucky Regional Poison Center—Kentucky, January 26–February 14, 2009
aAll incidents include at least one case; two sources were present in 13 (20%) incidents.
bTwo sources were present for 35 cases.
CO = carbon monoxide
ED visits, hospitalizations, and HBOT
Kentucky hospitals reported 202 ED visits and 26 hospital admissions for CO poisoning, compared with 11 ED visits and no admissions during the same period in 2008. The median age of ED patients was 32 years (range: six weeks to 91 years) and of admitted patients was 63 years (range: 28 to 89 years). Although 32% of people examined in an ED for CO poisoning were children, no children were admitted; 50% of admitted people were aged 64 years or older (Table 1). The number of days patients were admitted ranged from less than one day to 14 days (mean: 2.6 days; median: 2.0 days). Twenty-eight Kentucky residents were treated with HBOT (age range: 1 to 79 years; median: 38 years). Sixteen (57%) had been poisoned as a result of generator use. Twelve (43%) were members of racial/ethnic minority groups (Table 1).
Mortality
Of 36 storm-related deaths, 10 (28%) from seven incidents were attributed to CO poisoning. These deaths included eight confirmed and two suspected cases (age range: 26 to 76 years; median age: 58 years) (Table 1). The first four deaths occurred less than three days after the beginning of the storm. Eight deaths (80%) from five incidents were associated with incorrect location of a gasoline-powered generator. The other two deaths involved a propane heater and a charcoal grill. Six (60%) decedents were members of racial/ethnic minority groups, including two (20%) immigrants. One of the immigrants had used a charcoal grill indoors; the other had used a generator indoors.
Association between CO-poisoning cases, power outages, and meteorologic data
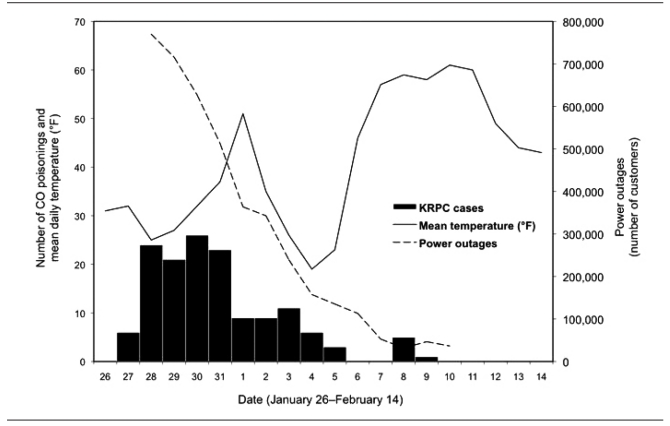
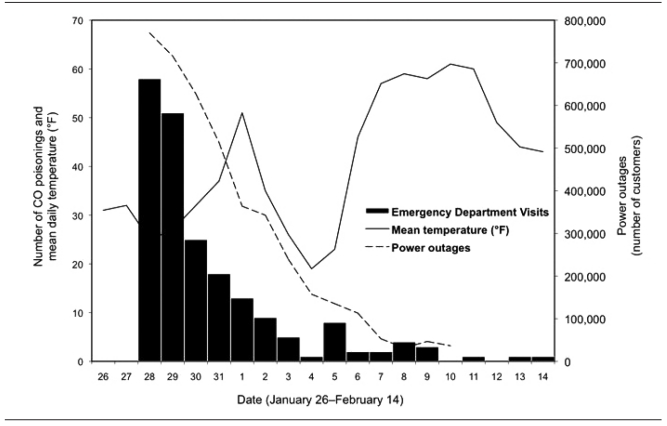
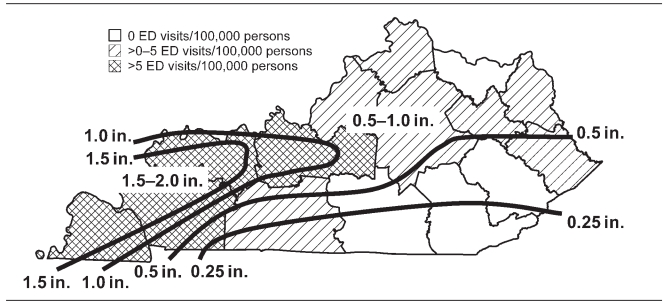
The epidemiologic curves of KRPC cases (Figure 1) and ED visits (Figure 2) demonstrate a predictable pattern when viewed with power-outage and temperature data, with the largest numbers of cases occurring two to four days after the storm when temperatures were below freezing and the number of power outages remained high. Rates of ED visits for CO poisoning by Area Development District (Figure 3) also demonstrate a pattern, when viewed with ice-accumulation data, with the highest rates of ED visits occurring in the most severely affected areas of western Kentucky. The maximum rate of ED visits was 21.5 visits per 100,000 people for one district in the most severely affected area of the state.
Figure 1.
KRPC CO-poisoning cases, with power outages and mean daily temperature— Kentucky, January 26–February 14, 2009
KRPC = 5 Kentucky Regional Poison Center
CO = 5 carbon monoxide
Figure 2.
Emergency department visits for CO poisoning, with power outages and mean daily temperature—Kentucky, January 26–February 14, 2009
CO = 5 carbon monoxide
Figure 3.
Emergency department visits for carbon monoxide poisoning, by Area Development District with ice accumulation—Kentucky, January 26–February 14, 2009
ED = 5 emergency department
in. = 5 inch
DISCUSSION
CO-poisoning cases continue to occur despite being a preventable and well-known consequence of disaster-related power outages.4,6 After this ice storm, CO poisoning was the leading cause of storm-related deaths, surpassing other common causes such as hypothermia and cardiac events.
Kerosene heaters were the most common source of CO poisoning; however, the majority of deaths and severe poisoning cases during this period were associated with generators, which is consistent with a previous study reporting more severe poisoning with generators.6 Even when generators were used outdoors, CO poisoning has occurred when the generators were placed ≤7 feet from the home.4 A community needs assessment conducted in severely affected areas of Kentucky after this storm determined that use of generators and alternative heating sources was common. In three surveyed areas with widespread power outages, 44% to 56% of households had used a generator since the storm, and 4% to 6% of them reported use of a generator indoors or in a garage; 35% to 43% of households had used a charcoal or gas grill, 21% to 36% of whom reported using it indoors (Unpublished data, Community Assessment for Public Health Emergency Response conducted by KDPH and CDC, February 6–9, 2009).
Shelters in the surveyed areas offered services to the population for varying periods after the storm. The community needs assessment was a door-to-door survey of people in private residences, which would eliminate people who remained in shelters or who left the area to stay with family or friends. This might partially explain the high percentage of households reporting use of generators or alternative heating sources.
Lack of education about CO poisoning might contribute to high-risk behaviors. After four major hurricanes in Florida in 2004, less than 50% of adult respondents involved in CO-poisoning incidents related to generator use reported having received instruction in safe operation of the generator.12 Studies have also demonstrated that people are often unaware of the dangers of operating CO-producing devices indoors or near homes.13,14
The number of CO-poisoning cases varied, as expected, with temperature, power restoration, and ice accumulation. The highest rates of CO poisoning were observed in the western part of Kentucky, which -experienced the most ice accumulation and, therefore, the most extensive power outages. These findings support the belief that inclement weather causing widespread power outages increases high-risk behavior among the affected population, thereby increasing the number of CO exposures.
This investigation also determined that people from minority groups disproportionately suffered from severe CO poisoning. Eighteen (47%) of 38 people who died or were administered HBOT were members of racial/ethnic minority groups, whereas across Kentucky, only 10% of the population are members of racial/ethnic minority groups.15 One death and five HBOT cases among minority individuals were caused from burning charcoal indoors, which has previously been described among minority and immigrant groups and has been attributed to language and cultural factors.9,16,17 A study of CO-poisoning cases after a windstorm in Washington State in 2006 determined that all eight deaths were in minority immigrant households; six were associated with improper generator use and two with indoor charcoal use.16 A retrospective review of CO-poisoning patients in Washington State who had been administered HBOT during a nine-year period demonstrated that the relative risk of severe CO poisoning was elevated among black and Hispanic individuals, compared with non-Hispanic white people.17
In response to the CO-poisoning cases, KDPH issued news releases and public service announcements, distributed fact sheets, and activated a person-to-person network to contact members of vulnerable groups such as the elderly, people with hearing impairments, and people living in remote areas. The Kentucky National Guard was mobilized for house-to-house welfare checks and other assistance. In coordination with CDC and a mobile telephone provider, a mass text message regarding CO poisoning was sent to Kentucky customers.
Limitations
One limitation of this analysis was that certain severely affected areas were without both landline and mobile telephone service for days after the storm, which might have decreased the number of CO exposures reported to KRPC. Additionally, transportation was difficult because of icy roads and downed trees and power lines, which might have prevented people from seeking medical attention. Therefore, data presented in this article might underestimate the true number of affected people. Also, individuals might be included in more than one dataset; therefore, the numbers of CO-poisoning cases from each dataset cannot be summed to provide a total.
Recommendations
The hierarchy of controls indicates that engineering interventions (e.g., generator emission controls and CO-alarm installation) might be more successful than other types of interventions at decreasing CO-poisoning cases. Electronic fuel injection or catalytic after-treatment might decrease CO-poisoning cases from generators by reducing the level of CO in the generator exhaust.18 Two manufacturers of marine generators voluntarily incorporated catalytic converters to decrease CO poisonings on houseboats,19 and similar measures have been suggested for portable generators.5,20 Weatherization of generators by incorporating a waterproof housing, receptacle covers, and ground-fault circuit interrupter protection might lessen the risk for electrocution and make outside generator use easier.18
Because no consensus has been reached regarding a safe distance from a home for operating a generator, CDC recommends placing the generator as far from the home as possible.4 A recent study by the National Institutes of Standards and Technology determined that generators should be placed more than 25 feet from a one-story house to avoid CO entry related to airflow patterns.21 Generators should be sheltered to prevent water damage and electrocution, and connected by using an extension cord rated for outdoor use. They may be secured with lock and chain to prevent theft. Vendors should be encouraged to offer these items along with CO alarms at the point of sale; ideally they should be displayed alongside the generators. Even with these recommendations, people might not comprehend the dangers of operating a generator in a garage, on a porch, or in a basement; therefore, unsafe practices should be specifically addressed in prevention messages.
CDC recommendations for using generators and other CO-producing devices include installing a CO alarm that is battery operated or has battery backup. Prevention messages should stress that it is critical to adhere to manufacturer recommendations and provide adequate ventilation for CO-producing heaters, and should also emphasize that unconventional heating sources (e.g., charcoal briquettes or gas stoves) are unsafe.
Given the lack of knowledge concerning CO poisoning and use of CO-producing devices, educational interventions might also be helpful. Evidence indicates that intensive public education before and after a storm can decrease CO poisonings, especially among minority groups.22
Because of challenges in communicating with people without electricity and because CO poisonings have been documented as early as nine hours after a storm,9 dissemination of prevention messages should begin before storms whenever possible. Messages disseminated after storms should begin immediately, because the majority of CO-poisoning cases after storms occur on days two and three,5 and should use multiple forms of media to reach people without electricity (e.g., radio, fact sheets, door-to-door campaigns, and mobile telephone text messages).
CONCLUSIONS
CO-poisoning epidemics are common yet preventable causes of morbidity and mortality after disasters. Use of emission-control devices on generators might decrease severe CO poisonings. CO alarm use should be encouraged, and educational messages should focus on safe generator use and avoidance of unsafe heating and cooking practices. Vendors should be encouraged to display CO alarms and other safety equipment alongside generators. Prevention messaging should begin before storms and should include components directed toward minority populations. Forms of mass communication that do not require electricity (e.g., mass public-service text messages) might be valuable in the immediate aftermath of disasters.
Acknowledgments
The authors acknowledge the following individuals and groups for their contributions to this article: Neil B. Hampson, MD, Center for Hyperbaric Medicine, Virginia Mason Medical Center in Seattle, Washington; Yanique Redwood, PhD, and Sara Vagi, PhD, Epidemic Intelligence Service officers, Centers for Disease Control and Prevention (CDC) in Atlanta, Georgia; the Kentucky ice storm Community Assessment for Public Health Emergency Response (CASPER) team; Kentucky coroners; Kentucky hyperbaric oxygen treatment facility personnel; and Kentucky Department for Public Health officials.
Footnotes
The findings and conclusions in this article are those of the authors and do not necessarily represent the official position of CDC.
REFERENCES
- 1.Carbon monoxide-related deaths—United States, 1999–2004. MMWR Morb Mortal Wkly Rep. 2007;56(50):1309–12. [PubMed] [Google Scholar]
- 2.Nonfatal, unintentional, non-fire-related carbon monoxide exposures—United States, 2004–2006. MMWR Morb Mortal Wkly Rep. 2008;57(33):896–9. [PubMed] [Google Scholar]
- 3.Carbon monoxide poisoning from hurricane-associated use of portable generators—Florida, 2004. MMWR Morb Mortal Wkly Rep. 2005;54(28):697–700. [PubMed] [Google Scholar]
- 4.Carbon monoxide poisoning after two major hurricanes—Alabama and Texas August–October 2005. MMWR Morb Mortal Wkly Rep. 2006;55(9):236–9. [PubMed] [Google Scholar]
- 5.Hampson NB, Stock AL. Storm-related carbon monoxide poisoning: lessons learned from recent epidemics. Undersea Hyperb Med. 2006;33:257–63. [PubMed] [Google Scholar]
- 6.Daley WR, Smith A, Paz-Argandona E, Malilay J, McGeehin M. An outbreak of carbon monoxide poisoning after a major ice storm in Maine. J Emerg Med. 2000;18:87–93. doi: 10.1016/s0736-4679(99)00184-5. [DOI] [PubMed] [Google Scholar]
- 7.Wrenn K, Conners GP. Carbon monoxide poisoning during ice storms: a tale of two cities. J Emerg Med. 1997;15:465–7. doi: 10.1016/s0736-4679(97)00074-7. [DOI] [PubMed] [Google Scholar]
- 8.Broder J, Mehrotra A, Tintinalli J. Injuries from the 2002 North Carolina ice storm, and strategies for prevention. Injury. 2005;36:21–6. doi: 10.1016/j.injury.2004.08.007. [DOI] [PubMed] [Google Scholar]
- 9.Houck PM, Hampson NB. Epidemic carbon monoxide poisoning following a winter storm. J Emerg Med. 1997;15:469–73. doi: 10.1016/s0736-4679(97)00079-6. [DOI] [PubMed] [Google Scholar]
- 10.Council of State and Territorial Epidemiologists. Updates to 1998 case definition for acute carbon monoxide poisoning surveillance. Atlanta: CSTE; 2007. [cited 2009 Feb 27]. Also available from: URL: http://www.cste.org/PS/2007ps/2007psfinal/EH/07-EH-03.pdf. [Google Scholar]
- 11.Weather Underground. Weather history for Bowling Green, Kentucky. Ann Arbor (MI): Weather Underground, Inc; 2009. [cited 2009 Feb 16]. Also available from: URL: http://www.wunderground.com. [Google Scholar]
- 12.Van Sickle D, Chertow DS, Schulte JM, Ferdinands JM, Patel PS, Johnson DR, et al. Carbon monoxide poisoning in Florida during the 2004 hurricane season. Am J Prev Med. 2007;32:340–6. doi: 10.1016/j.amepre.2006.12.013. [DOI] [PubMed] [Google Scholar]
- 13.Greife AL, Goldenhar LM, Fruend E, Stock A, Halperin W. Carbon monoxide poisoning from gasoline-powered engines: risk perception among Midwest flood victims. Am J Public Health. 1997;87:466–7. doi: 10.2105/ajph.87.3.466. [DOI] [PMC free article] [PubMed] [Google Scholar]
- 14.Hampson NB, Zmaeff JL. Carbon monoxide poisoning from portable electric generators. Am J Prev Med. 2005;28:123–5. doi: 10.1016/j.amepre.2004.07.004. [DOI] [PubMed] [Google Scholar]
- 15.Census Bureau (US) Estimates of the resident population by race and Hispanic origin for the United States and states: July 1, 2008 (SC-EST2008-04) Washington: Census Bureau; 2009. [cited 2009 Jun 30]. Also available from: URL: http://www.census.gov/popest/states/asrh/SC-EST2008-04.html. [Google Scholar]
- 16.Gulati RK, Kwan-Gett T, Hampson NB, Baer A, Shusterman D, Shandro JR, et al. Carbon monoxide epidemic among immigrant populations: King County, Washington, 2006. Am J Public Health. 2009;99:1687–92. doi: 10.2105/AJPH.2008.143222. [DOI] [PMC free article] [PubMed] [Google Scholar]
- 17.Ralston JD, Hampson NB. Incidence of severe unintentional carbon monoxide poisoning differs across racial/ethnic categories. Public Health Rep. 2000;115:46–51. doi: 10.1093/phr/115.1.46. [DOI] [PMC free article] [PubMed] [Google Scholar]
- 18.Elder J, Buyer J Consumer Product Safety Commission (US) Memorandum to the commission regarding staff review of portable generator safety. [cited 2010 Apr 14]. Available from: URL: http://www.cpsc.gov/library/foia/foia07/brief/PortableGenerators.pdf.
- 19.Consumer Product Safety Commission (US) Staff review of portable generator safety: briefing to the commission. 2006. Oct 26, [cited 2010 Oct 13]. Available from: URL: http://www.cpsc.gov/volstd/engine/portgenstaffrev.pdf.
- 20.Cukor J, Restuccia M. Carbon monoxide poisoning during natural disasters: the Hurricane Rita experience. J Emerg Med. 2007;33:261–4. doi: 10.1016/j.jemermed.2007.02.043. [DOI] [PubMed] [Google Scholar]
- 21.Wang L, Emmerich SJ. Modeling the effects of outdoor gasoline powered generator use on indoor carbon monoxide exposures [NIST Technical Note 1637, August 2009] [cited 2010 Mar 8]. Available from: URL: http://fire.nist.gov/bfrlpubs/build09/art009.html.
- 22.Lin G, Conners GP. Does public education reduce ice storm-related carbon monoxide exposure? J Emerg Med. 2005;29:417–20. doi: 10.1016/j.jemermed.2005.05.003. [DOI] [PubMed] [Google Scholar]


