Abstract
Quantitative sodium MRI requires accurate knowledge of factors affecting the sodium signal. One important determinant of sodium signal level is the transmit B1 field strength. However, the low signal-to-noise ratio typical of sodium MRI makes accurate B1 mapping in reasonable scan times challenging. A new phase-sensitive B1 mapping technique has recently been shown to work better than the widely used dual-angle method in low-signal-to-noise ratio situations and over a broader range of flip angles. In this work, the phase-sensitive B1 mapping technique is applied to sodium, and its performance compared to the dual-angle method through both simulation and phantom studies. The phase-sensitive method is shown to yield higher quality B1 maps at low signal-to-noise ratio and greater consistency of measurement than the dual-angle method. An in vivo sodium B1 map of the human breast is also shown, demonstrating the phase-sensitive method’s feasibility for human studies.
Keywords: B1 mapping, phase-sensitive B1 mapping, sodium MRI
Sodium MRI shows promise in assessing cartilage health (1–4), characterizing and assessing the viability of tumors (5,6), quantifying concentration gradients in the kidneys (7,8), and assessing tissue damage following stroke (9). However, relatively low 23Na concentrations in biological tissues, rapid biexponential signal decay, and a low gyromagnetic ratio make sodium MRI challenging. Improvements in coil and gradient hardware, the availability of whole-body scanners with high polarizing field strengths, and the development of more efficient pulse sequences have enabled higher quality sodium MRI in vivo in reasonable scan times (10–12).
Accurate quantification of tissue sodium concentration from sodium MRI is of considerable importance for many applications (13). Quantitative analysis of sodium concentration from sodium MRI requires accurate knowledge of factors affecting the sodium signal. One important determinant of the sodium signal level is the transmit B1 field strength. However, low signal-to-noise ratio (SNR) in sodium MRI makes accurate B1 mapping in reasonable scan times challenging. The problem is compounded when surface coils or other sodium-tuned transmit–receive coil configurations with significant B1 inhomogeneity are used to maximize SNR, as most B1 mapping methods are accurate over a limited range of flip angles.
The signal levels obtained during in vivo sodium imaging experiments are much lower than those obtained in conventional proton MRI. Because sodium imaging is performed with custom transmit–receive coils, B1 is typically very inhomogeneous. A new phase-sensitive B1 mapping technique has been introduced (14), which provides accurate flip angle estimation over a wide range of flip angles at low SNR. This method has been shown (15,16) to give flip angle estimates with less mean bias and lower standard deviation than the widely used dual-angle (17–19) and “actual flip angle imaging” (20) methods. The phase-sensitive B1 mapping method may fail for large off-resonance frequency shifts. Because of sodium’s low gyromagnetic ratio (~¼ that of hydrogen), off-resonance frequency shifts in sodium imaging are much smaller than in proton imaging. Thus, the phase-sensitive B1 mapping method is well suited for flip angle mapping in sodium MRI.
In this work, we apply phase-sensitive B1 mapping to sodium MRI and compare its performance to the widely used dual-angle method. Both the phase-sensitive and dual-angle methods were implemented in a sodium echo-planar imaging (EPI) sequence. The performance of each method was simulated at the low SNRs typical of sodium imaging across a range of flip angles, and results corroborated with phantom scans. We demonstrate that the phase-sensitive sodium B1 mapping method performs more consistently across a broader range of flip angles than the dual-angle method. The phase-sensitive method was further applied in vivo to acquire a sodium B1 map of the breast of a normal volunteer.
THEORY
The phase-sensitive B1 mapping method (as described in Ref. 14) makes use of a 2α radiofrequency (RF) pulse about the x-axis followed immediately by an α flip about the y-axis. This series of pulses encodes flip angle in signal phase. Subtracting the phase between two acquisitions—one with a positive 2α initial pulse and the other with a negative 2α initial pulse—removes phase from other sources such as eddy currents and retarded potentials. The phase difference between the two acquisitions is a monotonic function of the actual flip angle, from which the flip angle can be estimated. For on-resonance spins, the phase difference can be expressed as
| [1] |
For off-resonance spins, the expression for the phase difference becomes more complicated. The effects of off-resonance on the phase-sensitive method are quantified in terms of the off-resonance precession that occurs during the 2α − α excitation. The angle of precession is designated as Δωτ, where τ represents the time between the center of the 2α pulse and the center of the α pulse, and Δω is the off-resonance frequency. The phase difference remains a monotonic function of flip angle for values of Δωτ up to about ±58°. Within this range of off-resonance precession, the effect of off-resonance can be compensated, but this requires the acquisition of a B0 map. Outside this range, the phase difference between the acquisitions is no longer a monotonic function of flip angle and the method fails. For Δωτ near zero, i.e., for minimal B0 inhomogeneity or very rapid RF excitation, the effect of off-resonance on the flip angle estimate is minimal, and the flip angle map can be constructed accurately according to Eq. 1 without correction for off-resonance. When off-resonance effects are greater and require correction with a B0 map, estimation of the flip angle based on the phase difference and measured B0 is performed with a lookup table because the relationship between the phase difference and the actual flip angle has no simple closed form like Eq. 1 for off-resonant spins.
The dual-angle method encodes flip angle in the ratio between signal magnitudes made with nominal flip angles of α and 2α, respectively (17–19). Let M1 and M2 be the magnitudes of a given voxel’s signal for each of the two acquisitions, respectively. For GRE dual-angle B1 mapping, the flip angle estimate is given by:
| [2] |
Mathematical analysis of flip angle mapping methods has shown that the phase-sensitive method gives flip angle estimates with lower mean bias and standard deviation over a wider range of flip angles than the dual-angle method (15,16). The phase-sensitive method has also been shown to give fewer measurements that are “out-of-bounds,” i.e., that fall out of the allowed range of the observable quantity. Such measurements result from noise corruption of the acquired images. For instance, in the dual-angle method, a signal ratio M2/2M1 greater than 1 may be observed with noise-corrupted data, for which no flip angle estimate can be made according to Eq. 2. Similarly, for the phase-sensitive method, a phase difference may be measured that does not correspond to any flip angle.
MATERIALS AND METHODS
Simulations
We evaluated the theoretical performance of the dual-angle and phase-sensitive methods with Monte Carlo simulation in Matlab (MathWorks, Natick, MA). We first simulated the standard deviation and mean bias of the flip angle estimate for each method. Both methods were simulated for a range of actual flip angles ranging from 0 to 2α0, where α0 represents the middle of the range of measurable flip angles for each method (45° for the dualangle method and 90° for the phase-sensitive method). Simulation was performed assuming longitudinal relaxation time of 60 msec, pulse repetition time (TR) of 100 msec, and system SNR of 5, 10, and 15. System SNR was defined as the maximum signal possible with a 90° flip angle and infinite TR, divided by the standard deviation of one of the two independent orthogonal components that comprise the MR image noise vector. A total of 50,000 iterations were performed for each value of actual flip angle at 1° intervals from 1° to 90° for the dual-angle method and from 1° to 180° for the phase-sensitive method.
We then simulated the effect of off-resonance on the phase-sensitive method. The statistics of the flip angle estimate were examined by simulating with 50,000 iterations for values of actual flip angle ranging from 1° to 180° at 1° intervals, assuming longitudinal relaxation time of 60 msec, TR of 100 msec, and system SNR of 15. Simulation was performed for off-resonance precession angles of Δωτ = 0°, 7°, and 14°. Off-resonance precession angle is the phase accrued because of off-resonance frequency Δω during the interval τ between the center of the 2α excitation and the center of the α excitation.
Phantom Studies/Statistical Comparison
We compared the performance of the phase-sensitive method and the GRE dual-angle method for sodium B1 mapping by assessing the statistical performance of each method during repeated measurements in the inherently low-SNR environment of sodium MRI. The pertinent characteristics of each method reside in the excitation pulses used to encode flip angle, rather than the k-space trajectory used during readout. Thus, we sought to make the comparison as fair as possible by implementing both B1 mapping methods using an identical 3D EPI sequence adapted for sodium imaging on a 3 T Siemens Trio MRI scanner (Siemens Medical Systems, Erlangen, Germany). Identical matrix size, voxel size, total readout duration, and readout bandwidth were maintained across methods for all comparisons.
To empirically evaluate the standard deviation in the flip angle measurement of each method, 20 phase-sensitive measurements and 20 dual-angle measurements were taken of a uniform cylindrical sodium (saline) phantom with outside diameter of 15 cm and [Na+] = 154 mM. Both acquisitions were three dimensional using nonselective RF pulses, with the following sequence parameters: TR/echo time (TE) = 100/15 msec, EPI factor = 3, field of view (FOV) = 38.0 × 38.0 × 9.6 cm3, matrix size = 128 × 128 × 32, resolution = 3 mm isotropic, readout bandwidth = 165 Hz/pixel, and total scan time = 4 min 35 sec. As mentioned, each method used identical EPI k-space trajectory and total readout duration. A sodium-tuned quadrature birdcage coil was constructed for the experiment with inside diameter of 16 cm. Presaturation is typically required when using either the dualangle or the phase-sensitive technique for proton B1 mapping. However, no presaturation was necessary in our sodium B1 mapping experiments because the chosen TR of 100 msec is much longer than the longitudinal relaxation time of sodium.
The mean flip angle values were computed on a voxel-by-voxel basis across the 20 maps for both the phase-sensitive and dual-angle method to validate that the two methods yield consistent B1 variations. The phase-sensitive maps are centered around a nominal flip angle of 90° (given a sensitive range of 0°–180° for the phase-sensitive method), whereas those of the dual-angle method are centered around a nominal flip angle of 60°. Note that although the sensitive range of the dual-angle method is 0°–90°, a nominal flip angle of 60° (rather than 45°) is typical given the dual-angle method’s known sensitivity to noise at lower flip angles.
Flip angle maps were calculated from each of the 20 individual acquisitions for both methods. Maps measuring the standard deviation across the 20 observations at each voxel were then computed for both methods to determine which method provided more consistent measurement of B1 values in this low-SNR environment. High SNR flip angle maps were also calculated for each method by averaging all 20 data acquisitions to verify that the methods were correctly implemented and give reasonable results at high SNR.
In Vivo 3D Sodium B1 Mapping
Sodium B1 maps were obtained of the breast in a healthy volunteer to verify the technique in vivo. The experiment was performed in compliance with our institutional review board requirements. The scan was performed on the same scanner and with the same sodium EPI sequence as the phantom scans, using nonselective excitation pulses. A custom dual-tuned sodium/hydrogen breast coil (diameter 6 in.) was built for the experiment, and the following scan parameters used: TR/TE = 100/9 msec, EPI factor = 3, FOV = 25.6 × 25.6 × 32 cm3, matrix size = 64 × 64 × 32, readout bandwidth = 165 Hz/pixel, and total scan time = 9 min 22 sec.
RESULTS
To facilitate comparison, all sodium B1 maps shown are scaled to each method’s applicable range (i.e., maps using the dual-angle method are scaled from 0° to 90°, whereas those using the phase-sensitive method are scaled from 0° to 180°). Although numerical ranges across the two methods differ, the relative shading is thus normalized for each method.
Simulations
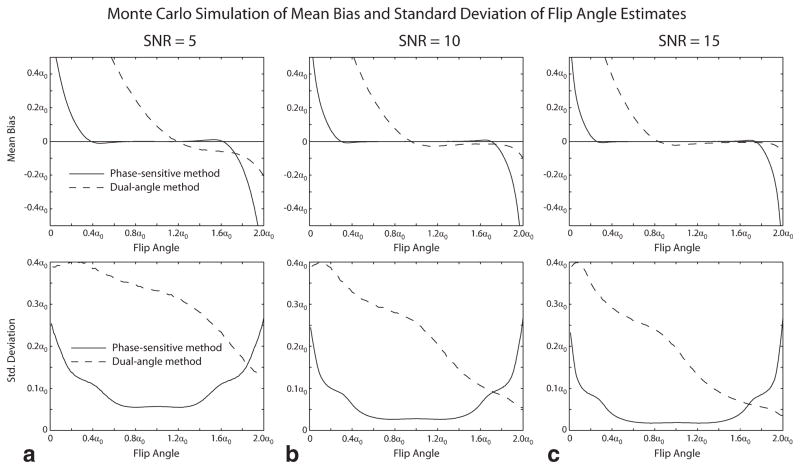
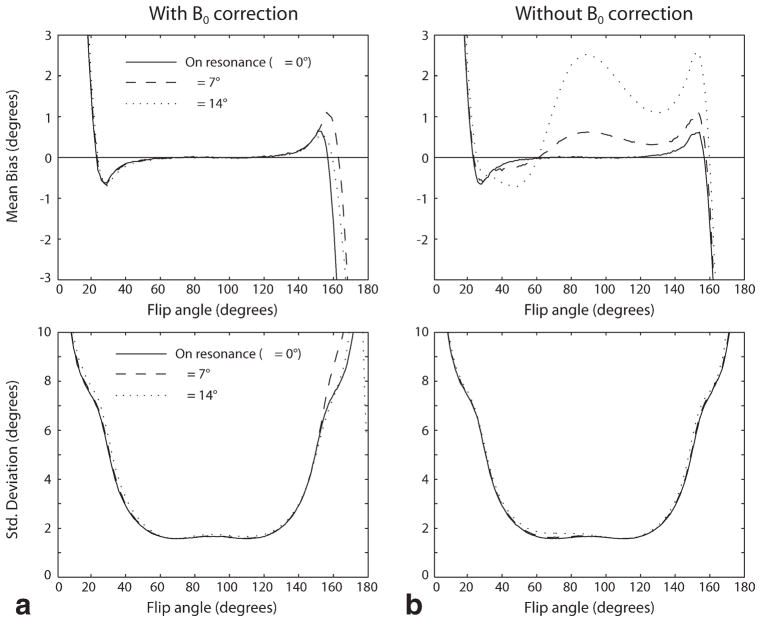
Figures 1 and 2 show the results of Monte Carlo simulation of the performance of the phase-sensitive and dual-angle B1 mapping methods. Figure 1 shows the mean bias and standard deviation of the flip angle estimate obtained by each method over a range of actual flip angles for values of system SNR ranging from 5 to 15. The phase-sensitive method is seen to have lower flip angle estimate mean bias and lower standard deviation over most of the measurable range of flip angles. Figure 2 shows the effect of off-resonance on the accuracy of the flip angle estimates obtained with the phase-sensitive method. Off-resonance phase accrual during the RF excitation causes mean bias, but has little effect on the standard deviation of the estimate for the values of off-resonance precession of 7° and 14° shown in Fig. 2.
FIG. 1.
Monte Carlo simulation of dual-angle and phase-sensitive B1 mapping methods. The mean bias (upper panels) and standard deviation (lower panels) of the flip angle estimate obtained by each method over a range of actual flip angles are shown for values of system SNR ranging from 5 to 15 (panels a–c). The phase-sensitive method is seen to have lower flip angle estimate mean bias and lower standard deviation over most of the measurable range of flip angles.
FIG. 2.
Monte Carlo simulation of effect of off-resonance on the phase-sensitive method. The left panels (a) show the effect of off-resonance on the mean bias and standard deviation of the phase-sensitive flip angle estimate when B0 correction is performed, as described in Ref. 14. The right panels (b) show the effect of off-resonance if no B0 correction is performed. Off-resonance phase accrual during the RF excitation causes mean bias, but has little effect on the standard deviation of the estimate for the values of off-resonance precession of 7° and 14° shown. Note that these values were informed by the in vivo study shown in Fig. 5, where the maximum off-resonance precession angle across the breast was measured to be about 7°.
Phantom Studies/Statistical Comparison
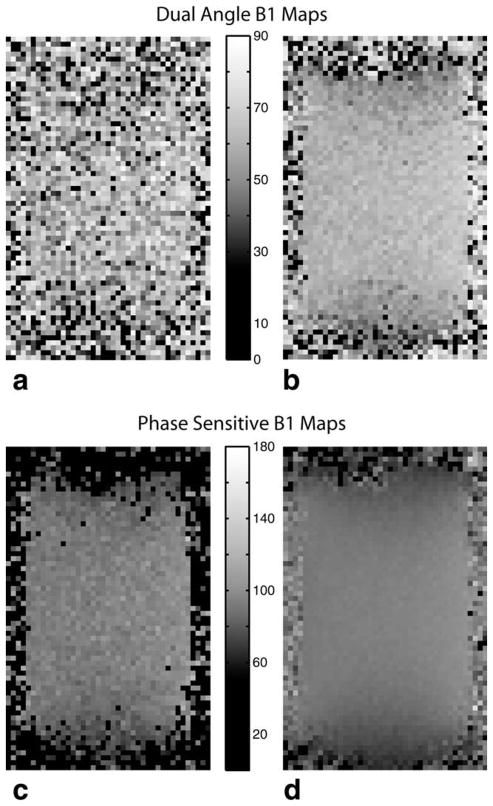
Sample sodium B1 maps of the phantom for each method are shown in Figs. 3 and 4. Maps from a single acquisition for each method are shown in Fig. 3a,c, and high SNR maps obtained by averaging all 20 measurements are shown in Fig. 3b,d. Zero (black) values indicate voxels where an out-of-bounds measurement occurred. The high SNR images reveal regular variations in B1 (despite the different nominal flip angle), suggesting that both methods yield consistent B1 data. Both B1 maps show the sensitivity variation expected from the single-tuned birdcage coil used.
FIG. 3.
Dual-angle sodium B1 maps for a single acquisition (a) and 20 averaged acquisitions (b). Phase-sensitive sodium B1 maps for a single acquisition (c) and 20 averaged acquisitions (d). As seen, the phase-sensitive method yields much more robust sodium B1 maps than the dual-angle method. Note that the phase-sensitive maps are centered around a nominal flip angle of 90° vs. 60° for the dual-angle method, reflecting the inherently wider dynamic range of the phase-sensitive method.
FIG. 4.
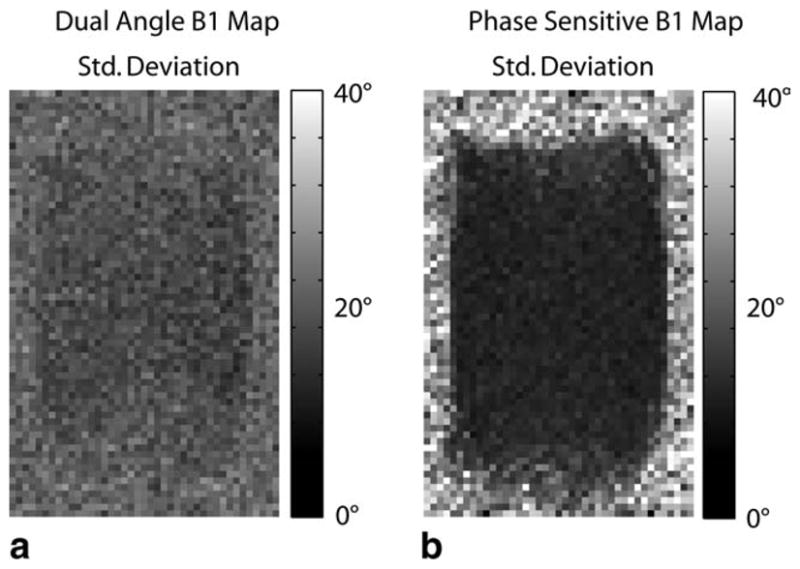
Standard deviation of the sodium B1 maps for both the dual-angle method (a) and phase-sensitive method (b) as measured across 20 acquisitions. The phase-sensitive B1 mapping method yields a much more consistent measurement in the low-SNR environment typical of sodium imaging.
The superior performance of the phase-sensitive method is clearly visible in both the single-acquisition maps and the high SNR maps formed by averaging all 20 acquisitions. Some minor EPI artifacts are visible.
Corresponding standard deviation maps across the 20 measurements are shown in Fig. 4. Out-of-bounds measurements were excluded from the standard deviation calculations. The phase-sensitive method yields a consistently lower standard deviation of measurement than the dual-angle method: average standard deviations were ~7% of the nominal flip angle for the phase-sensitive method and ~22% of the nominal flip angle for the dual-angle method (computed for voxels with a mean within 20% of the nominal flip angle across a large central region of interest in the phantom). These results are consistent with both theory and our Monte Carlo simulation results (Figs. 1 and 2).
In Vivo 3D Sodium B1 Mapping
A phase-sensitive sodium B1 map of the breast is shown in Fig. 5. The method performs well enough to provide valuable information on sodium flip angle variations across breast tissue in a scan time of under 10 min. Parameter optimization and a more efficient k-space trajectory allowing shorter TE should enable further significant reductions in sodium B1 mapping times. Achieving usable sodium B1 maps in vivo with the dual-angle method typically requires prohibitively long scan times.
FIG. 5.
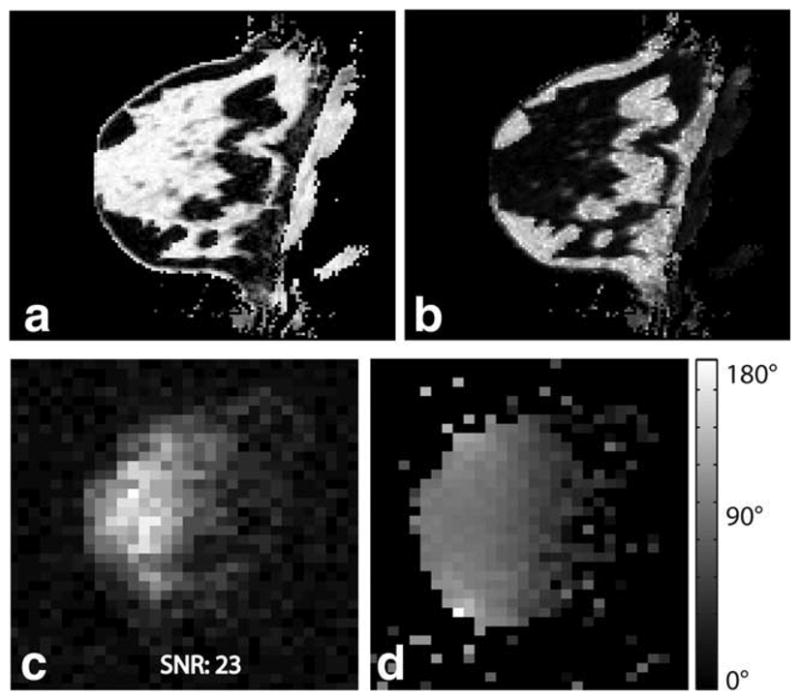
Proton three-point Dixon water (a) and fat (b) image of the breast of a healthy volunteer. The corresponding sodium magnitude image is shown in (c), showing good correlation with breast anatomy (high sodium concentration in fibroglandular tissue and lower concentration in fatty tissue). A 3D sodium B1 map using the phase-sensitive method is shown in (d). The phase-sensitive method yields a high-quality B1 map in vivo despite low sodium image SNR.
DISCUSSION
Our results (both theoretical and measured) indicate that the phase-sensitive and dual-angle methods achieve consistent measurement of B1 in sodium MRI. However, the new phase-sensitive method demonstrates a significantly and consistently lower standard deviation of measurement and much better noise performance. This confirms previous theory (15,16) and suggests that the acquisition of sodium B1 maps is feasible in reasonable scan times using the phase-sensitive method.
Although promising, the in vivo maps presented in Fig. 4 are still quite noisy. The EPI trajectory is far from optimal because of rapid transverse relaxation time (T2) decay in sodium and the long TE required with an EPI trajectory. Significant improvements in the quality of B1 maps and significant reductions in scan time should result when more SNR-efficient sequences better adapted to sodium imaging are used, such as 3D twisted projection imaging (TPI) (10,11) or the 3D cones trajectory (12,21).
As discussed above, the performance of the phase-sensitive B1 mapping method is affected by off-resonance. Off-resonance causes precession of spins during the 2α − α excitation, which alters the phase information on which the flip angle estimate is based. This effect is illustrated in Fig. 2. The off-resonance effects can be corrected if a B0 map is obtained. However, Fig. 2 shows that for small off-resonance precession angles, off-resonance correction can be neglected without significantly affecting the accuracy of the flip angle estimate. A B0 map was obtained during the in vivo B1 mapping experiment shown in Fig. 5 as part of a proton three-point Dixon acquisition (22), which showed a total range of B0 inhomogeneity of about ±1 ppm. In this experiment, the time τ between the center of the 2α and α excitations was 600 μsec. Thus, the maximum precession angle due to inhomogeneity was ~7°. As Fig. 2 shows, inhomogeneity of this magnitude does not require correction with B0 measurement. The phase-sensitive method fails if the angle of precession exceeds about 58°. This would correspond to B0 inhomogeneity of about ±8 ppm, which is very unlikely to occur in an in vivo imaging situation.
Sodium signal shows biexponential T2 decay with a fast component decaying with a time constant of a few milliseconds (23). This rapid T2 decay can have an effect on the effective flip angle achieved by an RF pulse, as transverse relaxation during the RF pulse results in less than expected transverse magnetization at the end of excitation, thus decreasing the effective flip angle. For the experiments presented in this manuscript, a total RF pulse length of 1.2 msec was used for the phase-sensitive flip angle mapping method. This excitation is long enough that effects of short T2 decay might be expected. However, these effects are not present in our image data because of the relatively long 15 msec TE of our echoplanar acquisition. The data obtained accurately reflect the flip angle of the longer T2 component of sodium and provide an accurate transmission B1 map that is valid for species with other T2. When imaging with very rapid acquisition schemes (such as TPI or 3D cones) where the short T2 component contributes to the measured signal, the effect of short T2 on effective flip angle can be taken into account. This effect can be modeled if the short T2 is known and if a transmission B1 map (based on the longer T2 signal component) has been obtained.
One potential limitation of the phase-sensitive B1 mapping method is that it uses nonselective excitation pulses, which means that the entire sensitive volume of the receive coil must be imaged to avoid aliasing. In some situations, this might require lower image resolution or longer scan time than desired. However, this potential limitation of the phase-sensitive B1 mapping method does not apply to sodium imaging. Sodium imaging typically yields very low SNR, which is improved by increasing voxel size and increasing total acquisition time. Acquisition time may be increased by averaging multiple signals over time. However, it can also be increased by increasing the FOV while leaving voxel volume unchanged. For instance, rather than acquiring four signals and averaging, quadrupling the FOV and acquiring one signal gives equivalent SNR. Thus, in practical sodium imaging situations, it is easy to set up the phase-sensitive B1 mapping method over a FOV larger than the sensitive volume of the coil without requiring extra imaging time; time that would have been spent collecting multiple signal averages may instead be used to image over a larger FOV, with equivalent SNR.
In our experiments, the dual-angle method was also implemented with nonselective pulses for the fairest possible comparison. Implementation of the dual-angle method with slice-selective excitation can lead to marked variation in the slice profile of the α and 2α pulses over a wide range of flip angles, which would negatively affect the accuracy of this method.
CONCLUSION
The phase-sensitive B1 mapping method appears to be an excellent candidate for producing rapid, accurate sodium B1 maps for quantitative sodium MRI. The method is particularly well adapted to the low-SNR environment characteristic of sodium imaging and performed significantly better than the standard dual-angle method in the studies conducted. The phase-sensitive method returned comparable B1 values to the dual-angle method while achieving greater consistency in measurement, a result corroborated through Monte Carlo simulation of each method. A preliminary study in the human breast indicates that the method yields sufficient SNR to provide valuable 3D sodium B1 maps in vivo in clinically feasible scan times.
Acknowledgments
Grant sponsor: NIH; Grant number: 5 K08 CA112449; Grant sponsors: The Ben B. and Iris M. Margolis Foundation, Brigham Young University.
References
- 1.Borthakur A, Shapiro EM, Beers J, Kudchodkar S, Kneeland JB, Reddy R. Sensitivity of MRI to proteoglycan depletion in cartilage: comparison of sodium and proton MRI. Osteoarthritis Cartilage. 2000;8:288–293. doi: 10.1053/joca.1999.0303. [DOI] [PubMed] [Google Scholar]
- 2.Reddy R, Insko EK, Noyszewski EA, Dandora R, Kneeland JB, Leigh JS. Sodium MRI of human articular cartilage in vivo. Magn Reson Med. 1998;39:697–701. doi: 10.1002/mrm.1910390505. [DOI] [PubMed] [Google Scholar]
- 3.Shapiro EM, Borthakur A, Gougoutas A, Reddy R. 23Na MRI accurately measures fixed charge density in articular cartilage. Magn Reson Med. 2002;47:284–291. doi: 10.1002/mrm.10054. [DOI] [PMC free article] [PubMed] [Google Scholar]
- 4.Wheaton AJ, Borthakur A, Shapiro EM, Regatte RR, Akella SV, Kneeland JB, Reddy R. Proteoglycan loss in human knee cartilage: quantitation with sodium MR imaging—feasibility study. Radiology. 2004;231:900–905. doi: 10.1148/radiol.2313030521. [DOI] [PubMed] [Google Scholar]
- 5.Ouwerkerk R, Bleich KB, Gillen JS, Pomper MG, Bottomley PA. Tissue sodium concentration in human brain tumors as measured with 23Na MR imaging. Radiology. 2003;227:529–537. doi: 10.1148/radiol.2272020483. [DOI] [PubMed] [Google Scholar]
- 6.Ouwerkerk R, Jacobs MA, Macura KJ, Wolff AC, Stearns V, Mezban SD, Khouri NF, Bluemke DA, Bottomley PA. Elevated tissue sodium concentration in malignant breast lesions detected with non-invasive 23Na MRI. Breast Cancer Res Treat. 2007;106:151–160. doi: 10.1007/s10549-006-9485-4. [DOI] [PubMed] [Google Scholar]
- 7.Maril N, Rosen Y, Reynolds GH, Ivanishev A, Ngo L, Lenkinski RE. Sodium MRI of the human kidney at 3 Tesla. Magn Reson Med. 2006;56:1229–1234. doi: 10.1002/mrm.21031. [DOI] [PubMed] [Google Scholar]
- 8.Rosen Y, Lenkinski RE. Sodium MRI of a human transplanted kidney. Acad Radiol. 2009;16:886–889. doi: 10.1016/j.acra.2009.01.010. [DOI] [PubMed] [Google Scholar]
- 9.Thulborn KR, Davis D, Snyder J, Yonas H, Kassam A. Sodium MR imaging of acute and subacute stroke for assessment of tissue viability. Neuroimaging Clin N Am. 2005;15:639–653. xi–xii. doi: 10.1016/j.nic.2005.08.003. [DOI] [PubMed] [Google Scholar]
- 10.Boada FE, Gillen JS, Shen GX, Chang SY, Thulborn KR. Fast three dimensional sodium imaging. Magn Reson Med. 1997;37:706–715. doi: 10.1002/mrm.1910370512. [DOI] [PubMed] [Google Scholar]
- 11.Boada FE, Shen GX, Chang SY, Thulborn KR. Spectrally weighted twisted projection imaging: reducing T2 signal attenuation effects in fast three-dimensional sodium imaging. Magn Reson Med. 1997;38:1022–1028. doi: 10.1002/mrm.1910380624. [DOI] [PubMed] [Google Scholar]
- 12.Staroswiecki E, Bangerter N, Gurney P, Grafendorfer T, Gold G, Hargreaves B. In vivo sodium imaging of human patella cartilage with a 3D cones sequence at 3T and 7T. J Magn Reson Imaging. 2010;32:446–451. doi: 10.1002/jmri.22191. [DOI] [PMC free article] [PubMed] [Google Scholar]
- 13.Yushmanov VE, Yanovski B, Kharlamov A, LaVerde G, Boada FE, Jones SC. Sodium mapping in focal cerebral ischemia in the rat by quantitative (23)Na MRI. J Magn Reson Imaging. 2009;29:962–966. doi: 10.1002/jmri.21643. [DOI] [PMC free article] [PubMed] [Google Scholar]
- 14.Morrell GR. A phase-sensitive method of flip angle mapping. Magn Reson Med. 2008;60:889–894. doi: 10.1002/mrm.21729. [DOI] [PubMed] [Google Scholar]
- 15.Morrell G, Schabel M. An analysis of the accuracy of magnetic resonance flip angle measurement methods. Phys Med Biol. 2010;55:6157–6174. doi: 10.1088/0031-9155/55/20/008. [DOI] [PubMed] [Google Scholar]
- 16.Morrell G, Schabel MC. A noise analysis of flip angle mapping methods. Proceedings of the 17th Annual Meeting of ISMRM; Hawaii. 2009. p. 376. [Google Scholar]
- 17.Insko E, Bolinger L. Mapping of the radiofrequency field. J Magn Reson. 1993;103:82–85. [Google Scholar]
- 18.Stollberger R, Wach P. Imaging of the active B1 field in vivo. Magn Reson Med. 1996;35:246–251. doi: 10.1002/mrm.1910350217. [DOI] [PubMed] [Google Scholar]
- 19.Cunningham CH, Pauly JM, Nayak KS. Saturated double-angle method for rapid B1+ mapping. Magn Reson Med. 2006;55:1326–1333. doi: 10.1002/mrm.20896. [DOI] [PubMed] [Google Scholar]
- 20.Yarnykh VL. Actual flip-angle imaging in the pulsed steady state: a method for rapid three-dimensional mapping of the transmitted radiofrequency field. Magn Reson Med. 2007;57:192–200. doi: 10.1002/mrm.21120. [DOI] [PubMed] [Google Scholar]
- 21.Gurney PT, Hargreaves BA, Nishimura DG. Design and analysis of a practical 3D cones trajectory. Magn Reson Med. 2006;55:575–582. doi: 10.1002/mrm.20796. [DOI] [PubMed] [Google Scholar]
- 22.Glover GH, Schneider E. Three-point Dixon technique for true water/fat decomposition with B0 inhomogeneity correction. Magn Reson Med. 1991;18:371–383. doi: 10.1002/mrm.1910180211. [DOI] [PubMed] [Google Scholar]
- 23.Boada FE, Christensen JD, Huang-Hellinger FR, Reese TG, Thulborn KR. Quantitative in vivo tissue sodium concentration maps: the effects of biexponential relaxation. Magn Reson Med. 1994;32:219–223. doi: 10.1002/mrm.1910320210. [DOI] [PubMed] [Google Scholar]


