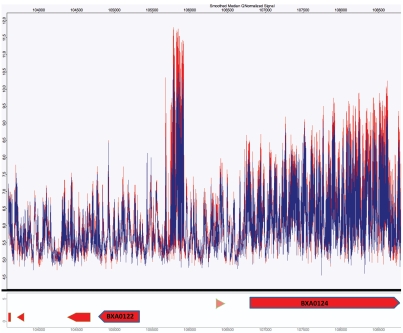
Figure 5.
Analysis of small non-coding RNA of strain 34F2ΔluxS compared to strain 34F2 using an Affymetrix tiled array. A select region (between BXA0122 and BXA0124) based on pXO1 from B. anthracis strain A2012, demonstrating transcriptional activity in intergenic regions. Red indicates the transcriptional activity of the parental strain and blue represents strain 34F2ΔluxS.

