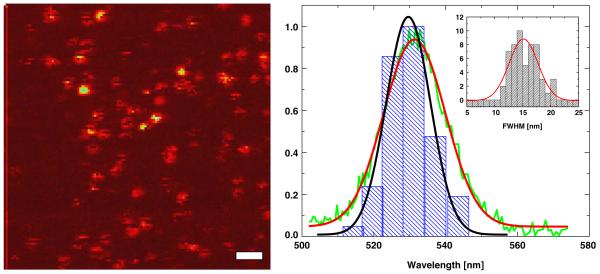
Fig. 3.
Spectral heterogeneity within a single qdot batch. Left: Confocal image of spin cast green CdSe/ZnS qdots. Right: Distribution of spectra peak positions of individual qdots (blue) and Gaussian fit of the distribution (black: full width half maximum distribution: FWHM 14.6 nm) compared to the average spectrum of all qdots (green) and its Gaussian fit (red). The individual spectra have a smaller FWHM (FWHM: 15.2±2.6 nm) (inset) than that of the average spectrum (FWHM: 20.3 nm). Image scale bar: 1 μm, exposition: 100 ms/pixel, excitation: 200 nW at 488 nm. Data acquisition was performed as described in Ref. [28].

