

Abstract
Background
This study sought to determine the relation between and discriminative capability of Lipoprotein-associated phospholipase A2 (Lp-PLA2) and coronary heart disease (CHD) in a large population of disease-free women.
Methods
Among participants of the Nurses’ Health Study who provided a blood sample, there were 421 cases of incident myocardial infarction (MI) during 14 years of follow-up. Controls were matched to cases 2:1 using risk-set sampling based on age, smoking, and blood draw date.
Results
Conditioning on the matching factors, Lp-PLA2 activity was significantly associated with MI (RR=2.86 for extreme quartiles; 95% Confidence Interval (CI): 1.98, 4.12). After adjustment for lipid, inflammatory, and clinical risk factors, the relative risk remained statistically significant was assessed by (RR=1.75; 95%CI: 1.09, 2.84). The discriminative capability of Lp-PLA2 comparing area under the receiver operating characteristic curves (AUROC) for models with and without Lp-PLA2, and by calculating the net reclassification improvement index (NRI). Adding Lp-PLA2 activity to a multivariable-adjusted model increased the AUROC from 0.720 to 0.733, and significantly improved the NRI (p = 0.004).
Conclusions
Levels of Lp-PLA2 activity were significantly associated with incident CHD among women. In addition, Lp- PLA2 activity added significantly to CHD risk discrimination.
INTRODUCTION
Heart disease is the leading cause of death for both men and women in industrialized countries.1 Although a number of risk factors for heart disease have been identified, coronary heart disease (CHD) still occurs in people who lack any traditional risk factors.2 The recognition that CHD is an inflammatory disease3 has led to the search for potential biomarkers that play a role in the etiology of CHD or serve as predictors of CHD risk. Such studies have examined a number of these general inflammatory biomarkers, including C-reactive protein,4 interleukin 6,5 and tumor necrosis factor α.6
One recently identified inflammatory biomarker, lipoprotein-associated phospholipase A2 (Lp-PLA2), is a calcium-independent member of the superfamily of phospholipase A2 enzymes. This 45.4 kDa protein is secreted by monocytes, macrophages, T lymphocytes, and mast cells, and binds to the carboxy terminus of apolipoprotein B-100 to circulate with LDL. Eighty percent of Lp-PLA2 circulates bound to LDL, with apparent binding preference for small, dense and electronegative LDL.7 Lp-PLA2 hydrolyzes the sn2 ester bond of oxidized phospholipids to produce lysophosphatidacholine and non-esterified fatty acids,8 two inflammatory compounds that act within the intima of atherosclerotic lesions to perpetuate inflammation.8
Epidemiologic studies of circulating Lp-PLA2 and cardiovascular disease have consistently demonstrated a positive association for both Lp-PLA2 concentration9–11 and Lp-PLA2 activity11–14, in both healthy populations10, 12, 13 and clinical populations.9, 11, 14 However, few of these studies of Lp-PLA2 activity were in large healthy populations. Furthermore, few studies have characterized the predictive capability and potential clinical utility of Lp-PLA2 activity.15, 16
Therefore, the aim of this study is to assess the association between Lp-PLA2 activity and incident CHD in a large population of disease-free women. In addition, we seek to examine the discriminatory ability of Lp-PLA2 by analyzing change in AUC as well as the net reclassification after adding Lp-PLA2 activity to a multivariable model using a novel method that accounts for the sampling structure in this case-control study. In addition to providing information about risk prediction, markers such as Lp-PLA2 that can add to prediction also can uncover important etiologic pathways for cardiovascular disease.
METHODS
Study population
The Nurses’ Health Study (NHS) is a prospective cohort study of 121,700 U.S. female nurses who were 30–55 years old at baseline in 1976. Between 1989 and 1990, 32,826 women provided a blood sample. Participants are followed through biennial mailed questionnaires that collect information on lifestyle factors and health behaviors. Participants were followed until their first cardiovascular event, incidence of cancer, or death. Through June 30, 2004, we documented an incident myocardial infarction (MI) among 421 women who were free of cardiovascular disease and cancer at the time of blood draw. These included 352 cases of nonfatal MI and 69 cases of fatal CHD. Mean follow-up time among cases was 7.5 years (SD = 3.9; range 1 month – 14 years). Through risk set sampling methods, two controls free of cardiovascular disease and cancer up to the date of diagnosis of the paired case were randomly selected and matched on age (in two-year categories), smoking (never, past, current: 1–14 cigarettes/day, 15+ cigarettes/day), month of blood draw, fasting status and reported problems during blood draw. This study was approved by the institutional review board of Brigham and Women’s Hospital and the Human Subjects Committee Review Board of Harvard School of Public Health. This study was supported by research grant HL34594 from the National Heart Lung and Blood Institute. Additional support was provided by GlaxoSmithKline. GlaxoSmithKline had no access to the data and the academic institution had full and final right to publish.
Endpoint
Nonfatal MI was confirmed according to the World Health Organization criteria of symptoms plus either typical electrocardiographic changes or elevated cardiac enzyme levels by physicians blinded to exposure status. MIs that required hospital admission and for which confirmatory information was obtained by interview or letter, but for which no medical records were available (n=9), were designated as probable and included in the analysis. Participant deaths were reported by next of kin, the postal system, and through the records of the National Death Index; follow-up for deaths is estimated to be greater than 98% using these three sources combined.17 Fatal CHD was confirmed by reviewing medical records or autopsy reports with permission from next of kin. Fatal CHD was defined as ICD-9 codes 410 to 412 if confirmed by hospital records or autopsy, or if CHD was the most likely cause and was listed as the cause of death on the death certificate, along with evidence of prior CHD. We designated as probable fatal CHD those cases in which CHD was the underlying cause on the death certificate but for which no medical records concerning the death were available (n=16), and included these cases in the analyses. Potential cases for whom CHD could not confirmed were excluded, as were their matched controls. Physicians who reviewed records were blinded to risk factor status.
Blood collection and laboratory measurements
Participants were sent a blood collection kit that included instructions and supplies. Blood samples were collected in heparin blood tubes, chilled, and sent back by prepaid overnight courier. Upon arrival, samples were centrifuged and stored in cryotubes as plasma, buffy coat, and red blood cells. Cryotubes were then stored in liquid nitrogen freezers at −130°C or lower.
Lp-PLA2 activity was measured by CAM-colorimetric activity test automated assay (GlaxoSmithKline, Research Triangle Park, NC) performed on a clinical chemistry analyzer using a colorimetric substrate for Lp-PLA2, which is similar to platelet activating factor with the addition of a nitro-phenol label at the sn2 position. Hydrolysis of the colorimetric substrate is monitored by changes in visible absorbance over time (nmols/min/mL) using a standard curve for nitrophenol absorbance. Coefficients of variation (CVs) were 4.3%.
Concentrations of total cholesterol, triglycerides, and HDL cholesterol were measured simultaneously on the Hitachi 911 analyzer using reagents and calibrators from Roche Diagnostics (Indianapolis, IN); CVs were <1.8%. LDL cholesterol concentration was measured by a homogenous direct method from Genzyme (Cambridge, MA); CVs were <3.1%. HbA1c concentrations were based on turbidimetric immunoinhibition with hemolyzed whole blood or packed red cells; CVs were <3.0%. ICAM-1 was measured by a commercial enzyme-linked immunosorbent assay (R & D Systems, Minneapolis, Minn); CVs were <3.6%. CRP was measured with the US CRP ELISA kit (Diagnostic Systems Laboratories, Inc, Webster, TX); CV was <5.1%.
Assessment of lifestyle exposures
On biennial questionnaires participants provided information about their age, weight, smoking status, aspirin use, cholesterol-lowering medication use, hormone therapy use, and physical activity. We calculated BMI as the ratio of weight (in kilograms) over height (in meters) squared. Physical activity was calculated as metabolic equivalents per week using the duration of moderate or vigorous forms of exercise multiplied by the intensity of the activity. History of hypertension, diabetes, and family history of MI were determined from self-reports before blood collection. Alcohol use was estimated with a dietary food frequency questionnaire. Lifestyle exposures used for these analyses were those assessed in 1990.
Statistical analysis
Differences in baseline characteristics between cases and controls were assessed using Student’s t-test for variables expressed as means, by Wilcoxon’s rank-sum test for variables expressed as medians, and by the chi-square test for variables expressed as percentages. Age-adjusted Spearman correlations were computed to assess the association between Lp-PLA2 activity and cardiovascular risk biomarkers. Lp-PLA2 activity was divided into quartiles based on the distribution among the controls. Odds ratios and 95% confidence intervals were calculated using conditional logistic regression, conditioning on the matching factors.
Because risk set sampling was used, odds ratios directly estimate the incidence rate ratio. Multivariable models additionally adjusted for BMI (kg/m2), physical activity (MET hours/week), family history of MI, history of hypertension, history of diabetes, alcohol intake (grams/day), aspirin use (none, 1–2/week, 3–6/week, 7–14/week, 15+/week), cholesterol-lowering medication use, HDL, LDL, HbA1c, log CRP, and hormone replacement therapy (never, past, current). Because 55% and 67% of participants were missing ICAM and fasting triglycerides, respectively, these two variables were not included in multivariable models. Tests for linear trends were conducted by treating the median value for each quintile of Lp-PLA2 activity as a continuous variable. We modeled Lp-PLA2 activity continuously and tested for deviations from linearity using restricted cubic splines; using this method we found no deviations from linearity. We stratified by time (0 – 6 years of follow-up, > 6 years of follow-up) and assessed the relation between Lp-PLA2 and CHD using conditional logistic regression based on the overall Lp-PLA2 distribution among controls. We assessed potential effect modification by HRT use, LDL, CRP, and HDL using -2 Log Likelihood tests comparing an unconditional logistic regression model with the matching factors and main effects only and a model that included the matching factors, main effects, and an additional cross-classification term.
Because this sample is a matched case-control study, any measures that rely on specificity calculations or absolute risk (e.g., the area under the receiver operating characteristic (AUROC) curve) are not valid, as the distribution among controls does not reflect the population distribution.18 We therefore calculated weights that represent the distribution of age and smoking strata in the total cohort, and used these in all prediction analyses to re-weight the case-control sample to reflect the population distributions of age and smoking among cases and controls. To examine the discriminative capability of Lp-PLA2 we compared the AUROC for a multivariable unconditional logistic regression model with and without adjustment for Lp-PLA2. We also calculated the net reclassification improvement (NRI) of adding Lp-PLA2 in the model by forming weighted reclassification tables separately for cases and controls.19 Participants were first categorized into quartiles based on the rank of their predicted risk derived from a multivariable unconditional logistic regression model that included all measured risk factors but that did not include Lp-PLA2 activity. We then calculated the percentage women classified into higher or lower relative risk categories after inclusion of Lp-PLA2 into the model. All analyses were performed using SAS software, version 9.1 (SAS Institute Inc, Cary, NC).
RESULTS
Lp-PLA2 activity was higher in cases than in controls (Table I). As expected, traditional CHD risk factors, including LDL, HDL, triglycerides, BMI, history of hypertension, history of high cholesterol, history of diabetes, and HbA1c were significantly different in cases and controls.
Table I.
Baseline characteristics of 1221 women from the Nurses’ Health Study in 1990
| Cases (n=421) | Controls (n=800) | P-value | |
|---|---|---|---|
| Lp-PLA2 ng/mm/mL Mean (range) | 169.2 (50.3 – 292.0) | 153.7 (45.9 – 371.4) | <0.001 |
| Age, (mean years) | 59.9 | 59.9 | -- |
| Current smoking, % | 27 | 27 | -- |
| BMI, (mean kg/m2) | 26.7 | 25.1 | <0.001 |
| Postmenopausal Hormone use, % | 35 | 38 | 0.27 |
| Family history of MI, % | 21 | 12 | <0.001 |
| History of hypertension, % | 50 | 27 | <0.001 |
| History of hypercholesterolemia, % | 53 | 41 | <0.001 |
| History of diabetes, % | 14 | 6 | <0.001 |
| Cholesterol medication use % | 4 | 3 | 0.08 |
| LDL (mean mg/dl) | 144.1 | 136.1 | <0.001 |
| HDL (mean mg/dl) | 52.3 | 60.0 | <0.001 |
| Triglycerides (median mg/dl)* | 126.0 | 99.0 | <0.001 |
| HbA1c (%) | 5.9 | 5.5 | <0.001 |
| CRP (median mg/L) | 2.6 | 2.0 | 0.01 |
| ICAM (median ng/mL)† | 293.0 | 279.0 | 0.08 |
| Physical activity (mean MET-hr/wk) | 18.5 | 19.2 | 0.60 |
| Alcohol (mean g/day) | 4.8 | 6.2 | 0.02 |
Abbreviations: n, Number of Participants
293 cases and 534 controls have fasting triglyceride measurements
253 cases and 422 controls have ICAM measurements
Among controls, Lp-PLA2 activity was modestly positively correlated with total and LDL cholesterol, apolipoprotein B, fasting triglycerides, ICAM, BMI, and age. Lp-PLA2 was negatively correlated with HDL cholesterol. No correlation between CRP or HbA1c and Lp- PLA2 activity was observed (Table II).
Table II.
Age-adjusted Spearman correlation coefficients (r) between plasma Lp-PLA2 activity and selected cardiovascular risk factors among 800 controls from the Nurses’ Health Study in 1990
| Characteristic | r | |
|---|---|---|
| Age, years | 0.10 |
P-value |
| Cholesterol (mg/dl) | <0.001 | |
| Total | 0.30 | <0.001 |
| LDL | 0.48 | <0.001 |
| HDL | −0.41 | <0.001 |
| Triglycerides (mg/dl)* | 0.15 | <0.001 |
| Apolipoprotein B (mg/dl) | 0.41 | <0.001 |
| CRP (mg/dl) | −0.09 | <0.001 |
| HbA1c (%) | 0.02 | 0.01 |
| BMI (kg/m2) | 0.09 | 0.49 |
| ICAM† | 0.16 | 0.01 |
Abbreviations: r, Correlation Coefficient
N = 539 for fasting triglycerides
N = 422
Conditioning on matching factors, the relative risk of CHD was 2.86 (95%CI: 1.98, 4.12; P for trend < 0.001), comparing persons in the highest quartile of Lp-PLA2 activity to the lowest quartile. After multivariable adjustment for traditional non-lipid risk factors, this relationship was not affected. The multivariate risk of CHD comparing extreme quartiles was 2.60 (95%CI: 1.72, 3.92; P for trend < 0.001). Additional adjustment for lipid-related variables, including LDL, HDL, history of high cholesterol, and cholesterol-lowering medication use, only modestly affected the association (RR=1.75; 95%CI: 1.09, 2.84) (Table III). The relation between Lp-PLA2 activity and CHD is primarily affected by adjustment for HDL in women. There were no significant interactions between Lp-PLA2 and HDL, LDL, CRP, or hormone therapy use (−2 log likelihood P-values > 0.05 in all models; data not shown).
Table III.
Relative risks and 95% confidence intervals for CHD from the Nurses’ Health Study (1990 – 2004) according to baseline Lp-PLA2 activity levels
| Quartiles of Lp-PLA2 | p-trend | ||||
|---|---|---|---|---|---|
| Q1 | Q2 | Q3 | Q4 | ||
| Women | |||||
| Cases | 60 | 83 | 116 | 162 | |
| Controls | 200 | 198 | 202 | 200 | |
| Mean Lp-PLA2 (range); cases* | 107.5 (50.3 – 126.6) | 142.2 (128.9 – 151.9) | 163.9 (152.2 – 175.5) | 209.8 (175.8 – 292.0) | |
| Mean (range); controls* | 110.1 (45.9 – 128.0) | 139.5 (128.4 – 152.1) | 163.0 (152.2 – 175.7) | 205.4 (175.8 – 371.4) | |
| Matching factors adjusted model† RR | 1.0 | 1.46 | 1.93 | 2.86 | <0.001 |
| 95% CI | 0.98, 2.17 | 1.33, 2.80 | 1.98, 4.12 | ||
| Multivariable + lipid adjusted model‡ RR | 1.0 | 1.32 | 1.59 | 1.75 | 0.03 |
| 95% CI | 0.85, 2.05 | 1.03, 2.45 | 1.09, 2.84 | ||
Abbreviations: CHD, Coronary Heart Disease; Q, Quartile; RR, relative risk; CI, Confidence Interval
Quartiles based on the distribution of the controls
RR estimated by conditional logistic regression after conditioning on matching factors (smoking, age, fasting status, month of blood draw)
Multivariable model adjusted for BMI, history of high cholesterol, history of diabetes, history of hypertension, alcohol use, aspirin use, cholesterol-lowering medication use, physical activity, CRP, HDL, postmenopausal hormone use, HDL, LDL, history of high cholesterol, and cholesterol-lowering medication use
Lp-PLA2 circulates bound to LDL and therefore may contribute to LDL’s effect on cardiovascular disease. In the multivariable-adjusted model without Lp-PLA2, LDL quartile was a significant predictor of CHD (RR = 1.59 for extreme quartiles; 95%CI: 1.03, 2.45). After further adjustment for Lp-PLA2 activity, this relationship was attenuated (RR=1.28; 95% CI: 0.81, 2.06).
We examined the relation between Lp-PLA2 activity and CHD within early (the first six) and later (the last eight) years of follow-up. After multivariable adjustment including LDL, the relation between Lp-PLA2 and CHD was qualitatively stronger during the first six years of follow-up (Table IV), although an interaction by length of follow-up was not significant (P=0.53). The relative risk comparing extreme quartiles in a model conditioning on the matching factors was 3.50 (95%CI: 2.12, 5.77; P for trend < 0.001) during the first six years of follow-up and was 2.20 (95%CI: 1.27, 3.80; P for trend < 0.001) during the following eight years of follow-up. After multivariable adjustment, this relationship remained statistically significant for the first six years (p=0.04), but not for the last eight years (p=0.13).
Table IV.
Relative risks and 95% confidence intervals for CHD from the Nurses’ Health Study (1990 – 2004) according to baseline Lp-PLA2 activity levels stratified by early vs. late events
| Quartiles of Lp-PLA2 | P-trend | ||||
|---|---|---|---|---|---|
| Q1 | Q2 | Q3 | Q4 | ||
| EARLY (≤ 6 years of follow-up) | |||||
| Women | |||||
| Cases | 30 | 50 | 69 | 94 | |
| Matching factors adjusted model* RR | 1.0 | 1.93 | 2.33 | 3.50 | <0.001 |
| 95% CI | 1.13, 3.31 | 1.42, 3.83 | 2.12, 5.77 | ||
| Multivariable + lipid adjusted model† RR | 1.0 | 1.67 | 1.90 | 1.94 | 0.04 |
| 95% CI | 0.91, 3.07 | 1.07, 3.40 | 1.04, 3.74 | ||
| LATE (> 6 years of follow-up) | |||||
| Women | |||||
| Cases | 30 | 33 | 47 | 68 | |
| Matching factors adjusted model* RR | 1.0 | 1.0 | 1.51 | 2.20 | <0.001 |
| 95% CI | 0.55, 1.83 | 0.86, 2.64 | 1.27, 3.80 | ||
| Multivariable + lipid adjusted model† RR | 1.0 | 1.02 | 1.35 | 1.58 | 0.13 |
| 95% CI | 0.53, 1.97 | 0.68, 2.68 | 0.74, 3.37 | ||
Abbreviations: CHD, Coronary Heart Disease; Q, Quartile; RR, relative risk; CI, Confidence Interval
RR estimated by conditional logistic regression after conditioning on matching factors (smoking, age, fasting status, month of blood draw)
Multivariable model adjusted for BMI, history of high cholesterol, history of diabetes, history of hypertension, alcohol use, aspirin use, cholesterol-lowering medication use, physical activity, CRP, postmenopausal hormone use, HDL, LDL, history of high cholesterol, and cholesterol-lowering medication use
To determine whether Lp-PLA2 activity adds predictive information to models of CHD risk, we calculated the AUROC for multivariable-adjusted models with and without Lp-PLA2 activity, weighted according to the population distribution of age and smoking. Adding Lp- PLA2 activity to a multivariable model increased the AUROC from 0.720 to 0.734. We also looked at improvement in classification (Table V). Adding Lp-PLA2 activity to the multivariable-adjusted model led to 23.3% reclassification among cases and 32.3% reclassification among controls. Among the 421 cases, inclusion of Lp-PLA2 activity reclassified 13.3% of women as higher but 9.9% of women as lower, indicating a reclassification improvement of 3.4% among cases. Among the 800 controls, inclusion of Lp-PLA2 activity reclassified 19.0% of women as lower, but 13.6% of women as higher, indicating a reclassification improvement of 5.4% among controls. Adding Lp-PLA2 activity to the model led to a statistically significant improvement in reclassification (P = 0.004), with an overall net reclassification improvement of 8.8%.
Table V.
CHD risk reclassification* comparing multivariable-adjusted† logistic regression models with and without Lp-PLA2activity among 1221 women from the Nurses’ Health Study (1990 – 2004), weighted by age and smoking categories‡
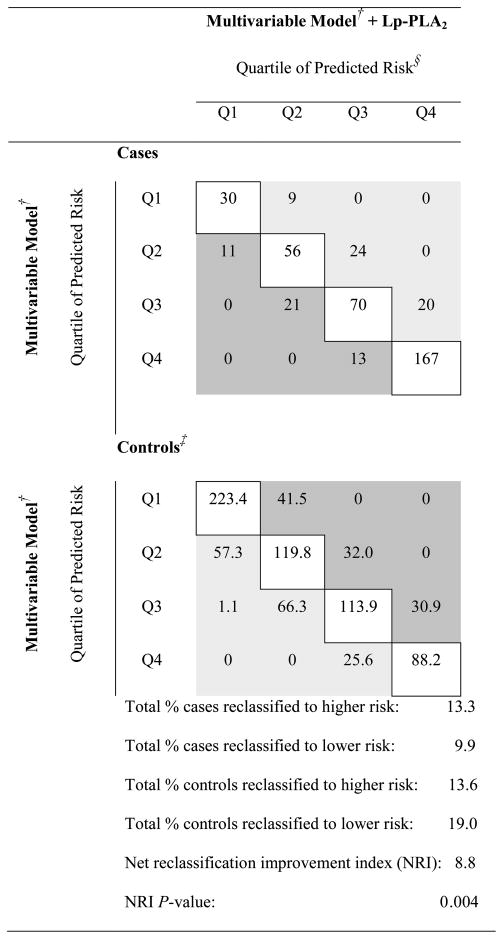 |
Abbreviations: Q, Quartile; NRI, Net Reclassification Improvement Index
Light gray shading indicates correct reclassification with the addition of Lp-PLA2 activity in the multivariable model (higher predicted risk for cases, lower predicted risk for controls); dark grey indicates incorrect reclassification (lower predicted risk for cases, higher predicted risk for controls); unshaded indicates no reclassification.
Multivariable model conditioned on matching factors (smoking, age, fasting status, month of blood draw) and adjusted for BMI, history of high cholesterol, history of diabetes, history of hypertension, alcohol use, aspirin use, cholesterol-lowering medication use, physical activity, CRP, HDL, and postmenopausal hormone use
Models are weighted according to the population (total cohort) distribution of age and sex categories; thus control cells reflect the weighted individuals in the case-control sample
Quartiles based on the distribution of risk score from the multivariable model (without Lp-PLA2 activity)
DISCUSSION
In this nested case-control study we found that Lp-PLA2 activity was significantly associated with CHD among women. The relationship between Lp-PLA2 activity and CHD among was not explained by traditional lifestyle, clinical, lipid, or inflammatory risk factors. In addition, Lp-PLA2 activity added significantly to risk prediction, as assessed by both the area under the receiver operating curve and the net reclassification improvement index.
In the present study, the relation between Lp-PLA2 activity and CHD appeared stronger during the first six years of follow-up. However, the present study may be underpowered to detect an effect during later follow-up, and future studies should confirm this observation. Although there is no clear pattern in the literature of Lp-PLA2 activity and CHD by length of follow-up, in a previous analysis among diabetics, we found a similar pattern, with the effect of Lp-PLA2 activity more pronounced for earlier CHD events.20 This is consistent with observations that high levels of Lp-PLA2 have been found in vulnerable and ruptured plaques, implicating Lp-PLA2 in promotion of plaque instability.21 Epidemiological evidence has been consistent with this finding, as studies that have looked at cardiovascular endpoints earlier in disease progression, such as coronary calcification22 and extracoronary atherosclerosis,23 have found no significant association between Lp-PLA2 activity and these outcomes after adjusting for traditional risk factors.
To address whether Lp-PLA2 activity provides predictive information beyond traditional risk factors, studies have looked at the added prognostic value of including Lp-PLA2 in risk prediction models. In a recent investigation in the population-based ARIC study, the authors found that of 19 novel biomarkers, Lp-PLA2 concentration was the only biomarker to add significantly to the area under the receiver operating characteristic curves.16 However, analyses of the receiver operating curves are insensitive when examining change in the AUC from adding new predictors to the model.19, 24 The net reclassification index is a more sensitive method for assessing the predictive ability of new markers that quantifies correct reclassification – up in risk for cases, down in risk for controls – relative to the amount of incorrect reclassification – down in risk for cases, up in risk for controls. In a recent study of novel predictors of CHD, Lp-PLA2 activity did not significantly improve net reclassification.15 In the present study, however, addition of Lp-PLA2 activity to a traditional risk factors model led to a statistically significant increase in prediction ability, as measured by both the AUROC and by the net reclassification index among women. After accounting for the sampling structure employed during matching, Lp-PLA2 activity lead to a net of 7.9% improvement in prediction, with a 3.5% gain in predictive ability among cases, and a 4.4% gain among female controls.
This study has several limitations. First, biomarkers including Lp-PLA2 have only been measured at baseline, which may lead to modest misclassification over time when estimating long-term average Lp-PLA2 activity. Although a pilot study among men from the Health Professionals’ Follow-up Study demonstrated that Lp-PLA2 activity is highly reproducible when comparing two samples measured one year apart (Intraclass r = 0.87; n=15; unpublished observation), we have no information about consistency of Lp-PLA2 activity over longer periods of time. Second, these analyses were performed on a cohort of overwhelmingly Caucasian (>95% in each cohort) women, which may lead to lack of generalizability to other races. Other studies have documented differences in levels of Lp-PLA2 by race, but no study has documented effect modification of the relation between Lp-PLA2 and CHD. Third, this study analyzed the relation between CHD and Lp-PLA2 activity in women only, and these results may not be extrapolated to men. Finally, we have measured only Lp-PLA2 activity and have no measurements on Lp-PLA2 concentration. Reported correlations between Lp-PLA2 concentration and activity have ranged from 0.36 in a population with prevalent CHD14 to 0.86 in a general population.25 It is unclear which parameterization of Lp-PLA2 will ultimately be most relevant for prediction and etiology, although a recent pooled analysis indicated similar and consistent across both measurements.26 Future studies with both measurements should tease out these distinct pathways.
In summary, we found that Lp-PLA2 activity was associated with increased risk of incident CHD in women. In addition, we found that Lp-PLA2 activity significantly added to prediction of CHD above and beyond traditional risk factors and significantly improved risk classification. Differences by length of follow-up indicate it may be beneficial for future studies to account for this when assessing the relation between Lp-PLA2 activity and CHD. Future studies may reproduce these results and further clarify whether Lp-PLA2 is useful as a clinical marker of cardiovascular risk.
Footnotes
Publisher's Disclaimer: This is a PDF file of an unedited manuscript that has been accepted for publication. As a service to our customers we are providing this early version of the manuscript. The manuscript will undergo copyediting, typesetting, and review of the resulting proof before it is published in its final citable form. Please note that during the production process errors may be discovered which could affect the content, and all legal disclaimers that apply to the journal pertain.
References
- 1.Murray CJ, Lopez AD. Global mortality, disability, and the contribution of risk factors: Global Burden of Disease Study. Lancet. 1997;349(9063):1436–42. doi: 10.1016/S0140-6736(96)07495-8. [DOI] [PubMed] [Google Scholar]
- 2.Khot UN, Khot MB, Bajzer CT, Sapp SK, Ohman EM, Brener SJ, et al. Prevalence of conventional risk factors in patients with coronary heart disease. Jama. 2003;290(7):898–904. doi: 10.1001/jama.290.7.898. [DOI] [PubMed] [Google Scholar]
- 3.Hansson GK, Libby P. The immune response in atherosclerosis: a double-edged sword. Nat Rev Immunol. 2006;6(7):508–19. doi: 10.1038/nri1882. [DOI] [PubMed] [Google Scholar]
- 4.Cook NR, Buring JE, Ridker PM. The effect of including C-reactive protein in cardiovascular risk prediction models for women. Ann Intern Med. 2006;145(1):21–9. doi: 10.7326/0003-4819-145-1-200607040-00128. [DOI] [PubMed] [Google Scholar]
- 5.Danesh J, Kaptoge S, Mann AG, Sarwar N, Wood A, Angleman SB, et al. Long-term interleukin-6 levels and subsequent risk of coronary heart disease: two new prospective studies and a systematic review. PLoS Med. 2008;5(4):e78. doi: 10.1371/journal.pmed.0050078. [DOI] [PMC free article] [PubMed] [Google Scholar]
- 6.Pai JK, Pischon T, Ma J, Manson JE, Hankinson SE, Joshipura K, et al. Inflammatory markers and the risk of coronary heart disease in men and women. N Engl J Med. 2004;351(25):2599–610. doi: 10.1056/NEJMoa040967. [DOI] [PubMed] [Google Scholar]
- 7.Gazi I, Lourida ES, Filippatos T, Tsimihodimos V, Elisaf M, Tselepis AD. Lipoprotein-associated phospholipase A2 activity is a marker of small, dense LDL particles in human plasma. Clin Chem. 2005;51(12):2264–73. doi: 10.1373/clinchem.2005.058404. [DOI] [PubMed] [Google Scholar]
- 8.Zalewski A, Macphee C. Role of lipoprotein-associated phospholipase A2 in atherosclerosis: biology, epidemiology, and possible therapeutic target. Arterioscler Thromb Vasc Biol. 2005;25(5):923–31. doi: 10.1161/01.ATV.0000160551.21962.a7. [DOI] [PubMed] [Google Scholar]
- 9.Brilakis ES, McConnell JP, Lennon RJ, Elesber AA, Meyer JG, Berger PB. Association of lipoprotein-associated phospholipase A2 levels with coronary artery disease risk factors, angiographic coronary artery disease, and major adverse events at follow-up. Eur Heart J. 2005;26(2):137–44. doi: 10.1093/eurheartj/ehi010. [DOI] [PubMed] [Google Scholar]
- 10.Koenig W, Khuseyinova N, Lowel H, Trischler G, Meisinger C. Lipoprotein-associated phospholipase A2 adds to risk prediction of incident coronary events by C-reactive protein in apparently healthy middle-aged men from the general population: results from the 14-year follow-up of a large cohort from southern Germany. Circulation. 2004;110(14):1903–8. doi: 10.1161/01.CIR.0000143377.53389.C8. [DOI] [PubMed] [Google Scholar]
- 11.Koenig W, Twardella D, Brenner H, Rothenbacher D. Lipoprotein-associated phospholipase A2 predicts future cardiovascular events in patients with coronary heart disease independently of traditional risk factors, markers of inflammation, renal function, and hemodynamic stress. Arterioscler Thromb Vasc Biol. 2006;26(7):1586–93. doi: 10.1161/01.ATV.0000222983.73369.c8. [DOI] [PubMed] [Google Scholar]
- 12.Persson M, Hedblad B, Nelson JJ, Berglund G. Elevated Lp-PLA2 levels add prognostic information to the metabolic syndrome on incidence of cardiovascular events among middle-aged nondiabetic subjects. Arterioscler Thromb Vasc Biol. 2007;27(6):1411–6. doi: 10.1161/ATVBAHA.107.142679. [DOI] [PubMed] [Google Scholar]
- 13.Oei HH, van der Meer IM, Hofman A, Koudstaal PJ, Stijnen T, Breteler MM, et al. Lipoprotein-associated phospholipase A2 activity is associated with risk of coronary heart disease and ischemic stroke: the Rotterdam Study. Circulation. 2005;111(5):570–5. doi: 10.1161/01.CIR.0000154553.12214.CD. [DOI] [PubMed] [Google Scholar]
- 14.O’Donoghue M, Morrow DA, Sabatine MS, Murphy SA, McCabe CH, Cannon CP, et al. Lipoprotein-associated phospholipase A2 and its association with cardiovascular outcomes in patients with acute coronary syndromes in the PROVE IT-TIMI 22 (PRavastatin Or atorVastatin Evaluation and Infection Therapy-Thrombolysis In Myocardial Infarction) trial. Circulation. 2006;113(14):1745–52. doi: 10.1161/CIRCULATIONAHA.105.612630. [DOI] [PubMed] [Google Scholar]
- 15.Melander O, Newton-Cheh C, Almgren P, Hedblad B, Berglund G, Engstrom G, et al. Novel and conventional biomarkers for prediction of incident cardiovascular events in the community. JAMA. 2009;302(1):49–57. doi: 10.1001/jama.2009.943. [DOI] [PMC free article] [PubMed] [Google Scholar]
- 16.Folsom AR, Chambless LE, Ballantyne CM, Coresh J, Heiss G, Wu KK, et al. An assessment of incremental coronary risk prediction using C-reactive protein and other novel risk markers: the atherosclerosis risk in communities study. Arch Intern Med. 2006;166(13):1368–73. doi: 10.1001/archinte.166.13.1368. [DOI] [PubMed] [Google Scholar]
- 17.Stampfer MJ, Willett WC, Speizer FE, Dysert DC, Lipnick R, Rosner B, et al. Test of the National Death Index. Am J Epidemiol. 1984;119(5):837–9. doi: 10.1093/oxfordjournals.aje.a113804. [DOI] [PubMed] [Google Scholar]
- 18.Janes H, Pepe MS. Matching in studies of classification accuracy: implications for analysis, efficiency, and assessment of incremental value. Biometrics. 2008;64(1):1–9. doi: 10.1111/j.1541-0420.2007.00823.x. [DOI] [PubMed] [Google Scholar]
- 19.Pencina MJ, D’Agostino RB, Sr, D’Agostino RB, Jr, Vasan RS. Evaluating the added predictive ability of a new marker: from area under the ROC curve to reclassification and beyond. Stat Med. 2008;27(2):157–72. doi: 10.1002/sim.2929. discussion 207–12. [DOI] [PubMed] [Google Scholar]
- 20.Hatoum IJ, Hu FB, Nelson JJ, Rimm EB. Lipoprotein-associated phospholipase A2 activity and incident coronary heart disease among men and women with type 2 diabetes. Diabetes. 59(5):1239–43. doi: 10.2337/db09-0730. [DOI] [PMC free article] [PubMed] [Google Scholar]
- 21.Kolodgie FD, Burke AP, Skorija KS, Ladich E, Kutys R, Makuria AT, et al. Lipoprotein-associated phospholipase A2 protein expression in the natural progression of human coronary atherosclerosis. Arterioscler Thromb Vasc Biol. 2006;26(11):2523–9. doi: 10.1161/01.ATV.0000244681.72738.bc. [DOI] [PubMed] [Google Scholar]
- 22.Kardys I, Oei HH, Hofman A, Oudkerk M, Witteman JC. Lipoprotein-associated phospholipase A2 and coronary calcification. The Rotterdam Coronary Calcification Study. Atherosclerosis. 2007;191(2):377–83. doi: 10.1016/j.atherosclerosis.2006.04.004. [DOI] [PubMed] [Google Scholar]
- 23.Kardys I, Oei HH, van der Meer IM, Hofman A, Breteler MM, Witteman JC. Lipoprotein-associated phospholipase A2 and measures of extracoronary atherosclerosis: the Rotterdam Study. Arterioscler Thromb Vasc Biol. 2006;26(3):631–6. doi: 10.1161/01.ATV.0000201289.83256.cf. [DOI] [PubMed] [Google Scholar]
- 24.Cook NR. Use and misuse of the receiver operating characteristic curve in risk prediction. Circulation. 2007;115(7):928–35. doi: 10.1161/CIRCULATIONAHA.106.672402. [DOI] [PubMed] [Google Scholar]
- 25.Caslake MJ, Packard CJ, Suckling KE, Holmes SD, Chamberlain P, Macphee CH. Lipoprotein-associated phospholipase A(2), platelet-activating factor acetylhydrolase: a potential new risk factor for coronary artery disease. Atherosclerosis. 2000;150(2):413–9. doi: 10.1016/s0021-9150(99)00406-2. [DOI] [PubMed] [Google Scholar]
- 26.Thompson A, Gao P, Orfei L, Watson S, Di Angelantonio E, Kaptoge S, et al. Lipoprotein-associated phospholipase A(2) and risk of coronary disease, stroke, and mortality: collaborative analysis of 32 prospective studies. Lancet. 375(9725):1536–44. doi: 10.1016/S0140-6736(10)60319-4. [DOI] [PMC free article] [PubMed] [Google Scholar]