Abstract
The microcracking and damage accumulation process in human cortical bone was characterized by performing cyclic loading under four-point bending at ambient temperature. A non-destructive nuclear magnetic resonance (NMR) spin-spin (T2) relaxation technique was applied to quantify the apparent changes in bone porosity as a function of cyclic loading and prior damage accumulation, first to unloaded cortical bone to quantify the initial porosity and then to fatigued cortical bone that was subjected to cyclic loading to various levels of modulus degradation and microdamage in the form of microcracks. The NMR T2 relaxation time and amplitude data of the fatigued bone were compared against the undamaged state. The difference in the T2 relaxation time data was taken as a measure of the increase in pore size, bone porosity or microcrack density due to microdamage induced by cyclic loading. A procedure was developed to deduce the number and size distributions of microcracks formed in cortical bone. Serial sectioning of the fatigued bone showed the formation of microcracks along the cement lines or within the interstitial tissue. The results on the evolution of microdamage derived from NMR measurements were verified by independent experimental measurements of microcrack density using histological characterization techniques. The size distribution and population of the microcracks were then utilized in conjunction with an analytical model to predict the degradation of the elastic modulus of cortical bone as a function of damage accumulation.
Keywords: microdamage, bone fatigue, NMR T2 relaxation time data, property degradation
INTRODUCTION
Bone damage has been implicated as a contributing factor governing bone fragility in diseases such as osteoporosis and in repetitive loading injuries such as stress fractures. Bone microdamage occurs naturally (in vivo) (Burr et al., 1997; Frost, 1960; Norman and Wang, 1997). Laboratory experiments, both in vitro and in vivo, where bone is cyclically loaded at physiological levels of stress or strain, have produced microdamage (Burr et al., 1985; Schaffler et al., 1989). Bone microdamage is typically defined as bone matrix failure detectable by light microscopy (Burr et al., 1997) in the form of microcracks. Microcracks have been defined as cracks that can be detected using relatively low magnification (>250X) and are usually on the order of 30-100 μm in length.
Fatigue loading has been shown to affect the mechanical properties of bone. Fatigue loading causes decreases in both bone stiffness, and residual strength (Carter and Hayes, 1977; Hoshaw et al., 1997; Pattin et al., 1996; Schaffler et al., 1989). Not surprisingly, fatigue loading of bone also produces microdamage (Burr et al., 1985; Mori and Burr, 1993; Schaffler et al., 1989) and microdamage has been directly associated with modulus degradation (Burr et al., 1998a), and a decrease in fracture toughness (Norman et al., 1998).
Damage has been shown to stimulate bone remodeling (Bentolila et al., 1998; Burr, 2002; Cardoso et al., 2009; Hsieh and Silva, 2002; Martin, 2002). Microcracks associated with resorption spaces were observed 44 times greater than expected by chance alone (Burr et al., 1985). An increase in remodeling events occurs after the generation of microdamage, suggesting that cracks do not localize at sites of pre-existing resorption spaces. Rather, resorption spaces are formed in response to microdamage (Mori and Burr, 1993). Bentolila et al. (Bentolila et al., 1998) found that bone remodeling was associated with both microcracks while more recent work by this same group indicates that bone does not remodel in response to diffuse microdamage (Herman et al., 2010). This suggests a cause and effect relationship between linear microcracks and repair.
The quantification of microdamage in bone has become an important tool in understanding bone behavior. The generally accepted microdamage detection procedure is to bulk stain bone in vitro using a dye penetration technique (e.g. basic fuchsin hydrochloride) where the dye is allowed to diffuse into the bone material and binds non-specifically to open bone surfaces (Burr and Hooser, 1995; Burr et al., 1998b). Thus, well-defined microcracks are clearly detectable as regions of concentrated staining using both brightfield and epifluorescent optical microscopy techniques. In addition to well-defined microcracks, less well-defined regions of bone damage, referred to as diffusely stained areas, are also detectable. These regions are often related to ultrastructural matrix damage, hypothesized to reflect a collagen/hydroxyapatite structure that is disrupted (Schaffler and Jepsen, 2000). However, these techniques are tedious and time consuming, requiring serial sectioning and microscopic examination of stained bone specimens.
Furthermore, current technology does not allow the non-destructive and non-invasive detection of bone microdamage or other measures of bone quality including microporosity. Quantitative computed tomography (QCT) and Dual-Energy X-ray Absorptiometry (DEXA) can determine the volumetric density of trabecular or cortical bone at a skeletal site. Unfortunately, neither QCT nor DEXA can provide microstructural details due to resolution limitations. Most magnetic resonance imaging (MRI) techniques have been limited to the study of soft tissue or gross skeletal structure. Recently, MR images have been applied for characterization of bone marrow (Mulkern et al., 1994; Traber et al., 1996), and high resolution MR images that resolve trabecular bone structure have been obtained in vitro at high magnetic field strengths and in vivo using clinical scanners including studies of the correlation of trabecular bone structure with age, bone mineral density, and osteoporotic status (Handa et al., 2009; Krug et al., 2010; Li et al., 2008; Magland et al., 2009; Wald et al., 2010; Wehrli et al., 2008; Zhang et al., 2008). However, no current MRI technology can determine the microstructure of cortical bone due to limitations in resolution.
On the other hand, NMR proton spin-spin (T2) or spin-lattice (T1) relaxation time measurements and analytical processing techniques have been used to determine the porosity and pore size distribution in various types of porous media (Bowers et al., 1995; Gallegos et al., 1987; Glaves et al., 1988; Glaves and Smith, 1989; Kenyon, 1997; Smith et al., 1988). Recently, this technique has been used to nondestructively determine the porosity and pore size distribution in cortical bone (Ni et al., 2007; Ni et al., 2004) and apparent changes in porosity and pore size distribution due to the presence of induced microdamage (Ni and Nicolella, 2005). The advantage of the low-field NMR relaxation technique is that it can measure a wide range of pore sizes simultaneously, over a large range of pore sizes. In addition, this relaxation technique doesn't require pore-shape assumptions (Liaw et al., 1996) since the observed proton NMR relaxation signal is a convolution of the relaxations of the fluid in the various pores throughout the observed system; longer relaxation times correspond to larger pores and shorter relaxation times corresponding to smaller pores. Thus, regions within the bone matrix in which fluid may accumulate (e.g. a microcrack) can effectively be treated as a “pore” and will be manifest as a change in the relaxation signal. Deconvolution of the relaxation signal can provide quantitative information about the relaxation distributions of fluid in all pores, i.e., pore size distributions (Wang and Ni, 2003).
The objective of this investigation was to investigate changes in the low field pulsed NMR T2 relaxation time distribution due to mechanically induced microdamage in cortical bone. The results on the evolution of microdamage were verified by independent experimental measurements of pore size and density using histological characterization techniques. The size distribution and population of the microcracks were then utilized in conjunction of an analytical model to predict the degradation of elastic modulus of cortical bone as a function of damage accumulation. The model prediction was compared against experimental data to assess the predictive capability of the model.
MATERIALS AND METHODS
Cortical bone test specimens were machined from the diaphysis of human femurs. Specimen gage section dimensions were approximately 4 mm wide by 3 mm thick and 25 mm long and all samples were oriented along the long axis of the femur. Prior to fatigue loading, an initial NMR measurement (pre-damage) was performed that represented the undamaged state of the bone.
The NMR technique employed in this study was a spectroscopic technique rather than an imaging technique where an image is produced. The NMR measurement was performed on and the signals were acquired from the entire specimen. A custom-built 0.5–40 MHz broadline NMR system (Southwest Research Institute, San Antonio) was used in this study. This system has a 483 mm diameter electromagnet, and a 102 mm gap was set up for measurements at a proton frequency of about two MHz. The same proton field strength (2 MHz) was utilized previously in a number of investigations to measure the water content within porous materials (Kleinberg et al., 1993; Kenyon, 1997; Ni et al., 2004; Ni and Nicolella, 2005). A laboratory built 38 mm radio frequency (RF) coil was used to provide the RF field in the experiment. 1H spin–spin (T2) relaxation profiles were obtained at room temperature using the NMR Carr–Purcell–Meiboom–Gill (CPMG) (90°[–τ–180°––echo]n-delay) spin echo sequence with 4.2 μs at 90° pulse, 500 μs as τ, and 10 s for the sequence repetition time . For each T2 profile, 800 echoes (n = 800) were acquired and 40 scans were performed. All these test conditions were determined through preliminary tests to ensure the optimal NMR signal output. Details of the NMR techniques for determining bone porosity and relaxation time T2 profile from NMR signals are described in previous publications (Wang and Ni, 2003; Ni et al., 2004, 2007; Ni and Nicolella, 2005).
Specimens were then subjected to cyclic four-point bending under load control. The initial load was determined by applying a small diagnostic bending load to each specimen to determine the specimen stiffness. From this stiffness measurement, the bone elastic modulus and the load required to produce 5,000 microstrain in the outer specimen tensile fiber was determined using beam bending theory. Using a custom developed LabView data acquisition and control program, each specimen was cyclically loaded until a specified reduction in stiffness was achieved at which point the test was automatically stopped. All specimens were tested at 37°C in an environmentally controlled chamber under constant irrigation of phosphate buffered saline solution. After cyclic loading, a second NMR measurement was performed on the specimen (post-damage).
Following fatigue testing and post fatigue NMR measurement, each specimen was bulked stained in basic fuchsin in preparation of histological characterization using an established method (Burr and Hooser, 1995). Each specimen was then mounted in plastic and transverse sections were cut using a diamond saw and then ground and polished to approximately 80 microns thick. Five sections from the stressed region from each four-point bend specimen were prepared for the histological analysis. The sections were then imaged using an fluorescent optical microscope at magnifications of 50x and 200x. Standard stereological techniques were used to characterize specimen porosity from the two-dimensional sections using a NIH ImageJ. Porosity was further delineated into lacunar derived and Haversian canal derived porosity where lacunar derived porosity accounted for pore sizes in the range of osteocyte lacuna and was characterized using the 200X images and Haversian derived porosity accounted for pore sizes on the dimension of Haversian canals and was characterized using the 50X images. Five images for each specimen were obtained with the 200X magnification, in a vertical and evenly spaced fashion so that an even distribution between areas that were in compression and tension was maintained. A 3×2 matrix of images across the specimen was captured for the 50X images. Overall porosity and pore size distributions were determined for each specimen and these results were reported in an earlier publication (Wang and Ni, 2003).
Histological crack density was determined from the same images that were used for histological porosity determination. Both the number and length of linear microcracks were determined using established protocols (Boyce et al., 1998; Ni and Nicolella, 2005). Histological microcrack density was determined by approximating each linear microcrack as a penny-shaped crack with half-length a, and using an expression for the crack density parameter, χ, defined by (Budiansky and O'Connell, 1976)
| (1) |
where n is the number of microcracks, V is the total volume of the specimen, and a is the average crack half-length. The volume V was taken as the area of the image multiplied by the thickness of the section (80 microns). Five histological sections per specimen were used to approximate the volumetric crack density. According to Eq. (1), the crack density parameter is dimensionless and can be considered as the ratio of the crack volume (na3) to the total volume of the tissue (V)
The NMR-T2 relaxation time data were analyzed to extract the values of the crack density parameter defined by Eq. (1). The procedure utilized to compute the crack density parameter, χ, is illustrated in Figure 1, which shows of NMR amplitude as a function of the T2 relaxation time. For an arbitrary T2(J), the pore radius, r(j), is computed according to
| (2) |
where ρ (ρ = 0.25) and Q (Q = 6.41 or 4) are pore size constants previously determined from NMR measurements (Ni and Nicolella, 2005; Wang and Ni, 2003). The relative contribution of pores with radius r(j) to the total pore volume can be computed as the ratio of the area strip between T2(j+1) and T2(j) to the total area under the NMR curve in Figure 1 multiplied by the total pore volume, leading to
| (3) |
where Vpore(j) is the pore volume corresponding to T2(j): Vtotal is the total pore volume and Atotal is the total area under the NMR-T2 curve. The superscript i indicates quantities prior to damage when i = 0, and quantities after damage when i = 1. The change in pore volume resulting from damage is then given by
| (4) |
which is considered to be the volume of microcracks, Vmc, created due to damage. The volume of the micrckracs is given by
| (5) |
where δ is the average crack opening displacement and the average crack radius. Combining Eqs (1) and (5) leads one to
| (6) |
where ΔVpore(j) is obtained from NMR measurements via Eq. (4). For a semi-circular surface crack under elastic loading, the ratio, δ/a, of the crack opening displacement (δ) to the crack radius (a) is given by (Feng, 2001)
| (7) |
where σ is the local stress and E is Young's modulus. Eq. (7) leads one to
| (8) |
after it is substituted into Eq, (6). For a given T2(j), r(j) was first computed from the NMR data using Eq. (2). Once r(j) was obtained, the pore volume, , at T2(j) was computed on the basis of Eq. (3). Subsequently, ΔVpore(j) was computed via Eq. (4). Finally, the corresponding crack density χ(j) was computed via Eq. (8) using ν = 1/3 and σ/E = 6e-3 when ΔVpore(j) is positive. In contrast, χ(j) = 0 when ΔVpore(j) ≤ 0. If ΔVpore(j-1) is negative, the pores have grown fron r(j-1) to r(j) and the corresponding crack density χ(j) is computed via Eq. (8) using ΔVpore(j) = −ΔVpore(j-1).
Figure 1.
Use of NMR data for determining changes in pore volume due to damage and computing the crack density parameter.
The presence of microdamage in bone results in a reduction in the Young's modulus. According to a micromechanics model, the reduction in the Young's modulus due to the presence of uniformly distributed semi-circular microcracks is given by (Feng, 2001)
| (9) |
which is a nonlinear function of the crack density parameter. Eq. (9) was utilized to predict the reduction in the Young's modulus in bone with microdamage on the basis of the crack density parameter results derived from the NMR measurements.
RESULTS
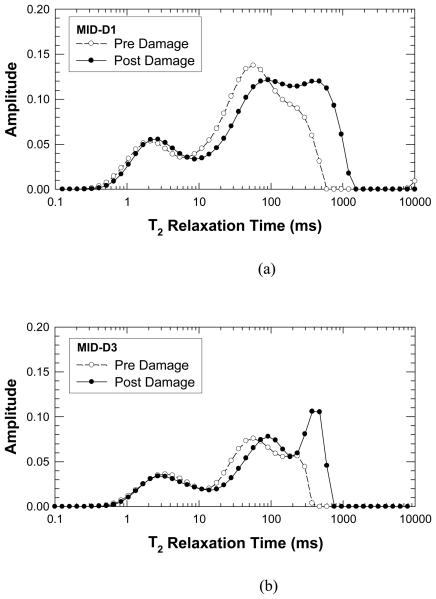
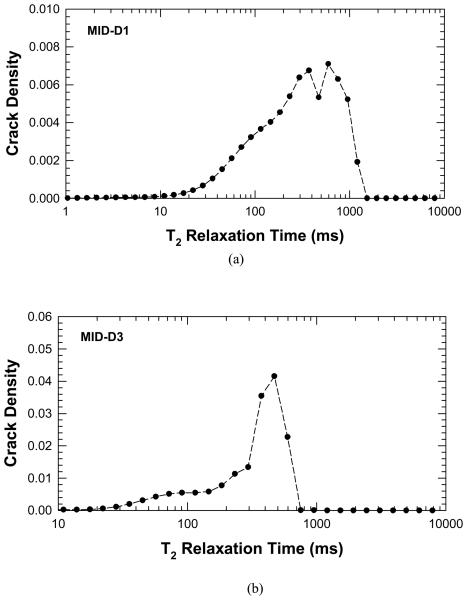
Figures 2(a) and (b) present NMR amplitudes at various T2 relaxation times before and after cyclic loading, respectively. A comparison of the pre-damage to post-damage inverted NMR T2 relaxation signal is consistent with our preliminary data. In all specimens tested, the NMR relaxation is significantly affected by the induced mechanical damage. The corresponding values of the crack density parameter were based on the differences between the NMR amplitudes for pre-damage and post-damage states. The results for MID-D1 and MID-D3 are shown as a function of T2 relaxation time in Figure 3(a) and (b), respectively. In Figure 2 in the 0.1 to 10 millisecond relaxation range, there is a shift of NMR amplitudes to longer average relaxation times indicating the creation of new voids or cracks whose volume is on the order of the size of pores in the lacunar-canalicular system. Alternatively, this increase in relaxation time may be attributed to cracks forming at lacunae that effectively increase the lacuna volume. Figure 3 indicates that the crack density parameter attains small values at about 10 ms.
Figure 2.
Comparisons of the T2 relaxation time profiles before and after deformation: (a) Specimen MID-D1, and (b) Specimen MID-D3. In both cases, double peaks occur in the profiles and the locations of the peak height shift toward to larger T2 relaxation time after deformation to increase the damage level in the cortical bone.
Figure 3.
Plots of crack density parameter, χ, derived from the NMR measurements of T2 relaxation time before and after deformation to induce damage in the cortical bone specimens : (a) crack density in MID-D1, and (2) crack density in MID-D3.
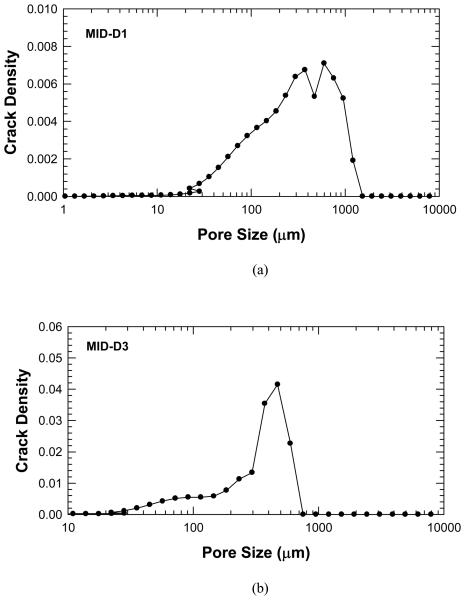
In the 10 to 1000 millisecond relaxation range in Figure 2, a similar shift occurs in which the individual peaks are shifted towards longer average relaxation times. Figure 3 shows that the crack density parameter increase with increasing T2 relaxation time and reaches a peak in the 300-500 ms range. The T2 relaxation is directly related to the pore size and the corresponding results for crack density versus pore size for MID-D1 and MID-D3 are presented in Figure 4(a) and (b), respectively. The results show that the crack density parameter peaks at around 300 – 500 μm pore size, indicating the formation of new internal voids and cracks that are about the same volume of Haversian canals or cracks that cause the Haversian canal volume to effectively increase. In addition, in some specimens an additional peak is present in the post-damage NMR data as compared to the pre-damage signal. This may be due to the creation of large microcracks whose overall volume is greater that the average Haversian canal.
Figure 4.
Plots of crack density parameter, χ, derived from the NMR data as a function of pore size: (a) Specimen MID-D1, and (b) Specimen MID-D3.
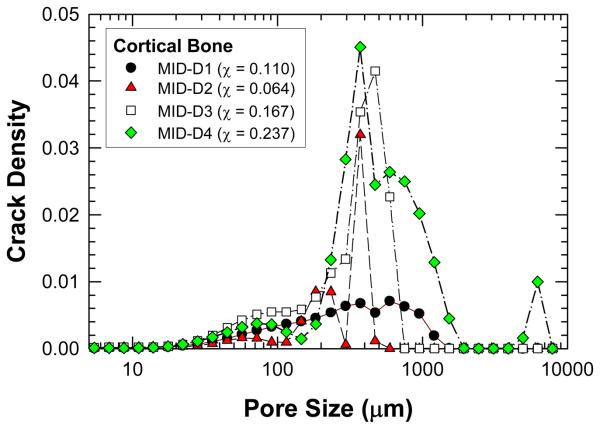
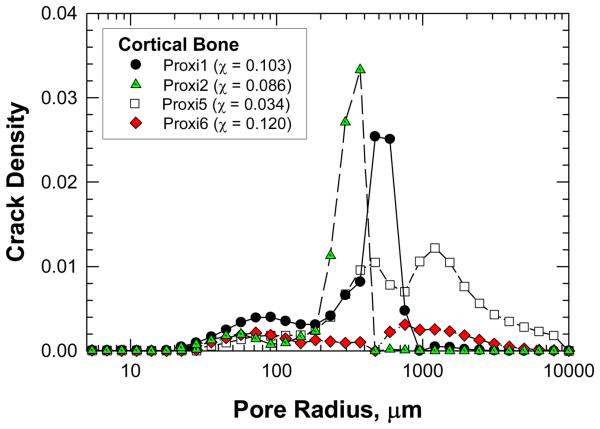
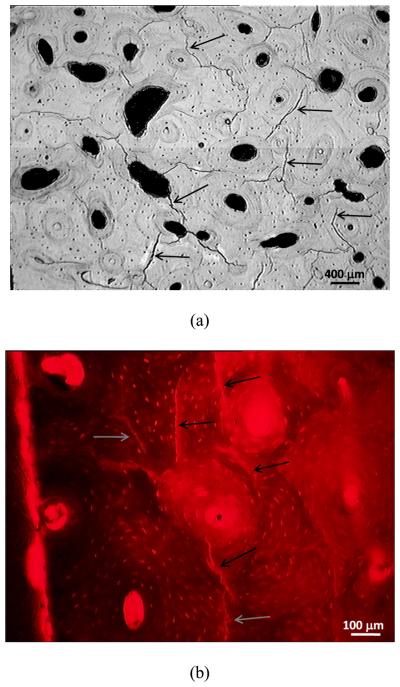
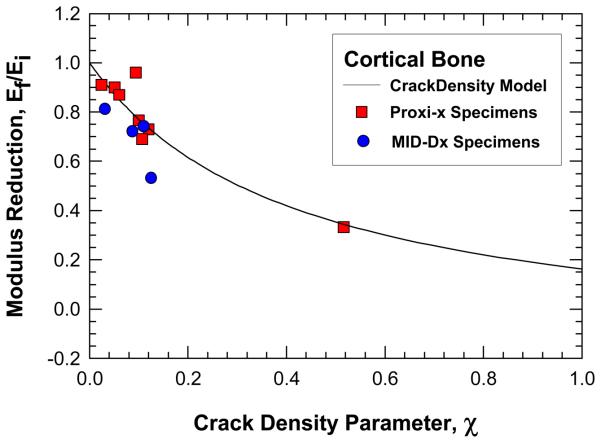
The crack density distributions in various specimens after cyclic damage are summarized in Figure 5 and 6 for MID and Proxi specimens, respectively. It is evident that different crack density distributions were introduced by cyclic loading at various strain levels. The total crack density, χ, in individual specimens was obtained as the integrated area under an individual crack density curve. The values of χ for individual specimens are presented in Figures 5 and 6 and in Table 1. Histological data of microcracks observed in the fatigued bone tissue are presented in Figure 7. Microcracks in an unstained specimen taken by fluorescent optical microscopy are shown in Figure 7(a) and microcracks in a stained specimen taken under fluorescent light are shown in Figure 7(b). Typically, the microcracks are formed along cement lines or within the interstitial tissue. All of the crack density measurements were performed on stained specimens only in order to exclude microcracks that could be induced during specimen preparation (Burr and Hooser, 1995). Using the crack density values (computed from the NMR data) and Eq. (9), the reduction of elastic modulus in damaged bone was predicted and the results are shown as fraction of initial elastic modulus of pre damage bone. A comparison of the measured and predicted degradation of elastic modulus in damaged bone is represented in Figure 8, which shows that the predicted modulus reduction increases nonlinearly with increasing crack density in accordance with experimental measurements. However, there is a scarcity of experimental data with a high crack density as only specimen exhibited a crack density greater than 13%. At low crack density (< 12%), modulus reduction increases almost linearly with increasing crack density.
Figure 5.
A comparison of crack density, χ, derived from the NMR data as a function of pore size for the MID specimens. The value of χ in parenthesis indicates the integrated value of the crack density parameter for the entire crack density distribution curve of the specimen.
Figure 6.
A comparison of crack density, χ, derived from the NMR data as a function of pore size for the Proxi specimens. The value of χ in parenthesis indicates the integrated value of the crack density parameter for the entire crack density distribution curve of the specimen.
Table 1.
Summary of measured and computed crack density and elastic modulus of damaged cortical bone
| Specimens | Crack Density,% | Exp. Crack Density, % | Calculated Ef/Ei |
Exp. Ef/Ei |
|---|---|---|---|---|
| (NMR data) | (Histology data) | (NMR data) | (Strain gauge data) | |
| Proxi1 | 10.3 | 10.7 | 0.76 | 0.69 |
| Proxi2 | 8.6 | 9.41 | 0.80 | 0.96 |
| Proxi3 | 3.4 | 5.10 | 0.91 | 0.90 |
| Proxi5 | 3.4 | 2.44 | 0.91 | 0.91 |
| Proxi6 | 12 | 6.04 | 0.73 | 0.87 |
| Proxi8 | 54.6 | 51.8 | 0.26 | 0.33 |
| MID-D1 | 11 | 8.81 | 0.75 | 0.72 |
| MID-D2 | 6.4 | 3.22 | 0.84 | 0.81 |
| MID-D3 | 16.7 | 11.1 | 0.66 | 0.74 |
| MID-D4 | 23.7 | 12.6 | 0.57 | 0.53 |
Figure 7.
Microcracks observed in bone tissue after fatigue: (a) optical microgragh showing microcracks formed along cement lines in an unstained specimen, and (b) microcracks in stained specimen observed under fluorescent light. Selected microcracks are indicated by arrows.
Figure 8.
Comparison of measured (histological data) and predicted values of modulus reduction as a function of crack density in cortical bone. Modulus prediction (solid line) was obtained using Eq. (9) and the values of the crack density parameter deduced from the NMR measurements.
DISCUSSION
The results of this investigation demonstrated that microdamage in the form of microcracks emanated from pores in cortical bone can be deduced from NMR measurements of the amplitude of the T2 relaxation time before and after damage is introduced. The biomechanical parameter that best characterize the microdamage appears to be the crack density parameter, χ, defined in Eq. (1) and introduced by (Budiansky and O'Connell, 1976). This crack density parameter is a scalar measure that is suitable for treating isotropic damage only. Elliptical cracks reported by O'Brien et al (2000) can only be treated approximately by using the average crack radius. For the microdamage level examined this article, the scalar measure is adequate for predicting the modulus reduction due to the presence of microcracks in the cortical bone. This finding suggests that the microcracks induced by the fatigue loading were probably fairly uniform in size and were either randomly distributed in all directions or along the three principal directions. Under these circumstances, the microdamge would appear to be isotropic and the modulus reduction would be correctly predicted by Eq. (9). Once the microcracks coalesce into a large crack along a particular direction or evolve into an elliptical shape (O'Brien et al, 2000), the modulus reduction predicted on the basis of the crack density parameter and Eq. (9) may overestimate, but the exact crack density where Eq, (9) holds and overestimation would occur could not be determined from the current set of cortical bone data because the level of microdamage was mostly less than 0.2 and modulus reduction was evaluated for the loading direction only. A critical test of the crack density model would require more data with microdamage levels in the 0.2 to 0.6 range and perform modulus reduction in multiple directions.
The major differences between the NMR determined crack density and the histomorphometrically derived crack density shown in Table 1 could be attributed to the following factors. The NMR result is based on the whole sample volume (including the undamaged portion) while the histomorphometric result is based on a small area from five thin cross sections of the specimen in the stressed and therefore damaged area of the four point bend specimen. The occurrence of damage or cracks in bone is non-homogeneous, and may not be adequately captured on each thin cross section, while the NMR technique will account for all the damage within the specimen no matter where it occurs.
In bone mechanics, microdamage in bone is frequently characterized in term of a continuum damage parameter, D, that is defined in terms of the reduction in Young's modulus. While the damage parameter D is fully characterized and defined in terms of the modulus ratio, its relationship with the number and size of microcracks is generally ill-defined. One of the significant findings of this paper is that the continuum damage parameter can be related to the crack density parameter through their influence on the modulus reduction. For example, D can be taken as the crack density parameter (D = χ) so that the dependence of modulus reduction by microdamage is described by Eq (9) by replaced χ with D. Besides providing a physical meaning for D, the crack density parameter allows the determination of microdamage from qualitative measurement techniques such as micro-CT when improvement in resolutions enables detection of micro-sized cracks in bone tissues. Under this circumstance, local crack density values can be evaluated and utilized to predict the reduction in elastic modulus and perhaps in bone strength.
CONCLUSIONS
The conclusions reached in this investigation are as follows:
The procedure developed for extracting crack density parameter from NMR data before and after fatigue loading was successfully implemented to deduce crack density levels in cortical bone specimens induced by fatigue.
The crack density level in cortical bone varied among specimens and ranged from 2.4 % to 51%.
The modulus reduction induced by microdamage ranges from 67% to 9%, corresponding to crack density of 51% and 2.4%, respectively.
Reduction of Young's modulus by microdamage is predicted to depend on crack density through a nonlinear relationship, in agreement with experimental observations.
Acknowledgements
The authors acknowledge Mr. Don Moravits and Mr. Forrest Campbell for their technical assistance in specimen preparation and cyclic fatigue loading. NIH/NIAMS AR049627 and the SwRI Advisory Committee for Research funded this study.
Footnotes
Publisher's Disclaimer: This is a PDF file of an unedited manuscript that has been accepted for publication. As a service to our customers we are providing this early version of the manuscript. The manuscript will undergo copyediting, typesetting, and review of the resulting proof before it is published in its final citable form. Please note that during the production process errorsmaybe discovered which could affect the content, and all legal disclaimers that apply to the journal pertain.
Literature Cited
- Bentolila V, Boyce TM, Fyhrie DP, Drumb R, Skerry TM, Schaffler MB. Intracortical remodeling in adult rat long bones after fatigue loading. Bone. 1998;23:275–281. doi: 10.1016/s8756-3282(98)00104-5. [DOI] [PubMed] [Google Scholar]
- Bowers MC, Ehrlich R, Howard JJ, Kenyon WE. Determination of porosity types from NMR data and their relationship to porosity types derived from thin section. Journal of Petroleum Science and Engineering. 1995;13:1–14. [Google Scholar]
- Budiansky B, O'Connell RJ. Elastic moduli of a cracked solid. International Journal of Solids and Structures. 1976;12:81–97. [Google Scholar]
- Burr DB. Targeted and nontargeted remodeling. Bone. 2002;30:2–4. doi: 10.1016/s8756-3282(01)00619-6. [DOI] [PubMed] [Google Scholar]
- Burr DB, Forwood MR, Fyhrie DP, Martin RB, Schaffler MB, Turner CH. Bone microdamage and skeletal fragility in osteoporotic and stress fractures. J.Bone Miner.Res. 1997;12:6–15. doi: 10.1359/jbmr.1997.12.1.6. [DOI] [PubMed] [Google Scholar]
- Burr DB, Hooser M. Alterations to the en bloc basic fuchsin staining protocol for the demonstration of microdamage produced in vivo. Bone. 1995;17:431–433. doi: 10.1016/s8756-3282(95)00241-3. [DOI] [PubMed] [Google Scholar]
- Burr DB, Martin RB, Schaffler MB, Radin EL. Bone remodeling in response to in vivo fatigue microdamage. Journal of Biomechanics. 1985;18:189–200. doi: 10.1016/0021-9290(85)90204-0. [DOI] [PubMed] [Google Scholar]
- Burr DB, Turner CH, Naick P, Forwood MR, Ambrosius W, Hasan MS, Pidaparti R. Does microdamage accumulation affect the mechanical properties of bone? Journal of Biomechanics. 1998a;31:337–345. doi: 10.1016/s0021-9290(98)00016-5. [DOI] [PubMed] [Google Scholar]
- Burr DB, Turner CH, Naick P, Forwood MR, Pidaparti R. En bloc staining of bone under load does not improve dye diffusion into microcracks. Journal of Biomechanics. 1998b;31:285–288. doi: 10.1016/s0021-9290(98)00007-4. [DOI] [PubMed] [Google Scholar]
- Cardoso L, Herman BC, Verborgt O, Laudier D, Majeska RJ, Schaffler MB. Osteocyte apoptosis controls activation of intracortical resorption in response to bone fatigue. J Bone Miner Res. 2009;24:597–605. doi: 10.1359/JBMR.081210. [DOI] [PMC free article] [PubMed] [Google Scholar]
- Carter DR, Hayes WC. Compact bone fatigue damage--I. Residual strength and stiffness. Journal of Biomechanics. 1977;10:325–337. doi: 10.1016/0021-9290(77)90005-7. [DOI] [PubMed] [Google Scholar]
- Feng XQ. On estimation methods for effective moduli of microcracked solids. Archive of Applied Mechanics. 2001;71:537–548. [Google Scholar]
- Frost HM. Precense of microscopic cracks in-vivo in bone. Henry Ford Medical Bulletin. 1960;8:27–35. [Google Scholar]
- Gallegos DP, Munn K, Smith DM, Stermer DL. A NMR technique for the analysis of pore structure: Application to materials with well-defined pore structure. Journal of Colloid And Interface Science. 1987;119:127–140. [Google Scholar]
- Glaves CL, Davis PJ, Gallegos DP, Smith DM. Pore structure analysis of coals via low-field spin-lattice relaxation measurements. Energy & Fuels. 1988;2:662–668. [Google Scholar]
- Glaves CL, Smith DM. Membrane pore structure analysis via NMR spin-lattice relaxation experiments. Journal of Membrane Science. 1989;46:167–184. [Google Scholar]
- Handa S, Tomiha S, Kose K, Haishi T. In vivo assessment of the trabecular bone microstructure of the distal radius using a compact MRI system. Magnetic resonance in medical sciences : MRMS : an official journal of Japan Society of Magnetic Resonance in Medicine. 2009;8:39–42. doi: 10.2463/mrms.8.39. [DOI] [PubMed] [Google Scholar]
- Herman BC, Cardoso L, Majeska RJ, Jepsen KJ, Schaffler MB. Activation of bone remodeling after fatigue: Differential response to linear microcracks and diffuse damage. Bone. 2010 doi: 10.1016/j.bone.2010.07.006. [DOI] [PMC free article] [PubMed] [Google Scholar]
- Hoshaw SJ, Cody DD, Saad AM, Fyhrie DP. Decrease in canine proximal femoral ultimate strength and stiffness due to fatigue damage. Journal of Biomechanics. 1997;30:323–329. doi: 10.1016/s0021-9290(96)00159-5. [DOI] [PubMed] [Google Scholar]
- Hsieh YF, Silva MJ. In vivo fatigue loading of the rat ulna induces both bone formation and resorption and leads to time-related changes in bone mechanical properties and density. J Orthop Res. 2002;20:764–771. doi: 10.1016/S0736-0266(01)00161-9. [DOI] [PubMed] [Google Scholar]
- Kenyon WE. Petrophysical principles of applications of NMR logging. Log Analyst. 1997;38:21–40. [Google Scholar]
- Krug R, Burghardt AJ, Majumdar S, Link TM. High-Resolution Imaging Techniques for the Assessment of Osteoporosis. Radiologic Clinics of North America. 2010;48:601–621. doi: 10.1016/j.rcl.2010.02.015. [DOI] [PMC free article] [PubMed] [Google Scholar]
- Li CQ, Magland JF, Rajapakse CS, Guo XE, Zhang XH, Vasilic B, Wehrli FW. Implications of resolution and noise for in vivo micro-MRI of trabecular bone. Medical Physics. 2008;35:5584–5594. doi: 10.1118/1.3005598. [DOI] [PMC free article] [PubMed] [Google Scholar]
- Liaw HK, Kulkarni R, Chen S, Watson AT. Characterization of fluid distributions in porous media by NMR techniques. AIChE Journal. 1996;42:538–546. [Google Scholar]
- Magland JF, Wald MJ, Wehrli FW. Spin-echo micro-MRI of trabecular bone using improved 3D fast large-angle spin-echo (FLASE) Magnetic Resonance in Medicine. 2009;61:1114–1121. doi: 10.1002/mrm.21905. [DOI] [PMC free article] [PubMed] [Google Scholar]
- Martin RB. Is all cortical bone remodeling initiated by microdamage? Bone. 2002;30:8–13. doi: 10.1016/s8756-3282(01)00620-2. [DOI] [PubMed] [Google Scholar]
- Mori S, Burr DB. Increased intracortical remodelling following fatigue damage. Bone. 1993;14:103–109. doi: 10.1016/8756-3282(93)90235-3. [DOI] [PubMed] [Google Scholar]
- Mulkern RV, Meng J, Oshio K, Guttmann CR, Jaramillo D. Bone marrow characterization in the lumbar spine with inner volume spectroscopic CPMG imaging studies. J Magn Reson Imaging. 1994;4:585–589. doi: 10.1002/jmri.1880040412. [DOI] [PubMed] [Google Scholar]
- Ni Q, Nyman JS, Wang X, De Los Santos A, Nicolella DP. Assessment of water distribution changes in human cortical bone by nuclear magnetic resonance. Measurement Science & Technology. 2007;18:715–723. [Google Scholar]
- Ni QW, King JD, Wang XD. The characterization of human compact bone structure changes by low-field nuclear magnetic resonance. Measurement Science & Technology. 2004;15:58–66. [Google Scholar]
- Ni QW, Nicolella DP. The characterization of human cortical bone microdamage by nuclear magnetic resonance. Measurement Science & Technology. 2005;16:659–668. [Google Scholar]
- Norman TL, Wang Z. Microdamage of human cortical bone: incidence and morphology in long bones. Bone. 1997;20:375–379. doi: 10.1016/s8756-3282(97)00004-5. [DOI] [PubMed] [Google Scholar]
- Norman TL, Yeni YN, Brown CU, Wang Z. Influence of microdamage on fracture toughness of the human femur and tibia. Bone. 1998;23:303–306. doi: 10.1016/s8756-3282(98)00103-3. [DOI] [PubMed] [Google Scholar]
- Pattin CA, Caler WE, Carter DR. Cyclic mechanical property degradation during fatigue loading of cortical bone. Journal of Biomechanics. 1996;29:69–79. doi: 10.1016/0021-9290(94)00156-1. [DOI] [PubMed] [Google Scholar]
- Schaffler MB, Jepsen KJ. Fatigue and repair in bone. International Journal of Fatigue. 2000;22:839–846. [Google Scholar]
- Schaffler MB, Radin EL, Burr DB. Mechanical and morphological effects of strain rate on fatigue of compact bone. Bone. 1989;10:207–214. doi: 10.1016/8756-3282(89)90055-0. [DOI] [PubMed] [Google Scholar]
- Smith DM, Glaves CL, Gallegos DP. Pore structure characterization of catalyst supports via low field NMR. Preprints Symposia. 1988;33:618–622. [Google Scholar]
- Traber F, Block W, Layer G, Braucker G, Gieseke J, Kretzer S, Hasan I, Schild HH. Determination of 1H relaxation times of water in human bone marrow by fat-suppressed turbo spin echo in comparison to MR spectroscopic methods. J Magn Reson Imaging. 1996;6:541–548. doi: 10.1002/jmri.1880060318. [DOI] [PubMed] [Google Scholar]
- Wald MJ, Magland JF, Rajapakse CS, Wehrli FW. Structural and mechanical parameters of trabecular bone estimated from in vivo high-resolution magnetic resonance images at 3 Tesla field strength. Journal of Magnetic Resonance Imaging. 2010;31:1157–1168. doi: 10.1002/jmri.22158. [DOI] [PMC free article] [PubMed] [Google Scholar]
- Wang X, Ni Q. Determination of cortical bone porosity and pore size distribution using a low field pulsed NMR approach. Journal of orthopaedic research : official publication of the Orthopaedic Research Society. 2003;21:312–319. doi: 10.1016/S0736-0266(02)00157-2. [DOI] [PubMed] [Google Scholar]
- Wehrli FW, Ladinsky GA, Jones C, Benito M, Magland J, Vasilic B, Popescu AM, Zemel B, Cucchiara AJ, Wright AC, Song HK, Sana PK, Peachey H, Snyder PJ. In vivo magnetic resonance detects rapid remodeling changes in the topology of the trabecular bone network after menopause and the protective effect of estradiol. Journal of Bone and Mineral Research. 2008;23:730–740. doi: 10.1359/JBMR.080108. [DOI] [PMC free article] [PubMed] [Google Scholar]
- Zhang XH, Liu XS, Vasilic B, Wehrli FW, Benito M, Rajapakse CS, Snyder PJ, Guo XE. In vivo Œ°MRI-based finite element and morphological analyses of tibial trabecular bone in eugonadal and hypogonadal men before and after testosterone treatment. Journal of Bone and Mineral Research. 2008;23:1426–1434. doi: 10.1359/JBMR.080405. [DOI] [PMC free article] [PubMed] [Google Scholar]


