

Abstract
Human natural regulatory T cells (nTregs) show great promise for therapeutically modulating immune-mediated disease, but remain poorly understood. One explanation under intense scrutiny is how to induce suppressive function in non-nTregs and increase the size of the regulatory population. A second possibility would be to make existing nTregs more effective, like a catalyst raises the specific activity of an enzyme. The latter has been difficult to investigate due to the lack of a robust short-term suppression assay. Using a microassay described herein we demonstrate that nTregs in distinct phases of cell cycle progression exhibit graded degrees of potency. Moreover, we show that physiological concentrations of 1α,25-dihydroxyvitamin D3 (vitamin D3) boosts nTregs function. The enhanced suppressive capacity is likely due to vitamin D3's ability to uniquely modulate cell cycle progression and elevate FOXP3 expression. These data suggest a role for vitamin D3 as a mechanism for catalyzing potency of nTregs.
Keywords: regulatory T cells, FOXP3, vitamin D3, immune regulation, immunotherapy, tolerance
1. Introduction
Immune-mediated disease causes substantial morbidity and mortality. Therapeutic modalities to reign in auto-aggressive immune reactions are limited and compromise a patient's ability to respond to life-threatening infections. Studies to understand the immune system's own rheostat mechanism for preventing autoimmunity, i.e. natural regulatory T cells (nTregs), have shown promising efficacy in numerous animal models of disease. Many investigations have focused on the process of “infectious tolerance” or how non-regulatory T cells acquire suppressive function. Fewer investigations regarding mechanisms to augment or “catalyze” regulatory activity from existing nTregs have been reported and parallel studies using human nTregs have been particularly limited [1].Given the challenges associated with obtaining therapeutic quantities of nTregs, elucidation of mechanisms which enhance suppressive potency may provide insight to develop immunotherapies which achieve clinical efficacy with fewer cells.
To investigate the mechanisms controlling the potency of human nTregs, we first considered how to best demonstrate superior function when comparing samples from a heterogeneous group of individuals. Since most experiments do not yield sufficient primary nTregs for elegant in vivo models using immunocompromised mice [2; 3; 4], most studies have been relegated to in vitro proliferation assays. However, proliferation assays can be cumbersome and are not always suitable for smaller amounts of peripheral blood. Another caveat is that standard proliferation assays most commonly used to show suppressive function (generally inhibition of CFSE dilution or 3H-thymidine incorporation) take days to complete, thereby obscuring early molecular events. Thus, we developed a short-term suppression assay (6 hours) requiring yet fewer nTregs. Importantly this assay is amenable to a wide titration of nTregs, allowing an objective measure of nTregs quality. Using this assay, we demonstrate graded degrees of activity for primary human nTregs in specific phases of cell cycle progression, directly linking this process with functional capacity. The ability to modulate cell cycle progression and known immunomodulatory properties prompted us to evaluate vitamin D3 as a physiologically important candidate for modulating nTregs function [5; 6; 7; 8]. Utilizing the criteria described above, enhanced suppression across titrated doses of nTregs, we show that vitamin D3 significantly augments suppressive activity. Moreover, vitamin D3 likely mediates its effects through modulation of cell cycle progression and increased FOXP3 expression. These data support the notion that increasing the quality of regulatory function may be a promising strategy in settings where large quantities of therapeutic nTregs are not available.
2. Materials and Methods
2.1 Peripheral Blood Samples
Peripheral blood was obtained from either healthy platelet donors at St. Jude Children's Research Hospital Blood Donor Center with permission from the Institutional Review Board (IRB) or purchased from Lifeblood Biological Services (Memphis, TN). Peripheral blood was obtained from a severely ill child diagnosed with IPEX at St. Jude Children's Research Hospital with permission from the Institutional Review Board (IRB) and parental consent.
2.2 Purification of CD4+CD25- and CD4+CD25+ T lymphocytes
CD4+CD25- and CD4+CD25+ populations were isolated using an AutoMACS® cell sorter following manufacturer's instructions (CD4+CD25+ Regulatory T Cell Isolation Kit, Miltenyi Biotec Inc., Auburn, CA). Purities (>95%) were assessed by flow cytometry.
2.3 Cell culture
CD4+CD25+ Tregs in culture medium (X-Vivo supplemented with 2mM L-glutamine, 15% Human Serum, and 10U/ml recombinant human IL2) were activated with anti-CD2/CD3/CD28 antibody-coated beads (MACS® T Cell Activation/Expansion Kit – Miltenyi Biotec Inc.) following manufacturer's conditions for the indicated times. Vitamin D3 was added at 20nM where indicated.
2.4 Suppression microassay
10,000 CD4+CD25- T cells were activated as described above in the presence or absence of nTregs for 6 hours, unless otherwise indicated. Control conditions included nTregs cell cultures and CD4+CD25- T cell cultures alone.
2.5 nTregs identification by labeling with fluorescent probes
Isolated nTregs were labeled with 1μM CMRA Cell Tracker™ (Molecular Probes, Invitrogen, CA) using serum-free media. Cells were incubated for 45 minutes at 37°C, followed by two washes using serum-free media prior to resuspension in culture media.
2.6 Propidium Iodide staining
Cell samples were washed once with PBS followed by labeling with Propidium Iodide solution (Propidium Iodide, sodium citrate and Triton X-100, Sigma, St. Louis, MO). Samples were treated with RNAse (Calbiochem, USA) for 30 minutes at room temperature prior to analysis.
2.7 Hoescht 33342
Cells were labeled with 10μM Hoescht 33342 in media containing human serum (Sigma, St. Louis, MO) for 40 minutes at 37°C, followed by two washes using PBS/2% human serum. Hoescht 33342 was added at a final concentration of 1μM to avoid efflux of the dye.
2.8 mRNA analysis
Total RNA was extracted using the QIAGEN RNeasy® Micro Kit (QIAGEN, Valencia, CA) and reverse transcribed using the TaqMan® Reverse Transcription Kit (Applied Biosystems, Foster City, CA). Human IL2 mRNA was tested using ABL1 as the endogenous control. nTregs mRNA was used as a calibrator sample and mRNA from CD4+CD25- T cells as a positive control. Human VDR and FOXP3 mRNA were tested using the TaqMan® Gene Expression Assays. Gene Assays: IL2: Hs00174114_m1, ABL1: Hs00245445_m1, FOXP3: Hs00203958_m1, VDR: Hs00172113_m1.
2.9 Confocal Microscopy Analysis
nTregs were activated as described above in the presence or absence of 20nM vitamin D3 in 35mm Poly-d-lysine dishes with 10mm coverslips for five days. Cells were fixed with 1.5% paraformaldehyde (PFA) and permeabilized with 0.3% Triton X-100 followed by anti- FOXP3 Alexa 488 (clone 259D – BioLegend, San Diego, CA) staining. ProLong® Gold anti fade reagent with DAPI was used as mounting solution prior to study. Analysis was performed using Nikon C1Si confocal/ TE2000 microscope and NIS Elements software (Nikon Inc., Melville, NY).
2.10 Flow cytometry
Cellular surface markers were assessed by flow cytometry using the following antibodies: anti-CD4 APC (clone SK3, Becton Dickinson, CA) anti-CD25 PE (clone 4E3, Miltenyi Biotec); anti-CD127 FITC (clone hIL-7R-M21, Becton Dickinson). Samples were run on a FACS Calibur using Cell Quest software (BD Biosciences) and analyzed using FlowJo 8.8.2 software (Ashland, OR).
2.11 Intracellular Staining
Cells were fixed in 1.5% PFA and permeabilized with cold 100% methanol prior to staining (clone 259D BioLegend, San Diego, CA; clone PCH101 eBioscience, San Diego, CA; and the isotype controls recommended by the respective manufacturers). FOXP3 protein in nTregs from the patient with IPEX was detected using the anti-human FOXP3 Flow kit (BioLegend); Alexa-Fluor 488 anti-FOXP3 (clone 259D), Alexa-Fluor 488 mouse IgG1 k isotype control and anti-human CD4-PE-Cy5/CD25-PE cocktail (clones RPA-T4/BC96) as per manufacturer's instructions. Plots show the comparison between the anti-FOXP3 staining or respective IgG antibody isotype control using FlowJo 8.8.2 software.
2.12 Protein analysis by Western Blot
Cell extracts were lysed and fractionated (cytoplasmic and nuclear extracts) using the NE-PER® Nuclear and Cytoplasmic Extraction Reagents (Thermo Scientific, Rockford, IL) as per manufacturer's conditions. Quantitation was done using the BCA™ Protein Assay Kit (Thermo Scientific). 10μg of protein was loaded per lane, separated by SDS-PAGE and transferred to an Immobilon™ PVDF Transfer Membrane (Millipore, Bedford, MA), followed by overnight blocking. Primary antibodies were incubated for 2 hours at RT, followed by several washes and incubation with secondary antibodies for 1 hour at RT. Membranes were developed using the SuperSignal® West Pico Chemiluminescent Substrate as per manufacturer's instructions (Thermo Scientific). FOXP3 detection: clone H190 rabbit polyclonal IgG (Santa Cruz Biotechnology, Inc., Santa Cruz, CA).
2.13 Analysis and statistics
Where possible, samples were set up in triplicate and each respective cDNA was analyzed for IL2 in triplicate. Standard deviations (SD) were determined by paired t test using GraphPad Prism software (San Diego, CA). If culture samples were set up in duplicate followed by analyzing the cDNA for IL2 content in triplicate, standard errors (SE) were determined by Excel software (Henderson, NV).
3. Results
Initial attempts from our laboratory to identify physiological parameters, which catalyze human nTregs activity, suggested that control of cell cycle progression may be linked to suppressive potency (Riberdy et al., manuscript in preparation). However, to more carefully explore the relationship between regulatory potency and cell cycle progression, an assay meeting several criteria was needed. First, to interpret events that occur during a given round of division it was critical to reduce the assay duration from days (as required for standard proliferation assays) to one completed within hours. Secondly, a functional assay sufficiently robust to measure suppression across a heterogeneous range of responses, yet adequate to detect those approaching the lower end of the spectrum was important. Thirdly, since human nTregs investigations are hampered by the limited availability of cells, particularly in clinical studies of various immune-mediated diseases, suppression assays necessitating fewer cells would be highly desirable. The crucial role of IL2 production and features such as rapid mRNA up-regulation [9; 10], combined with sensitive methods for detection, suggested that such a readout would be superior to the standard proliferation assay [9; 11; 12; 13; 14]. Figure 1A illustrates the dynamic spectrum of IL2 mRNA signal from isolated CD4+CD25- T cells at various times after activation, with 7 0f 9 samples peaking between 6 and 12 hours after activation before declining. Since the priority was to develop a short-term assay, subsequent experiments were done using a 6 hour activation period. Of note, we have empirically observed that despite the 6-12 hour range for peak IL2 mRNA production among individuals, the majority of CD4+CD25- T cells tested at 6 hours post-activation yielded sufficient signal to reliably assess suppression (Fig. 1B and data not shown). Similarly prioritizing the need to reduce the number of cells in a short-term suppression assay, titrated doses of CD4+CD25- T cells from different individuals identified 10,000 cells as the minimum number of cells most reliably yielding signal above the negative controls (negative control CT values ranged 35-40; Fig. 1B and data not shown). It is interesting to note that a minority of samples remain below the limits of detection at the highest dose of cells, perhaps reflecting the lower end of the IL2 response range or the donors' health status (Fig. 1B).
Figure 1. Cell cycle progression modulates nTregs function.
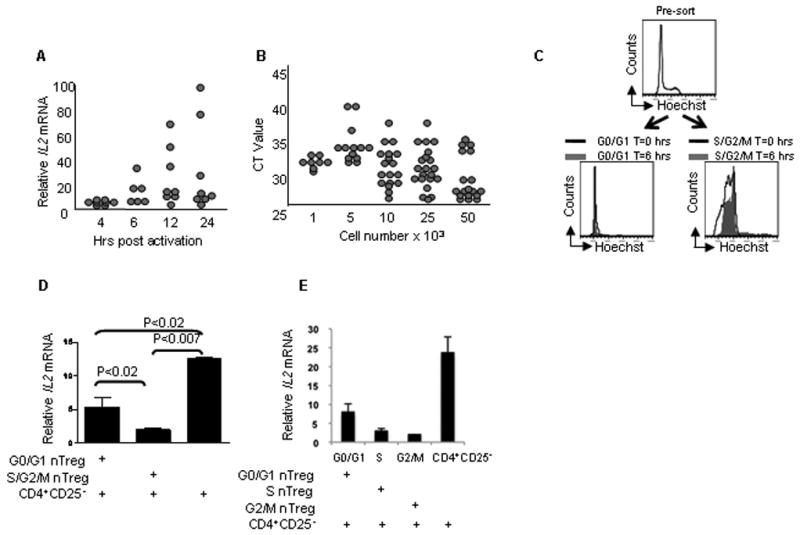
(A) Optimal time for IL2 mRNA detection was determined by activating 10,000 CD4+CD25- T cells in vitro for the indicated times, followed by qRT-PCR analysis for cytokine [n=9]. (B) The minimum number of cells for reliable IL2 mRNA detection was determined by assaying titrated doses of in vitro activated CD4+CD25- T cells for cytokine via qRT-PCR [1k n=8, 5k n=12, 10k n=18, 25k n=21, 50k n=18]. (C) nTregs were activated in vitro for 5 days, labeled with Hoescht 33342, sorted into the indicated fractions and assayed for DNA content at time 0 and 6 hrs under suppression assay conditions. This is representative of 2 experiments. (D) 10,000 nTregs in the indicated cell cycle phases were sorted and incubated with 10,000 CD4+CD25- T cells under the described suppression microassay conditions for 6hrs prior to IL2 mRNA analysis. Error bars represent SD and this is representative of 3 experiments. (E) Purified nTregs were activated and fractionated as in 1d, prior to assaying for suppressive activity. Error bars represent SE and this is representative of 4 experiments.
Having reduced the time for a CD4+CD25- T cell functional readout assay from days to 6 hours, we were poised to investigate whether cell cycle progression was linked to nTregs potency. However, three technical issues needed to be addressed. First, since an exclusive marker for human nTregs is lacking, we purified anergic cells expressing a CD4+CD25brightCD127loFOXP3+ phenotype (Supplemental Figure 1 and data not shown). These characteristics comprise a broad consensus phenotype for human nTregs, at least until a definitive lineage specification marker is elucidated [15; 16] Secondly, conventional cell cycle analysis evaluates DNA content by propidium iodide staining of fixed cells [17], precluding functional analysis of specific subsets. Thirdly, although nTregs show evidence of rapid proliferation in vivo [18; 19], freshly isolated cells are largely anergic unless provided additional signals [20; 21; 22; 23]. To circumvent the latter two hurdles, primary human nTregs were activated and labeled for DNA content with Hoechst 33342. Five days of activation was the shortest activation period where sufficient numbers of cells were found in the S and G2/M phases (Supplemental Figure 2). Next, viable nTregs in indicated phases of cell cycle progression were sorted by flow cytometry and immediately assayed for regulatory function. As an additional control, DNA content of the sorted cells was evaluated at time 0 and 6 hours to verify that the nTregs remained within the desired phases for the duration of the assay (Fig. 1C). Surprisingly, nTregs in either S/G2/M combined, or S and G2/M fractionated, exhibited significantly more potent suppressor activity than those in the G0/G1 pool, further substantiating the notion that cell cycle progression is directly linked to nTregs potency (Fig. 1D and 1E).
If modulating cell cycle progression is a physiologically relevant mechanism for controlling nTregs function, then one would predict that important biological molecules participate in this process. Since vitamin D3 has been shown to alter cell cycle progression [24] and is emerging as a key immunomodulator [8; 25; 26], we investigated whether this molecule could potentiate nTregs function. Figure 2A shows that nTregs activated in the presence of physiological concentrations of vitamin D3 are significantly more effective at suppression than mock treated nTregs. Importantly, this enhancement is maintained when a fixed number of nTregs interacts with an increasing number of CD4+CD25- T cells, providing an objective demonstration of amplified potency. We were curious whether vitamin D-mediated enhancement of suppressor function could also be observed at the level of IL2 protein production. However, the differing turnover time for IL2 mRNA versus IL2 protein makes directly adapting the above mRNA suppression assay to intracellular cytokine staining challenging and additional kinetic studies will be required for optimization. Albeit modest, an increase in suppression of IL2 protein production was observed when vitamin D3-treated nTreg were assayed, suggesting that regulatory activity can be detected at both the protein and mRNA levels (Fig. 2B). Heightened function is not due to carry over of vitamin D3 acting on the responding cells themselves, as addition of vitamin D3 directly to CD4+CD25- T cells does not diminish the level of detectable IL2 mRNA or protein (Supplemental Figure 2). All nTregss populations we have tested thus far have exhibited increased regulatory activity when exposed to vitamin D3, but the kinetics of this boost varies among individuals (data not shown). This heterogeneity likely reflects genetic modifiers, placing the delineation of a precise time course beyond the scope of this study. Thus, to investigate whether the timing of vitamin D3 exposure was important in a more generalized manner, the potency of nTregs receiving a single dose either at the beginning or end of T cell receptor (TCR) stimulation was compared to those receiving a continually replenished supply. Figure 2C shows graded degrees of suppression among the groups, with those getting vitamin D3 throughout the activation program being most effective.
Figure 2. Vitamin D3 modulates human nTregs potency at both the mRNA and protein levels.
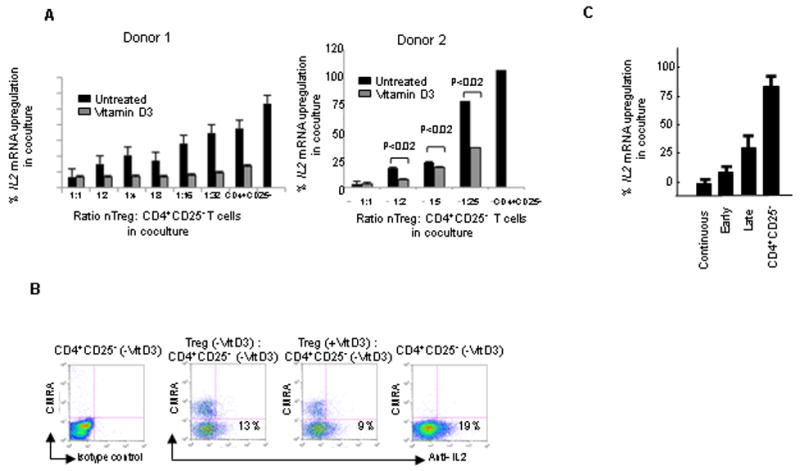
(A) nTregs were either mock treated or treated with vitamin D3 for 5 days as described in Methods, assayed for suppressive potency with 10,000 CD4+CD25- T cells at the indicated ratios, and analyzed for IL2 mRNA. Data represents 2 of 7 experiments. Sufficient nTregs were available from Donor 2 to set up each condition in triplicate, while the yield of nTregs from Donor 1 only permitted a single well for each condition. Error bars in the panel from Donor 2 represent SD. (B) Mock treated or vitamin D3 treated nTregs were assayed for the ability to inhibit IL2 protein production by CD4+CD25- T cells. nTregs were labeled with CMRA Cell Tracker™ to distinguish them from the CD4+CD25- T cells, mock treated or vitamin D3 treated, and assayed for suppressive function with the following changes to the microassay. 10,000 CD4+CD25- T cells were incubated with an equivalent number of nTregs under the described microassay conditions for 10 hrs. Brefeldin A was added during the last 5 hrs to inhibit cytokine secretion prior to intracellular IL2 staining. (C) Exposure to vitamin D3 at different stages of nTregs activation differentially alters potency. 20nM vitamin D3 was added to the nTregs activation cultures at 0hrs (Early); 96 hrs (Late); or 0, 48, and 96 hrs (Continuous). nTregs were assayed for suppressive function during the described 6hr suppression microassay (n=5 for the different nTregs groups).
To better understand the molecular mechanism by which vitamin D3 acts on nTregs, we examined the effects of TCR stimulation on vitamin D receptor (VDR) expression. Purified nTregs were activated ex vivo, either in the presence or absence of vitamin D3 and assayed at the indicated times for VDR mRNA. Expression of VDR peaks around 12 hours after activation, remains partially elevated for at least 14 days, and is not differentially regulated in the presence of ligand (Fig. 3A and data not shown). Thus, the profile of VDR regulation in nTregs is similar to that described for conventional T cells (i.e. VDR increases upon TCR stimulation in a ligand-independent fashion) [27; 28].
Figure 3. Vitamin D3 treatment modulates cell cycle progression.
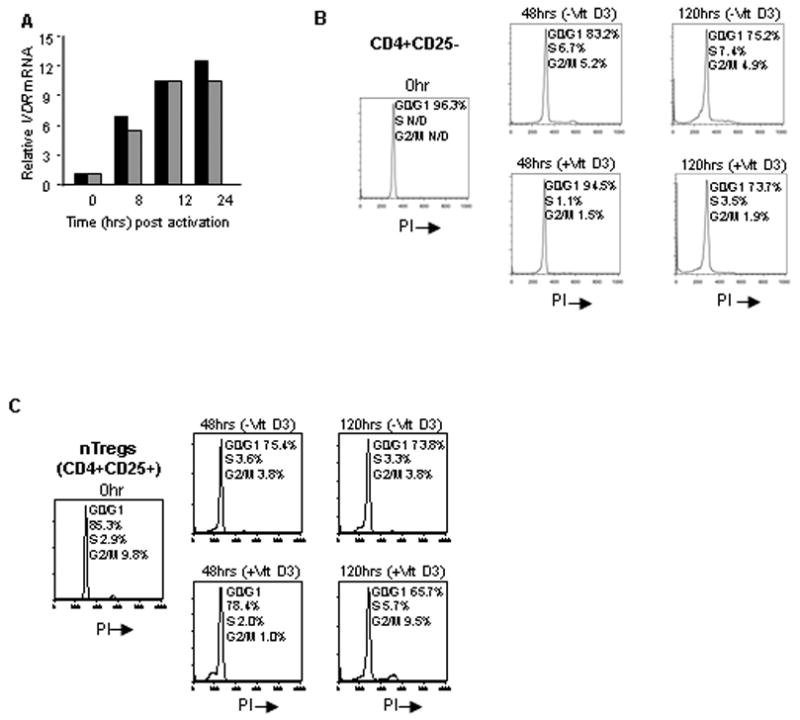
(A) Freshly isolated nTregs were activated for the indicated times in the presence or absence of vitamin D3 and assayed for VDR mRNA by qRT-PCR analysis (n=5). (B) CD4+CD25- T cells were activated in the presence or absence of vitamin D3 and labeled with propidium iodide for DNA content for the indicated time points. (C) nTregs were activated for 5 days and labeled for DNA content on days 0, 2, 5 (n=6).
It has been reported for multiple cell types that vitamin D3 blocks the transition from G0/G1 to S [29; 30]. Consistent with such a block, vitamin D3 treated CD4+CD25- T cells exhibited fewer cells in the S and G2/M phases at both 48 and 120 hours, compared to mock treated cells (Fig. 3B). At 48 hours, nTregs similarly showed decreased numbers of cells in S and G2/M phases. However, the percentage of cells in S or G2/M phases unexpectedly increased in the vitamin D3 treated nTregs after 120 hours (approximately 3- and 10-fold, respectively), suggesting a release or less stringent block in cell cycle progression at this time (Fig. 3C). Next, we determined whether this pattern was unique to a specific individual or reflective of a more generalized trend, by performing a similar time course of cell cycle analysis on nTregs from 6 additional donors. To normalize for variations among different individuals, we combined the percentage of cells in S with those in G2/M as an overall measurement of “proliferating” cells within the total population (referred to as S/G2/M). Table 1 illustrates that after 120 hours of activation in the presence of vitamin D3, 5 of 6 individuals increase the number of cells in S/G2/M, indicating that nTregs exhibit a late release from the G0/G1 block.
Table 1. Percentage of mock and vitamin D3 treated nTregs in S/G2/M 120 hours after activation.a.
| Mock S/G2/M | Vitamin D3 S/G2/M | |
|---|---|---|
| Donor 1 | 3.7% | 5.6% |
| Donor 2 | 1.9% | 7.2% |
| Donor 3 | 2.7% | 1.8% |
| Donor 4 | 7.8% | 9.5% |
| Donor 5 | 7.0% | 5.9% |
| Donor 6 | 2.2% | 5.2% |
Freshly isolated nTregs were mock treated or vitamin D3 treated during 5-day activation as previously described. The percentage of cells in the indicated stages of cell cycle progression was determined after propidium iodide labeling.
FOXP3 is critical for nTregs function [31; 32; 33; 34; 35; 36] and in silico studies suggested that the promoter for this gene has two potential VDR binding elements (Riberdy, unpublished). Hypothesizing that vitamin D3 may be mediating its activity through FOXP3, mRNA levels of FOXP3 were examined at various time points after TCR stimulation where vitamin D3 was added at the onset of activation. As expected, FOXP3 mRNA levels increased after activation, but addition of vitamin D3 did not show differential regulation (Fig. 4A). To examine FOXP3 levels more carefully, we looked at protein levels by intracellular flow cytometry using multiple antibodies to avoid epitope-specific variations. The number of FOXP3+ cells increased when vitamin D3 was supplied during the 5-day activation, irrespective of the antibody used (Fig. 4B, Table 2, and data not shown). Table 2 illustrates that the number of FOXP3 expressing cells increases (n=5) and the mean fluorescence intensity per cell is typically elevated as well (4 of 5 individual samples). Using a second method, confocal microscopy, we demonstrated that exposure to vitamin D3 resulted in increased FOXP3 expression both at the single cell and population levels (Fig. 4C, D, and E). Employing a third method, western blot, and probing with a polyclonal rabbit antisera against FOXP3, we confirmed that protein levels were increased in vitamin D3 treated nTregs (Fig. 4F). A parallel study following the immune reconstitution of a patient with immune dysregulation, polyendocrinopathy, enteropathy, X-linked syndrome (IPEX) after hematopoietic stem cell transplantation provided a unique opportunity to examine the effect of vitamin D3 on the regulation of FOXP3 containing a point mutation in the forkhead domain. Prior to transplantation, nTregs from this patient poorly expressed FOXP3 (Kasow et al., manuscript in preparation). Vitamin D3 treatment during ex vivo activation showed a three-fold increase in FOXP3+ cells compared to control stimulation (Fig. 4G). Taken together, these data demonstrate that vitamin D3 modulates FOXP3 protein expression in human nTregs.
Figure 4. FOXP3 protein expression is augmented upon Vitamin D3 treatment.
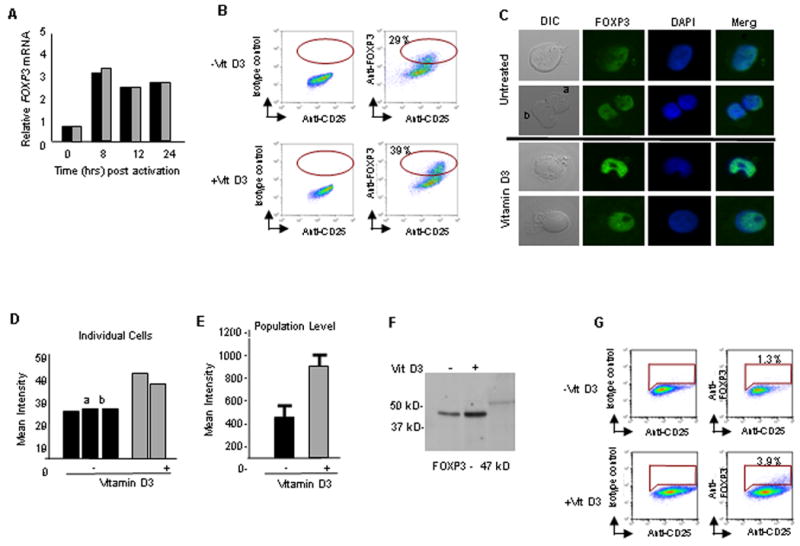
(A) Freshly isolated nTregs were activated and assayed for FOXP3 mRNA by qRT-PCR analysis (n=5). (B) Freshly isolated nTregs were activated for 5 days as previously described in text. Gating strategy: CD4+ T cells (99%) were selected and analyzed for CD25 vs. FOXP3. IgG isotype controls and unlabelled cells were used to define gates. The percentage of CD4+ T cells expressing both CD25 and FOXP3 as depicted by the oval gate, are indicated. (C-E) Confocal microscopy analysis of nTregs. (C) Activated cells were fixed and permeabilized, followed by anti-FOXP3 staining. Controls included unlabeled cells and isotype controls (data not shown). Anti-fade reagent with DAPI was used as mounting solution and nuclear marker. Mean intensity of anti-FOXP3 was analyzed both at the single cell (D) and population (E) levels (representing 1 of 3 experiments) using NIS Elements Software. (F) Western blot analysis for FOXP3 expression using 10 mg of protein per lane as described in Methods. (G) nTregs purified from a patient with IPEX were either mock treated or vitamin D3 treated during ex vivo activation and stained for FOXP3 expression. Gating strategy: CD4+ T cells (99%) were selected and analyzed for CD25 vs. FOXP3. IgG isotype controls and unlabeled cells were used to define gates. The percentage of CD4+ T cells expressing both CD25 and FOXP3, as depicted by the gate are indicated.
Table 2. FOXP3 expression in mock and vitamin D3 treated nTregs during activation.b.
| Vitamin D3 | %CD4+CD25+FOXP3+ | MFI FOXP3 | |
|---|---|---|---|
| Donor 1 | - | 29 | 195 |
| + | 38.6 | 304 | |
| Donor 2 | - | 29.5 | 28 |
| + | 48 | 35 | |
| Donor 3 | - | 75.9 | 7.5 |
| + | 83.7 | 8 | |
| Donor 4 | - | 19.7 | 19 |
| + | 35.9 | 12.3 | |
| Donor 5 | - | 25.8 | 170 |
| + | 38.6 | 295 |
Freshly isolated nTregs were activated for 5 days in the presence or absence of vitamin D3 followed by flow cytometry analysis of FOXP3 expression. The same gating strategy described in Figure 4 was used.
4. Discussion
It is clear from many studies that any single readout does not reflect the breadth of T lymphocyte function (i.e. all tetramer binding cells do not necessarily produce identical cytokine profiles or exhibit cytotoxicity) [37]. Similarly, solely assessing the ability of human nTregs to inhibit proliferation is not likely to reflect the full arsenal of capabilities ascribed to these cells. Broadening our ability to monitor nTregs by developing assays which survey additional functions will be critical to illuminate how this population functions at the molecular level. Moreover, the heterogeneity of human lymphocyte responses increases the likelihood that even among healthy donors, there will occasionally be weak responses below the limits of detection, as we show in Figure 1B. This caveat is particularly relevant in clinical samples where cell number is limited and responses are likely to be muted due to disease or therapy. These considerations highlight the urgent need to expand methodology, and improve sensitivity. The development of additional assays is also important for elucidating early vs. late molecular events during the orchestration of the suppressive program. For example, the short-term nature of the IL2 mRNA suppression assay described in this work was critical for the cell cycle progression studies, which could not have been done using a proliferation-based method. Additionally, the vitamin D3-mediated enhancement of nTregs potency would have been missed without a 6-hour assay. It is tempting to speculate that because an immune response grows exponentially, a small enhancement of IL2 suppression during the first 6 hours will likely result in a large impact on the overall magnitude.
Initial attempts to examine the effect of vitamin D3 using proliferation assays were inconclusive and prompted us to examine whether augmented potency may be transient. Indeed altering the dosing of vitamin D3 during nTregs activation suggests that this molecule make act temporally (Figure 2C). It is intriguing to consider that the transient effect of vitamin D3 may provide an additional fine-tune adjustment such that autoimmunity is ablated in one anatomical locale, yet at another site the body remains poised to respond to pathogens. It has been suggested that vitamin D3 can facilitate the recruitment of induced-Tregs into the modulation process [8; 38], while our data demonstrates a novel role for this molecule, augmenting function from existing nTregs. Such a scenario would support the concept that vitamin D3 rapidly acts on nearby nTregs to blunt immune genesis. However, in physical environments requiring a larger number of regulatory T cells such as the gut, induced-Tregs could be enrolled to assist.
Given the lack of a single cell suppression assay, it remains unknown whether all the nTregs subjected to in vitro analysis actually participate in the modulatory process or whether only a subpopulation mediates the bulk of activity. This is perhaps most relevant in the cell cycle studies. Given the observation that nTregs in S or G2/M are more potent, it is reasonable to speculate that the increase in S/G2/M cells after vitamin D3 exposure results in the enhanced suppressive function. To test this directly and compare treated vs. non-treated nTregs in S/G2/M, additional methods requiring even fewer cells need to be developed because sufficient cells cannot readily be obtained from peripheral blood. Nonetheless, it is important to point out the hypothetical scenario described above does not necessarily imply that the nTregs in S/G2/M are the subset most efficient at mediating other suppressive functions such as inhibiting proliferation, modulating dendritic cell function, or arresting cytotoxicity. Rather, it is likely that population of cells characterized by a CD4+CD25brightCD127loFOXP3+ phenotype will be further partitioned into functional subsets, perhaps by markers such as CD45RA or HLA-DR, which are already known to correlate with specific functional capabilities [39; 40].
The ability of vitamin D3 to enhance nTregs function, possibly via increasing FOXP3, emphasizes the need to consider both quality and quantity when considering the dynamics of immunomodulation. This issue is highlighted by the demonstration that vitamin D3 increases the number of nTregs expressing FOXP3, as well as the amount of protein per cell (Figure 4 and Table 2). However, it is unclear whether the nTregs expressing the most FOXP3 are actually more potent. Additional studies are necessary to elucidate how quantity (amount of FOXP3) and quality (perhaps as a post-translational modification) relate to suppressive function. The unique regulation of FOXP3 in human T cells poses additional constraints on interpretation of quality and quantity. For example, FOXP3 is restricted to murine T cells with regulatory function while all human T lymphocytes transiently express FOXP3 upon TCR stimulation, without necessarily acquiring suppressive function [41]. Thus, simple enumeration studies using FOXP3 alone may not reflect bona fide nTregs. An additional qualitative point is demonstrated by ectopic expression of FOXP3 in CD4+CD25- T cells to induce regulatory function. In these studies ectopic expression of FOXP3 in murine CD4+CD25- T cells is sufficient to induce potent regulatory function [4; 31; 42], while similar experiments with human T lymphocytes have resulted in only modest levels of activity [32; 43; 44; 45]. However, potent suppressive activity can be obtained if high levels of ectopic FOXP3 are sustained for several days, perhaps reflecting a requirement for epigenetic changes [46]. The need for epigenetic alterations is further supported by the observation that bona fide regulatory cells fully demethylate a CpG island in the promoter of FOXP3. In contrast, those exhibiting a partial demethylation status show only transient expression and lack functional activity [47; 48; 49].
The ability to overcome the cell cycle block mediated by vitamin D3 is reminiscent of the observation that nTregs selectively expand in the presence of rapamycin, an anti-proliferative agent known to inhibit the activity of the mammalian target of rapamycin (mTOR) [50; 51]. Histone deacetylases (HDAC) are key molecules in regulating cell cycle progression not only by virtue of their activity on histones and therefore control of transcription, but also on transcription factors themselves. Interestingly, HDAC inhibitors increase acetylation of FOXP3 itself and this modification is associated with enhanced nTregs function [52]. The combined observations that nTregs potency is enhanced by vitamin D3, rapamycin, and HDAC inhibitors, strongly suggest that cell cycle progression is uniquely regulated in nTregs. Understanding the molecular events controlling cell cycle progression in human nTregs may reveal novel targets for enhancing their function and will be critical for translating these observations into strategies which harness the full therapeutic potential of this elusive population.
Supplementary Material
Acknowledgments
The authors would like to thank Laura McLaughlin, Laura Spaulding, Victoria Fabry and Jaime Beine, for technical assistance in developing methods, which could be applied to this study. We also thank Jim Houston and Drs. Anne Marie Hamilton-Easton and Richard Ashmun for invaluable assistance with flow cytometry, Jennifer Peters and Sam Connell for confocal microscopy, and the St. Jude Blood Donor Center for help in obtaining samples. This work was supported by the Assisi Foundation of Memphis, Program of Oncology Training Grant NCI 5R25CA023944, Cancer Center Support Grant 2P30CA021765 and the American Lebanese and Syrian Associated Charities (ALSAC).
Abbreviations
- nTregs
natural regulatory T cells
- vitamin D3
1α,25-dihydroxyvitamin D3
- PFA
1.5% paraformaldehyde
- TCR
T cell receptor
- VDR
vitamin D receptor
- IPEX
immune dysregulation, polyendocrinopathy, enteropathy, X-linked syndrome
- mTOR
mammalian target of rapamycin
- HDAC
Histone deacetylases
Footnotes
Publisher's Disclaimer: This is a PDF file of an unedited manuscript that has been accepted for publication. As a service to our customers we are providing this early version of the manuscript. The manuscript will undergo copyediting, typesetting, and review of the resulting proof before it is published in its final citable form. Please note that during the production process errors may be discovered which could affect the content, and all legal disclaimers that apply to the journal pertain.
References
- 1.Riley JL, June CH, Blazar BR. Human T regulatory cell therapy: take a billion or so and call me in the morning. Immunity. 2009;30:656–65. doi: 10.1016/j.immuni.2009.04.006. [DOI] [PMC free article] [PubMed] [Google Scholar]
- 2.Powrie F, Leach MW, Mauze S, Caddle LB, Coffman RL. Phenotypically distinct subsets of CD4+ T cells induce or protect from chronic intestinal inflammation in C. B-17 scid mice. Int Immunol. 1993;5:1461–71. doi: 10.1093/intimm/5.11.1461. [DOI] [PubMed] [Google Scholar]
- 3.Mutis T, van Rijn RS, Simonetti ER, Aarts-Riemens T, Emmelot ME, van Bloois L, Martens A, Verdonck LF, Ebeling SB. Human regulatory T cells control xenogeneic graft-versus-host disease induced by autologous T cells in RAG2-/-gammac-/- immunodeficient mice. Clin Cancer Res. 2006;12:5520–5. doi: 10.1158/1078-0432.CCR-06-0035. [DOI] [PubMed] [Google Scholar]
- 4.Hori S, Nomura T, Sakaguchi S. Control of regulatory T cell development by the transcription factor Foxp3. Science. 2003;299:1057–61. doi: 10.1126/science.1079490. [DOI] [PubMed] [Google Scholar]
- 5.Adams JS, Hewison M. Unexpected actions of vitamin D: new perspectives on the regulation of innate and adaptive immunity. Nat Clin Pract Endocrinol Metab. 2008;4:80–90. doi: 10.1038/ncpendmet0716. [DOI] [PMC free article] [PubMed] [Google Scholar]
- 6.Bhalla AK, Amento EP, Clemens TL, Holick MF, Krane SM. Specific high-affinity receptors for 1,25-dihydroxyvitamin D3 in human peripheral blood mononuclear cells: presence in monocytes and induction in T lymphocytes following activation. J Clin Endocrinol Metab. 1983;57:1308–10. doi: 10.1210/jcem-57-6-1308. [DOI] [PubMed] [Google Scholar]
- 7.Rigby WF, Denome S, Fanger MW. Regulation of lymphokine production and human T lymphocyte activation by 1,25-dihydroxyvitamin D3. Specific inhibition at the level of messenger RNA. J Clin Invest. 1987;79:1659–64. doi: 10.1172/JCI113004. [DOI] [PMC free article] [PubMed] [Google Scholar]
- 8.Boonstra A, Barrat FJ, Crain C, Heath VL, Savelkoul HF, O'Garra A. 1alpha,25-Dihydroxyvitamin d3 has a direct effect on naive CD4(+) T cells to enhance the development of Th2 cells. J Immunol. 2001;167:4974–80. doi: 10.4049/jimmunol.167.9.4974. [DOI] [PubMed] [Google Scholar]
- 9.Oberle N, Eberhardt N, Falk CS, Krammer PH, Suri-Payer E. Rapid suppression of cytokine transcription in human CD4+CD25 T cells by CD4+Foxp3+ regulatory T cells: independence of IL-2 consumption, TGF-beta, and various inhibitors of TCR signaling. J Immunol. 2007;179:3578–87. doi: 10.4049/jimmunol.179.6.3578. [DOI] [PubMed] [Google Scholar]
- 10.Shaw J, Meerovitch K, Bleackley RC, Paetkau V. Mechanisms regulating the level of IL-2 mRNA in T lymphocytes. J Immunol. 1988;140:2243–8. [PubMed] [Google Scholar]
- 11.Levings MK, Sangregorio R, Roncarolo MG. Human cd25(+)cd4(+) t regulatory cells suppress naive and memory T cell proliferation and can be expanded in vitro without loss of function. J Exp Med. 2001;193:1295–302. doi: 10.1084/jem.193.11.1295. [DOI] [PMC free article] [PubMed] [Google Scholar]
- 12.Kruisbeek AM, Shevach E, Thornton AM. Proliferative assays for T cell function. Curr Protoc Immunol. 2004;Chapter 3(Unit 3 12) doi: 10.1002/0471142735.im0312s60. [DOI] [PubMed] [Google Scholar]
- 13.Thornton AM, Donovan EE, Piccirillo CA, Shevach EM. Cutting edge: IL-2 is critically required for the in vitro activation of CD4+CD25+ T cell suppressor function. J Immunol. 2004;172:6519–23. doi: 10.4049/jimmunol.172.11.6519. [DOI] [PubMed] [Google Scholar]
- 14.Thornton AM, Shevach EM. CD4+CD25+ immunoregulatory T cells suppress polyclonal T cell activation in vitro by inhibiting interleukin 2 production. J Exp Med. 1998;188:287–96. doi: 10.1084/jem.188.2.287. [DOI] [PMC free article] [PubMed] [Google Scholar]
- 15.Liu W, Putnam AL, Xu-Yu Z, Szot GL, Lee MR, Zhu S, Gottlieb PA, Kapranov P, Gingeras TR, Fazekas de St Groth B, Clayberger C, Soper DM, Ziegler SF, Bluestone JA. CD127 expression inversely correlates with FoxP3 and suppressive function of human CD4+ T reg cells. J Exp Med. 2006;203:1701–11. doi: 10.1084/jem.20060772. [DOI] [PMC free article] [PubMed] [Google Scholar]
- 16.Seddiki N, Santner-Nanan B, Martinson J, Zaunders J, Sasson S, Landay A, Solomon M, Selby W, Alexander SI, Nanan R, Kelleher A, Fazekas de St Groth B. Expression of interleukin (IL)-2 and IL-7 receptors discriminates between human regulatory and activated T cells. J Exp Med. 2006;203:1693–700. doi: 10.1084/jem.20060468. [DOI] [PMC free article] [PubMed] [Google Scholar]
- 17.Krishan A. Rapid flow cytofluorometric analysis of mammalian cell cycle by propidium iodide staining. J Cell Biol. 1975;66:188–93. doi: 10.1083/jcb.66.1.188. [DOI] [PMC free article] [PubMed] [Google Scholar]
- 18.Gavin MA, Clarke SR, Negrou E, Gallegos A, Rudensky A. Homeostasis and anergy of CD4(+)CD25(+) suppressor T cells in vivo. Nat Immunol. 2002;3:33–41. doi: 10.1038/ni743. [DOI] [PubMed] [Google Scholar]
- 19.Vukmanovic-Stejic M, Zhang Y, Cook JE, Fletcher JM, McQuaid A, Masters JE, Rustin MH, Taams LS, Beverley PC, Macallan DC, Akbar AN. Human CD4+ CD25hi Foxp3+ regulatory T cells are derived by rapid turnover of memory populations in vivo. J Clin Invest. 2006;116:2423–33. doi: 10.1172/JCI28941. [DOI] [PMC free article] [PubMed] [Google Scholar]
- 20.Itoh M, Takahashi T, Sakaguchi N, Kuniyasu Y, Shimizu J, Otsuka F, Sakaguchi S. Thymus and autoimmunity: production of CD25+CD4+ naturally anergic and suppressive T cells as a key function of the thymus in maintaining immunologic self-tolerance. J Immunol. 1999;162:5317–26. [PubMed] [Google Scholar]
- 21.Walker LS, Chodos A, Eggena M, Dooms H, Abbas AK. Antigen-dependent proliferation of CD4+ CD25+ regulatory T cells in vivo. J Exp Med. 2003;198:249–58. doi: 10.1084/jem.20030315. [DOI] [PMC free article] [PubMed] [Google Scholar]
- 22.Klein L, Khazaie K, von Boehmer H. In vivo dynamics of antigen-specific regulatory T cells not predicted from behavior in vitro. Proc Natl Acad Sci U S A. 2003;100:8886–91. doi: 10.1073/pnas.1533365100. [DOI] [PMC free article] [PubMed] [Google Scholar]
- 23.Kuniyasu Y, Takahashi T, Itoh M, Shimizu J, Toda G, Sakaguchi S. Naturally anergic and suppressive CD25(+)CD4(+) T cells as a functionally and phenotypically distinct immunoregulatory T cell subpopulation. Int Immunol. 2000;12:1145–55. doi: 10.1093/intimm/12.8.1145. [DOI] [PubMed] [Google Scholar]
- 24.Banerjee P, Chatterjee M. Antiproliferative role of vitamin D and its analogs--a brief overview. Mol Cell Biochem. 2003;253:247–54. doi: 10.1023/a:1026072118217. [DOI] [PubMed] [Google Scholar]
- 25.Liu PT, Stenger S, Li H, Wenzel L, Tan BH, Krutzik SR, Ochoa MT, Schauber J, Wu K, Meinken C, Kamen DL, Wagner M, Bals R, Steinmeyer A, Zugel U, Gallo RL, Eisenberg D, Hewison M, Hollis BW, Adams JS, Bloom BR, Modlin RL. Toll-like receptor triggering of a vitamin D-mediated human antimicrobial response. Science. 2006;311:1770–3. doi: 10.1126/science.1123933. [DOI] [PubMed] [Google Scholar]
- 26.Rosenblatt J, Bissonnette A, Ahmad R, Wu Z, Vasir B, Stevenson K, Zarwan C, Keefe W, Glotzbecker B, Mills H, Joyce R, Levine JD, Tzachanis D, Boussiotis V, Kufe D, Avigan D. Immunomodulatory effects of vitamin D: implications for GVHD. Bone Marrow Transplant. doi: 10.1038/bmt.2009.366. [DOI] [PMC free article] [PubMed] [Google Scholar]
- 27.Deluca HF, Cantorna MT. Vitamin D: its role and uses in immunology. FASEB J. 2001;15:2579–85. doi: 10.1096/fj.01-0433rev. [DOI] [PubMed] [Google Scholar]
- 28.Veldman CM, Cantorna MT, DeLuca HF. Expression of 1,25-dihydroxyvitamin D(3) receptor in the immune system. Arch Biochem Biophys. 2000;374:334–8. doi: 10.1006/abbi.1999.1605. [DOI] [PubMed] [Google Scholar]
- 29.Johnson CS, Muindi JR, Hershberger PA, Trump DL. The antitumor efficacy of calcitriol: preclinical studies. Anticancer Res. 2006;26:2543–9. [PubMed] [Google Scholar]
- 30.Trump DL, Hershberger PA, Bernardi RJ, Ahmed S, Muindi J, Fakih M, Yu WD, Johnson CS. Anti-tumor activity of calcitriol: pre-clinical and clinical studies. J Steroid Biochem Mol Biol. 2004;89-90:519–26. doi: 10.1016/j.jsbmb.2004.03.068. [DOI] [PubMed] [Google Scholar]
- 31.Fontenot JD, Gavin MA, Rudensky AY. Foxp3 programs the development and function of CD4+CD25+ regulatory T cells. Nat Immunol. 2003;4:330–6. doi: 10.1038/ni904. [DOI] [PubMed] [Google Scholar]
- 32.Yagi H, Nomura T, Nakamura K, Yamazaki S, Kitawaki T, Hori S, Maeda M, Onodera M, Uchiyama T, Fujii S, Sakaguchi S. Crucial role of FOXP3 in the development and function of human CD25+CD4+ regulatory T cells. Int Immunol. 2004;16:1643–56. doi: 10.1093/intimm/dxh165. [DOI] [PubMed] [Google Scholar]
- 33.Brunkow ME, Jeffery EW, Hjerrild KA, Paeper B, Clark LB, Yasayko SA, Wilkinson JE, Galas D, Ziegler SF, Ramsdell F. Disruption of a new forkhead/winged-helix protein, scurfin, results in the fatal lymphoproliferative disorder of the scurfy mouse. Nat Genet. 2001;27:68–73. doi: 10.1038/83784. [DOI] [PubMed] [Google Scholar]
- 34.Bennett CL, Christie J, Ramsdell F, Brunkow ME, Ferguson PJ, Whitesell L, Kelly TE, Saulsbury FT, Chance PF, Ochs HD. The immune dysregulation, polyendocrinopathy, enteropathy, X-linked syndrome (IPEX) is caused by mutations of FOXP3. Nat Genet. 2001;27:20–1. doi: 10.1038/83713. [DOI] [PubMed] [Google Scholar]
- 35.Schubert LA, Jeffery E, Zhang Y, Ramsdell F, Ziegler SF. Scurfin (FOXP3) acts as a repressor of transcription and regulates T cell activation. J Biol Chem. 2001;276:37672–9. doi: 10.1074/jbc.M104521200. [DOI] [PubMed] [Google Scholar]
- 36.Walker MR, Kasprowicz DJ, Gersuk VH, Benard A, Van Landeghen M, Buckner JH, Ziegler SF. Induction of FoxP3 and acquisition of T regulatory activity by stimulated human CD4+CD25- T cells. J Clin Invest. 2003;112:1437–43. doi: 10.1172/JCI19441. [DOI] [PMC free article] [PubMed] [Google Scholar]
- 37.Snyder JE, Bowers WJ, Livingstone AM, Lee FE, Federoff HJ, Mosmann TR. Measuring the frequency of mouse and human cytotoxic T cells by the Lysispot assay: independent regulation of cytokine secretion and short-term killing. Nat Med. 2003;9:231–5. doi: 10.1038/nm821. [DOI] [PubMed] [Google Scholar]
- 38.Urry Z, Xystrakis E, Richards DF, McDonald J, Sattar Z, Cousins DJ, Corrigan CJ, Hickman E, Brown Z, Hawrylowicz CM. Ligation of TLR9 induced on human IL-10-secreting Tregs by 1alpha,25-dihydroxyvitamin D3 abrogates regulatory function. J Clin Invest. 2009;119:387–98. doi: 10.1172/JCI32354. [DOI] [PMC free article] [PubMed] [Google Scholar]
- 39.Baecher-Allan C, Wolf E, Hafler DA. MHC class II expression identifies functionally distinct human regulatory T cells. J Immunol. 2006;176:4622–31. doi: 10.4049/jimmunol.176.8.4622. [DOI] [PubMed] [Google Scholar]
- 40.Hoffmann P, Eder R, Boeld TJ, Doser K, Piseshka B, Andreesen R, Edinger M. Only the CD45RA+ subpopulation of CD4+CD25high T cells gives rise to homogeneous regulatory T-cell lines upon in vitro expansion. Blood. 2006;108:4260–7. doi: 10.1182/blood-2006-06-027409. [DOI] [PubMed] [Google Scholar]
- 41.Allan SE, Crome SQ, Crellin NK, Passerini L, Steiner TS, Bacchetta R, Roncarolo MG, Levings MK. Activation-induced FOXP3 in human T effector cells does not suppress proliferation or cytokine production. Int Immunol. 2007;19:345–54. doi: 10.1093/intimm/dxm014. [DOI] [PubMed] [Google Scholar]
- 42.Khattri R, Cox T, Yasayko SA, Ramsdell F. An essential role for Scurfin in CD4+CD25+ T regulatory cells. Nat Immunol. 2003;4:337–42. doi: 10.1038/ni909. [DOI] [PubMed] [Google Scholar]
- 43.Ocklenburg F, Moharregh-Khiabani D, Geffers R, Janke V, Pfoertner S, Garritsen H, Groebe L, Klempnauer J, Dittmar KE, Weiss S, Buer J, Probst-Kepper M. UBD, a downstream element of FOXP3, allows the identification of LGALS3, a new marker of human regulatory T cells. Lab Invest. 2006;86:724–37. doi: 10.1038/labinvest.3700432. [DOI] [PubMed] [Google Scholar]
- 44.Ziegler SF. FOXP3: of mice and men. Annu Rev Immunol. 2006;24:209–26. doi: 10.1146/annurev.immunol.24.021605.090547. [DOI] [PubMed] [Google Scholar]
- 45.Allan SE, Passerini L, Bacchetta R, Crellin N, Dai M, Orban PC, Ziegler SF, Roncarolo MG, Levings MK. The role of 2 FOXP3 isoforms in the generation of human CD4+ Tregs. J Clin Invest. 2005;115:3276–84. doi: 10.1172/JCI24685. [DOI] [PMC free article] [PubMed] [Google Scholar]
- 46.Allan SE, Alstad AN, Merindol N, Crellin NK, Amendola M, Bacchetta R, Naldini L, Roncarolo MG, Soudeyns H, Levings MK. Generation of potent and stable human CD4+ T regulatory cells by activation-independent expression of FOXP3. Mol Ther. 2008;16:194–202. doi: 10.1038/sj.mt.6300341. [DOI] [PubMed] [Google Scholar]
- 47.Lal G, Zhang N, van der Touw W, Ding Y, Ju W, Bottinger EP, Reid SP, Levy DE, Bromberg JS. Epigenetic regulation of Foxp3 expression in regulatory T cells by DNA methylation. J Immunol. 2009;182:259–73. doi: 10.4049/jimmunol.182.1.259. [DOI] [PMC free article] [PubMed] [Google Scholar]
- 48.Baron U, Floess S, Wieczorek G, Baumann K, Grutzkau A, Dong J, Thiel A, Boeld TJ, Hoffmann P, Edinger M, Turbachova I, Hamann A, Olek S, Huehn J. DNA demethylation in the human FOXP3 locus discriminates regulatory T cells from activated FOXP3(+) conventional T cells. Eur J Immunol. 2007;37:2378–89. doi: 10.1002/eji.200737594. [DOI] [PubMed] [Google Scholar]
- 49.Floess S, Freyer J, Siewert C, Baron U, Olek S, Polansky J, Schlawe K, Chang HD, Bopp T, Schmitt E, Klein-Hessling S, Serfling E, Hamann A, Huehn J. Epigenetic control of the foxp3 locus in regulatory T cells. PLoS Biol. 2007;5:e38. doi: 10.1371/journal.pbio.0050038. [DOI] [PMC free article] [PubMed] [Google Scholar]
- 50.Coenen JJ, Koenen HJ, van Rijssen E, Hilbrands LB, Joosten I. Rapamycin, and not cyclosporin A, preserves the highly suppressive CD27+ subset of human CD4+CD25+ regulatory T cells. Blood. 2006;107:1018–23. doi: 10.1182/blood-2005-07-3032. [DOI] [PubMed] [Google Scholar]
- 51.Battaglia M, Stabilini A, Roncarolo MG. Rapamycin selectively expands CD4+CD25+FoxP3+ regulatory T cells. Blood. 2005;105:4743–8. doi: 10.1182/blood-2004-10-3932. [DOI] [PubMed] [Google Scholar]
- 52.Tao R, de Zoeten EF, Ozkaynak E, Chen C, Wang L, Porrett PM, Li B, Turka LA, Olson EN, Greene MI, Wells AD, Hancock WW. Deacetylase inhibition promotes the generation and function of regulatory T cells. Nat Med. 2007;13:1299–307. doi: 10.1038/nm1652. [DOI] [PubMed] [Google Scholar]
Associated Data
This section collects any data citations, data availability statements, or supplementary materials included in this article.