Abstract
We describe the fabrication of a surface acoustic wave (SAW) device on a LiNbO3 piezoelectric transducer for the transfer of non-volatile analytes to the gas-phase at atmospheric pressure (a process referred to as nebulization or atomization). We subsequently show how such a device can be used in the field of mass spectrometry (MS) detection, demonstrating that SAW nebulization (SAWN) can be performed either in a discontinuous or pulsed mode, similar to that for matrix assisted laser desorption ionization (MALDI) or in a continuous mode like electrospray ionization (ESI). We present data showing the transfer of peptides to the gas-phase, where ions are detected by MS. These peptide ions were subsequently fragmented by collision-induced dissociation, from which the sequence was assigned. Unlike MALDI mass spectra, which are typically contaminated with matrix ions at low m/z, the SAWN generated spectra had no such interference. In continuous mode, the SAWN plume was sampled on a microsecond time scale by a linear ion trap mass spectrometer, and produced multiply charged peptide precursor ions with a charge state distribution shifted to higher m/z compared to an identical sample analyzed by ESI. The SAWN technology also provides the opportunity to re-examine a sample from a flat surface, repeatedly. The process can be performed without the need for capillaries, which can clog, reservoirs, which dilute sample, and electrodes which, when in direct contact with sample, cause unwanted electrochemical oxidation. In both continuous and pulsed sampling modes, the quality of precursor ion scans and tandem mass spectra of peptides was consistent across the plume’s lifetime.
Introduction
In the field of proteomics there have been significant advances in the miniaturization of methods to process samples, leading to a reduction in sample volume using formats commonly referred to as Lab-on-a-Chip (LOAC) technologies. This focus on miniaturization in proteomics is, in large part, due to a desire to minimize sampling loss, which results during handling of proteins and peptides. Unlike genomics, where samples may be amplified via polymerase chain reactions, within proteomics, the investigator is limited to the sample in-hand. As a consequence, LOAC development has generally focused on proxies for traditional protein purification and separation methods including the integration of affinity capture and capillary chromatography methods, on-chip1.
The fundamental technologies underpinning miniaturization and LOAC design, that enables samples to be moved effectively on-chip, is a field known as microfluidics. Within the field of proteomics, there is considerable interest in the integration of technologies associated with microfluidics in order to to process proteins to peptides, and carry out the analysis of low volume or rare samples, including those associated with single cells2. Central to these technological advances is the need to be able to interface the microfluidic structures with currently designed mass spectrometers (MS), popular because they serve as universal detectors.
Surface acoustic wave (SAW) technology is one of many technologies within the field of microfluidics3–17. Importantly, and unlike other microfluidic methods for sample manipulation, it does not require pressure driven pumps, interconnects, nor the integration of electrodes and microchannels (the latter being commonly used in electrokinetic manipulation). The removal of the need for pumps and interconnects mitigates against many of the problems commonly associated with dead volumes, which are particularly disadvantageous when using small volumes or rare, low abundance samples.
SAW devices have already been incorporated into microfluidic workflows to enable mixing using SAW microcentrifugation3 in channels4–6, heating7–8, droplet movement9–11 and delivery to or from a microfluidic port. SAW is also known to be able to nebulize protein samples for array writing with masks12–18. More recently SAW nebulization has been used to generate droplets with diameters of between 5 to 10nm to assist with the synthesis of polymeric nanoparticles19 and to generate protein monodisperse aerosols and nanoparticles for drug delivery12.
Within the field of proteomics, MS is currently the preferred analytical instrumentation for protein identification and analysis20–21. For over a decade, electrospray ionization (ESI)22 has been one of the most popular methods for transferring non-volatile compounds, including peptides, to the gas phase, typically coupling real-time separations (e.g. HPLC) to MS detection23–24. Apart from generation of a continuous stream of ions for HPLC-MS operation, one of the main advantages of ESI is that multiple charged precursor ions result. These higher order charge states, i.e. [M+nH]n+ where n>1, produce peptide tandem mass spectra to which sequence is easily assigned.
Matrix assisted laser desorption ionization25 (MALDI) is another popular method for transfer of peptides to the gas-phase. Unlike ESI, MALDI generates primarily [M+H]+ ions. Whereas ESI generates ions continuously, MALDI is a pulsed technique allowing separation to be de-coupled from ionization. This de-coupling provides the opportunity to re-examine a sample repeatedly. ESI and MALDI have transformed mass spectrometry research of non-volatile biologics and have now largely replaced all prior ionization methods, due to their facile implementation and “soft” transfer processes. They do both however have analytical short-comings that have led to continued research to improve them; i.e. to be more efficient or “softer” (with less perturbation of the analyte). This is evidenced by recent developments of Desorption Ionization On Silicon26 (DIOS), Desorption-ESI27 (DESI) and Laser Ablation-ESI28 (LAESI), to name only a few. Each of these new techniques has attempted to overcome fundamental problems associated with MALDI and ESI.
Here we present data demonstrating MS detection and sequence assignment of peptide ions nebulized from a miniature SAW device. This new, SAW-based “nebulization, which we term SAWN, combines the MALDI advantage of pulsed ionization from a chip (and possibility to reexamine a spot as per) with the ESI advantage of multiply-charged precursor ions. However, in contrast to MALDI mass spectra, which are contaminated with matrix ions at low m/z, the SAWN spectra have no such interference. In addition, unlike ESI, SAWN does not require channels, capillaries or reservoirs, potentially making analysis of select samples, e.g. lipid A extracts which can easily foul nanocapillaries or nozzles used for traditional ESI, more amenable.
Methods
Surface Acoustic Waves
The SAW device (Figure 1) was designed on a 128° Y-cut X- propagating 3″ LiNbO3 wafer that was diced into four segments of equal size, each with a 1.5″ front edge. Each device was made up of 10 pairs of 100μm interdigitated (IDT) electrodes (20 in total) with a 200μm spacing and a 10 mm aperture. The SAW transducer was created using photolithography and lift-off on the piezoelectric substrate. In brief, S1828 photoresist was first spun onto the wafer at 4000 rpm for 30 seconds; pattern transfer involved UV exposure of the resist through a chrome mask for 6.5 seconds; and resist processing was performed in a developer for 40 seconds. IDT microelectrodes were produced by the deposition of 20 nm Ti (adhesion layer) prior to evaporation of 60 nm of Au; lift off was performed in acetone (for 2 hrs) to realize the electrode arrays for the SAW transducer, also the transducer’s surface was not modified. An Agilent MXG Analog Signal Generator N5181A 250KHz – 1GHz (Santa Clara, United States) and Mini Circuits ZHL-5W-1, 5–500MHz amplifier (New York, United States) was used to power the SAW device.
Figure 1. SAW device consisting of 10 pairs of inter-digitated electrode on a sectioned piezoelectric lithium niobate wafer.
The width of each electrode was ~100μm, fabricated with a pitch of 200μm to provide a surface acoustic with a wavelength of 400μm. The aperture the IDT was 10mm. The IDT was excited at it’s resonance frequency of ~ 9.56MHz in a pulse mode where surface acoustic waves were radiated for a 20ms period of a 50ms duty cycle, the power used was 2W, nebulization was achieved under these conditions. .
Sampling and Peptide Samples
Fibrinopeptide B (GluFib) was prepared as a 10 μM stock solution in 50:50 methanol:water with 0.1% (v/v) formic acid. Angiotesin was prepared in the same solvent at 1 μM. Peptides were purchased from Sigma-Aldrich Corporation (St. Louis, MO) and were used without further purification. The solvents were of highest analytical grade available.
Mass Spectrometry
Mass spectra were acquired in the ion trap of a hybrid linear ion trap Fourier-transform ion cyclotron resonance mass spectrometer (LTQ-FT from Thermo Scientific, San Jose, CA) or an LTQ alone. For ESI, samples were delivered via fused silica capillary with pulled tip at 1 μL/min via a syringe pump. The ESI voltage was set at 1.6 kV with the voltage delivered via liquid junction electrode as previously reported23.
Sampling the SAWN plume involved positioning the piezoelectric device 1 cm below the heated capillary inlet and 1 cm distance from the orifice with the centre of the SAWN device being in line with the capillary inlet of the MS using a stage manufactured according to plans from University of Washington Proteome Resource (UWPR, Seattle, WA) the details of this can be found at http://proteomicsresource.washington.edu/nsisource.php. The inlet orifice was maintained at 100V and the heated capillary ion transfer tube maintained at 200°C. SAWN was typically initiated with a modulated signal applied to the IDT, having a 20ms period and the duty cycle synced to the pulsed 4.5kV potential between wafer and MS. . The remainder of the instrument acquisition settings were as reported previously24 and were identical for both ESI and SAWN.
Detection of peptides ions was either across the full m/z range or via selected ion monitoring of the expected precursor ion m/z values. A maximum ion trap time of 200 ms at 1 microscan intervals was used for ESI and SAWN. In the two cases, the applied voltages were quite different; i.e. a 1.6 kV continuously applied to the sample for ESI, and a 4.5kV pulse, not in contact with the sample for SAWN. During sampling of the SAWN plume, droplets were also imaged using a high-speed camera (Red Lake, USA) at 4000 fps which allowed both the nebulization from single pulses and the nebulization angle at which the SAW traveled through the droplet, to be visualized.
Results and Discussion
Power Required for Nebulization
Nebulization was performed using a SAW device on a 128° Y-cut X- propagating LiNbO3 wafer (Figure 1). Studies were carried out exploring the nebulization angle, power for nebulization and ion detection of the two peptides being studied, namely, fibrinopeptide B (GluFib) and angiotensin. Prior to interface with the MS, the SAW device was first tested to determine the onset of nebulization for different liquids, including: water; a mixture of 50:50 water:methanol; and a solution of 10μM GluFib in 50:50 methanol:water with 0.1% formic acid. For a pulse period of 50 msec (Supplementary Figure 1), the pulse width, which was defined as the time the pulse was active during the period, was varied from 1 to 20ms. As can be seen, the power required for nebulization at different pulse widths varied with solution composition, with the lowest power requirement for nebulization observed using the longest pulse width of 20ms. In brief, at ~ 315 mW the solution containing a 50:50 methanol:water mixture required the lowest power for onset of nebulization (Supplementary Figure 1). In contrast, the acidified peptide solution required ~800 mW for the onset of nebulization. Within our droplet, 10 pmol of peptide was loaded on to the SAW device (1μL, 10μM peptide), an amount significantly higher than the detection limit of MS instrumentation23. The stage was positioned at the entrance of the MS, and, under the conditions used, we ensured (by monitoring the ion current at the MS, and by photographic visualization of the plume) that a maximum ion sampling efficiency, with the plume being consistent in its production of flux to the instrument.
Percent Nebulization as Function of Pulse Plume
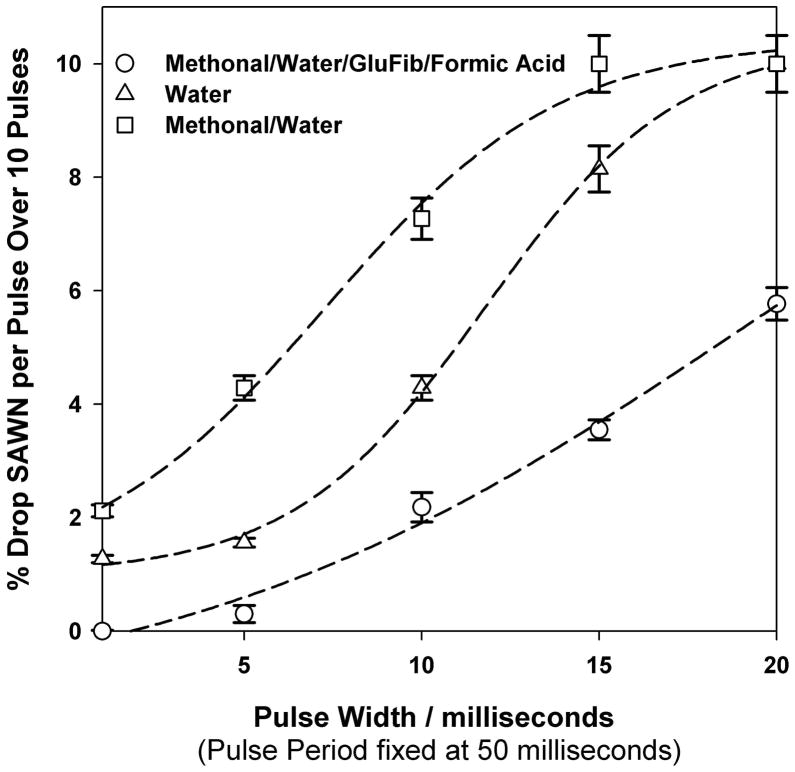
As seen in Figure 2, the volume ejected per pulse width showed, as expected, that more liquid was nebulized as the pulse width increased. The fact that methanol:water showed the greatest tendency to nebulize and that the peptide solution showed the least could be qualitatively related to the surface energy of the drop and the solution viscosity. In this respect, to initalise nebulization of the drop, the air/liquid interface has to be destabilized29 by the formation of capillary waves (a process which is itself dependent on the surface tension of the fluid and its viscosity). To investigate this, we therefore measured the contact angle of the samples on the LiNbO3 at the liquid-wafer-air interface for water, water methanol and water methanol peptide mixtures, Supplementary Figure 2, Lower contact angles, associated with lower surface tension30 will reduce the energy required to nebulise the sample although this relatively simple relationship is complicated by viscosity effects. Thus, acidified Glufib solution, which showed the lowest contact angle (33°) and by implication surface tension, also had the highest viscosity, and thus required more energy for nebulization.
Figure 2. Percentage of the droplet volume nebulized versus pulse duration.
The percentage of droplet nebulized as a function of pulse plume at ~800 mW power for three solutions is shown, namely (△) water, (□) 50:50 methanol:water and (○) 10μM GluFib in 50:50 methanol:water with 0.1% formic acid. The droplet size was 1 μL. Results were collected in triplicate and mean values (with standard errors) are shown.
In the case of the peptide solutions, the results showed that there was the opportunity to nebulize a sample on the SAW chip multiple times (as is the case for MALDI where one may, with the proper precautions to avoid sample loss, probe a “spot” repeatedly over the course of hours or days). Notably, the nebulization process took place in the absence of any matrix, as is used for MALDI. This lack of matrix produced a cleaner low m/z region than MALDI where ions of interest are often obscured by the matrix(see later). Other advantages of the SAWN process for “ionization” are that neither capillaries nor channels are required to move the sample toward the point of nebulization nor is there need for a fixed point charge supplied via an electrode as is the case for ESI, where high voltage contact with the sample can result in electrochemical oxidation of analytes31.
MS Detection of Nebulized Peptides
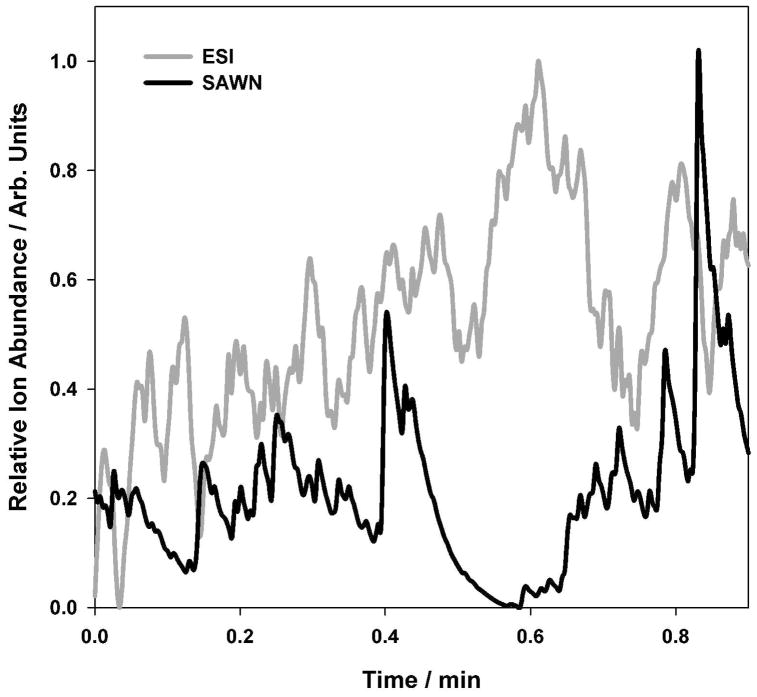
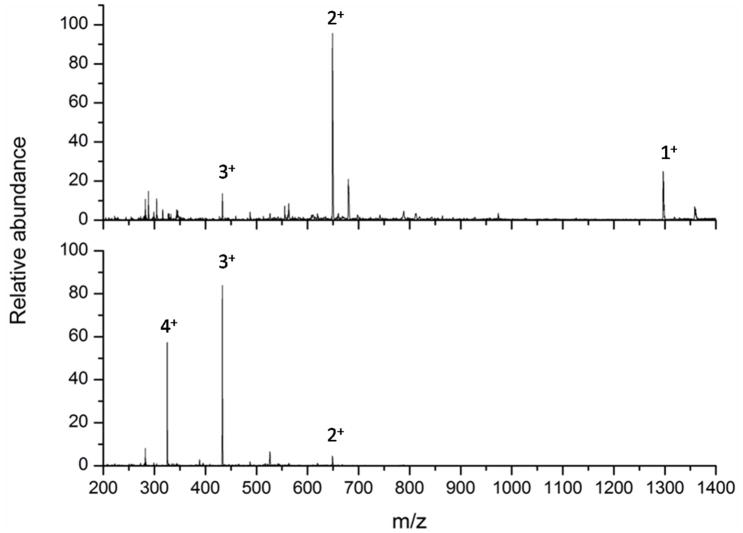
Having optimized the nebulization process using the peptide GluFib, the SAW device was interfaced with an LTQ-FT mass spectrometer. Mass spectra and fragment ion tandem mass spectra were generated from 1 μL of sample of 1 μM angiotensin (1 pmol) nebulized from the SAW chip. Figure 3 shows that, although the stability of SAWN generated ions of angiotensin were more variable compared to the same ions generated by ESI, the quality of the mass spectra were, in both cases, identical across the acquired ion current stability diagrams (Figure 3). Depending upon the volume of sample and the nebulization conditions used, the SAWN generated plume could last several minutes, but the precursor ion mass spectrum was qualitatively different than the ESI generated mass spectrum. Notably, the SAWN generated mass spectrum produced a charge state distribution with an [M+2H]2+ ion base peak and a [M+H]+ ion ~25% the intensity of the base peak (Figure 4 Top and 4 Bottom). When the same solution was subjected to ESI, the base peak was an [M+3H]3+ ion with no detectable [M+H]+ ion. This shift toward lower charge state in the SAWN generated mass spectrum suggests that the mechanism for ionization and droplet desolvation is fundamentally different to that of ESI. Note, it has been shown that biomolecules, such as proteins, are not denatured by the SAWN method due to the high frequency, which prevents cavitation, and shear degradation33.
Figure 3. Angiotension relative ion current versus time.
Single ion current trace as a function of time for angiotensin “ionized” by surface acoustic wave nebulization (bottom) and electrospray ionization (top).
Figure 4. Angiotensin precursor ion mass spectra.
Angiotensin was ionized by surface acoustic wave nebulization (top) and electrospray ionization (bottom) and Figures created by averaging one minute of data from Figure 3.
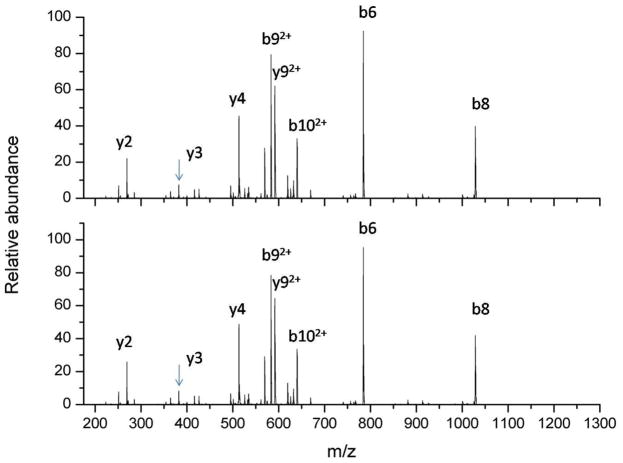
Finally, both ESI and SAW generated angiotensin [M+2H]2+ ions were subjected to collision induced dissociation. As can be seen in Figure 5 the tandem mass spectra for angiotensin were identical from ESI and SAWN plumes, demonstrating the feasibility of conducting higher order tandem mass spectrometry experiments from a SAW device.
Figure 5.
Angiotensin tandem mass spectra. Tandem mass spectra were generated by collision induced dissociation of the [M+2H]2+ ion of angiotensin after ionization by SAW nebulization (top) and electrospray ionization (bottom). Major fragment ions are labeled according to Roepstorf and Fohlman nomenclature32. Both spectra were generated by averaging one minute of data.
Conclusions
We have optimized peptide nebulization from a SAW chip for detection by mass spectrometry and conducted tandem mass spectrometry on SAW nebulized peptide ions. We show that the SAW nebulization process may be conducted in a continuous mode, similar to ESI, or in a pulsed mode, similar to MALDI. In the continuous mode, the SAW nebulized peptide signal lasted an average of two minutes. Importantly, the SAW generated nebulization process could also be controlled in an on/off fashion allowing re-interrogation of a deposited solution. When compared to the same sample solution ionized by ESI, the charge state distribution for the SAW nebulized peptide was shifted toward high m/z (i.e. lower charge state) indicating a different mechanism of ionization and droplet desolvation than ESI. We note also that the ESI-like mass spectra (i.e. multiple charge states but shifted toward high m/z) were generated from a flat surface where neither capillaries nor channels were required. Importantly, for many oxidation-sensitive chemicals, the sample was not in contact with metal electrodes or a continuously applied voltage, as is the case when using ESI. Additionally, the absence of any matrix as used for MALDI allowed the low m/z region to be examined off the chip without interference of matrix ions. Finally, peptide tandem mass spectra were recorded that allowed sequence to be assigned to the peptide suggesting this method has general utility in the field of proteomics.
Supplementary Material
Acknowledgments
JMC and SRH thank RASOR, EPSRC and the DTC for their support. DRG and SAS also thank USA NIH grants R33CA099139-04 and 1S10RR017262-01 for their support. We acknowledge the help of Dr. Nicolas Morrice, University of Dundee, for access to an LTQ mass spectrometer.
Contributor Information
Scott R. Heron, Email: s.heron@elec.gla.ac.uk.
Rab Wilson, Email: r.wilson@elec.gla.ac.uk.
Scott A. Shaffer, Email: sshaffer@u.washington.edu.
David R. Goodlett, Email: goodlett@u.washington.edu.
Jonathan M. Cooper, Email: jmcooper@elec.gla.ac.uk.
References
- 1.Tia S, Herr AE. Lab Chip. 2009;9(17):2524–36. doi: 10.1039/b900683b. [DOI] [PubMed] [Google Scholar]
- 2.Figeys D. Curr Opin Mol Ther. 1999;1(6):685–694. [PubMed] [Google Scholar]
- 3.Shilton R, Tan MK, Yeo LY, Friend JR. Journal of Applied Physics. 2008;104:014910. [Google Scholar]
- 4.Sritharan K, Strobl CJ, Schneider MF, Wixforth A. Applied Physics Letters. 2005;88:054102. [Google Scholar]
- 5.Tseng WK, Lin JL, Sung WC, Chen SH, Lee GB. J Micromech Microeng. 2006;16:539–548. [Google Scholar]
- 6.Tan MK, Yeo LY, Friend JR. EPL. 2009;87:47003. [Google Scholar]
- 7.Kondoh J, Shimizu N, Matsui Y, Shiokawa S. IEEE Translations on Ultrasonics, Ferroelectrics and Frequency Control. 2005;52(10):1881–1883. doi: 10.1109/tuffc.2005.1561646. [DOI] [PubMed] [Google Scholar]
- 8.Schneble RJ, Kataoka M, Ford CJB, Barnes CHW, Anderson D, Jones GAC, Farrer I, Ritchie DA, Pepper M. Applied Physics Letters. 2006;89:122104. [Google Scholar]
- 9.Wixforth A. Superlattices and Microstructures. 2003;33:389–396. [Google Scholar]
- 10.Beyssen D, Le Brizoual L, Elmazria O, Alnot P. Sensors and Actuators B. 2006;118:380–385. [Google Scholar]
- 11.Guttenberg Z, Muller H, Habermüller H, Geisbauer A, Pipper J, Felbel J, Kielpinski M, Scriba J, Wixforth A. Lab Chip. 2005;5(3):308–317. doi: 10.1039/b412712a. [DOI] [PubMed] [Google Scholar]
- 12.Alvarez M, Friend J, Yeo LY. Nanotechnology. 2008;19(45):455103. doi: 10.1088/0957-4484/19/45/455103. [DOI] [PubMed] [Google Scholar]
- 13.Alvarez M, Friend JR, Yeo LY. Langmuir. 2008;24:10629–10632. doi: 10.1021/la802255b. [DOI] [PubMed] [Google Scholar]
- 14.Chono K, Shimizu N, Matsui Y, Kondoh J, Shiokawa S. JJAP. 2004;43(5B):2987–2991. [Google Scholar]
- 15.Bennes J, Alzuaga S, Ballandras S, Cherioux S, Bastien S, Manceau JF. IEEE Ultrasonics Symposium. 2005;2:823–826. No. 0-7803-9383-X/05. [Google Scholar]
- 16.Kurosawa M, Watanabe T, Futami A, Higuchi A. Sensors and Actuators A. 1995;50:69–74. [Google Scholar]
- 17.Kurosawa M, Futami A, Higuchi T. IEEE solid state sensors and actuators. 1997;2:801–804. [Google Scholar]
- 18.Kim J, Yamagata Y, Takasaki M, Lee B, Ohmori H, Higuchi T. Sensors and Actuators B. 2005;107:535–545. [Google Scholar]
- 19.Friend J, Yeo L. Nanotechnology. 2008;19(14):145301. doi: 10.1088/0957-4484/19/14/145301. [DOI] [PubMed] [Google Scholar]
- 20.Wehr T. LCGC. 2001;19(7):702–711. [Google Scholar]
- 21.Aebersold R, Goodlett DR. Chem Rev. 2001;101(2):269–295. doi: 10.1021/cr990076h. [DOI] [PubMed] [Google Scholar]
- 22.Fenn JB, Mann M, Meng CK, Wong SF, Whitehouse CM. Science. 1989;246:64–71. doi: 10.1126/science.2675315. [DOI] [PubMed] [Google Scholar]
- 23.Yi EC, Lee H, Aebersold R, Goodlett DR. Rapid Commun Mass Spectrom. 2003;17:2093–2098. doi: 10.1002/rcm.1150. [DOI] [PubMed] [Google Scholar]
- 24.Scherl A, Shaffer SA, Taylor GK, Hernandez P, Appel RD, Binz PA, Goodlett DR. J Am Soc Mass Spectrom. 2008;19(6):891–901. doi: 10.1016/j.jasms.2008.02.005. [DOI] [PMC free article] [PubMed] [Google Scholar]
- 25.Hillenkamp F, Karas M, Ingendoh A, Stahl B. Biological Mass Spectrometry. 1990:49–60. [Google Scholar]
- 26.Wei J, Buriak JM, Siuzdak G. Nature. 1999;399(6733):243–246. doi: 10.1038/20400. [DOI] [PubMed] [Google Scholar]
- 27.Takáts Z, Wiseman JM, Gologan B. Cooks RG Science. 2004;306(5695):471–473. doi: 10.1126/science.1104404. [DOI] [PubMed] [Google Scholar]
- 28.Nemes P, Vertes A. Anal Chem. 2007;79(21):8098–8106. doi: 10.1021/ac071181r. [DOI] [PubMed] [Google Scholar]
- 29.Qi A, Yeo L, Friend J. Physics of Fluids. 2008;(20):074103. [Google Scholar]
- 30.Thompson JW, Kaiser TJ, Jorgenson JW. Journal of Chromatography A. 2006;1134:201–209. doi: 10.1016/j.chroma.2006.09.006. [DOI] [PubMed] [Google Scholar]
- 31.Boys BL, Kuprowski MC, Noël JJ, Konermann L. Anal Chem. 2009;81(10):4027–4034. doi: 10.1021/ac900243p. [DOI] [PubMed] [Google Scholar]
- 32.Roepstorff P, Fohlman J. Biomedical Mass Spectrometry. 1984;11(11):601. doi: 10.1002/bms.1200111109. [DOI] [PubMed] [Google Scholar]
- 33.Qi A, Yeo L, Friend J, Ho J. Lab Chip. 2010;10(4):470–476. doi: 10.1039/b915833b. [DOI] [PubMed] [Google Scholar]
Associated Data
This section collects any data citations, data availability statements, or supplementary materials included in this article.


