Abstract
Purpose
The vitreous humor liquefies with age and readily sloshes during eye motion. The objective was to develop a computational model to determine the effect of sloshing on intravitreal drug transport for transscleral and intra-vitreal drug sources at various locations
Methods
A finite element model based on a telescopic implicit envelope tracking scheme was developed to model drug dispersion. Flow velocities due to saccadic oscillations were solved for and were used to simulate drug dispersion.
Results
Saccades induced a three-dimensional flow field that indicates intense drug dispersion in the vitreous. Model results showed that the time scale for transport decreased for the sloshing vitreous when compared to static vitreous. Macular concentrations for the sloshing vitreous were found be much higher than that for the static vitreous. For low viscosities the position of the intravitreal source did not have a big impact on drug distribution.
Conclusion
Model results show that care should be taken when extrapolating animal data, which are mostly done on intact vitreous, to old patients whose vitreous might be a liquid. The decrease in drug transport time scales and changes in localized concentrations should be considered when deciding on treatment modalities and dosing strategies.
Keywords: age-related macular degeneration, transscleral, drug delivery, vitrectomy, vitreous liquefaction
INTRODUCTION
The vitreous humor (henceforth, “vitreous”) is the transparent highly (99%) hydrated, viscoelastic gel (1, 2) that fills the posterior part of the eye. Apart from its other functions, which are to provide structural support to the eye and to keep the retina adhered to the eye-wall, it also acts as a barrier for heat and mass transport between the posterior and anterior segments of the eye. Some of these functions are affected when the vitreous loses its structural homogeneity during the natural aging process. With age, the vitreous undergoes a progressive liquefaction process, wherein it loses its gel-like structure and with it its elastic properties and becomes a liquid (3).
In many cases, e.g., to treat retinal tears, vitrectomy is performed, wherein the vitreous is removed, and the void space is filled with an artificial vitreous substitute such as silicone oil or a perfluorocarbon liquid (4). In some cases, perfluorocarbon gas is used to provide a short-term tamponade effect to aid in the healing of a retinal tear. Once the tear is completely healed, the gas is removed from the vitreous chamber, allowing the aqueous humor, a water-like fluid from the anterior eye, to fill the void space.
The presence of a viscous liquid in the vitreous chamber, either due to liquefaction or as a result of vitrectomy, could potentially impact heat/mass transport in the posterior eye. Harocopos et al. (5) and Holekamp et al. (6) observed an increase in incidence of nuclear cataracts in vitrectomized eyes and attributed the findings to elevated oxygen levels close to the lens. Without the transport barrier that the vitreous gel provides, oxygen released by the retinal arterioles could readily transport through the vitreous, resulting in a higher-than-normal concentration at the lens. A similar effect on the distribution of oxygen in the eye was observed by Stefansson et al. (7). An increase in the clearance of intravitreal triamcinolone acetonide and amphotericin in vitrectomized eyes as compared to nonvitrectomized eyes was observed by Chin et al. (8) and Doft et al. (9), respectively. Barton et al. (10) showed evidence suggesting that the increased rate at which molecules are redistributed in the vitreous compartment in the absence of the vitreous gel, or after vitreous degeneration, is more likely due to an increase in fluid circulation than a difference in diffusion of the molecules in the gel vis-à-vis the liquid. Further evidence for the above can be seen in the work done by Walton et al. (11). They observed that vitreous mobility, brought about by rapid eye oscillations, increased with the degree of liquefaction. Eye oscillations, also called saccades, help to orient the line of sight, allowing us to refocus regularly at different locations. Since saccades happen rapidly, the vitreous sloshing velocities could be high, resulting in significant convective transport. In this article, we focus on the effect of vitreous sloshing on the distribution of drugs targeted to the posterior eye, e.g. in the treatment of age-related macular degeneration (AMD).
Numerous techniques exist or are being developed to deliver drugs to the posterior eye. Among them, intravitreal and transscleral drug delivery have attracted the attention of the research community recently. Conventional drug delivery techniques, such as systemic and topical delivery, are limited in efficacy, as they fail to overcome physiological barriers and do not maintain desired drug levels at the target tissues in the posterior eye. Intravitreal and transscleral drug delivery provide direct access to the posterior eye and, hence, are considered better suited to diseases like AMD (12). Subsequent to intravitreal or transscleral delivery, drug transports through the vitreous to reach the posterior tissues. Invariably, new delivery methods are tested on relatively young animals with an intact vitreous when the eventual target is the elderly population that suffers from AMD, who are likely to have a liquefied vitreous. Since the window of effectiveness for most drugs is narrow and the target is the macula, not the entire eye, understanding the effect of increased vitreous mobility on biodistribution of drugs is paramount. To emphasize this, we reference the work done by Hegazy et al. (13), who observed that the presence of silicone oil in vitrectomized eyes increased the toxicity of drugs which were injected into the vitreous in previously determined non-toxic doses.
Although the effect of drug diffusion in the vitreous and convection due to steady permeation of aqueous humor through the vitreous have been studied theoretically (14, 15), a model of saccade-induced dispersion on drug distribution has not yet been presented.
Owing to the importance of intravitreal transport, numerous studies have been performed. Early studies (e.g., (16–18)) focused on diffusion of drug through a static vitreous. The next generation of models (e.g., (14, 19)) addressed convection by steady intravitreal flow from the anterior chamber but did not account for flow due to motion of the eye. In spite of the considerable numerical challenge of modeling saccadic motion, there has been considerable work done in the area by Stocchino and coworkers (20–24). In their models, they provide comprehensive details on the complexity of the flow induced within the vitreous chamber by saccadic motion but ignore the enhancement in transport due to increased mixing and its impact on the biodistribution of drug in the vitreous, which is addressed in this study.
Modeling saccade-induced dispersion presents some challenges at the outset which have been dealt with in detail elsewhere (25). The present work focuses less on the development of the computational model and more on the applicability of the model towards practical issues in posterior segment drug delivery. The main objective of this work was to provide insight into the effect of vitreous sloshing on drug uptake, clearance from the vitreous, drug retention in the vitreous, and, most importantly, macular concentrations for both transscleral and intra-vitreal drug sources for varying degrees of vitreous liquefaction.
MATERIALS AND METHODS
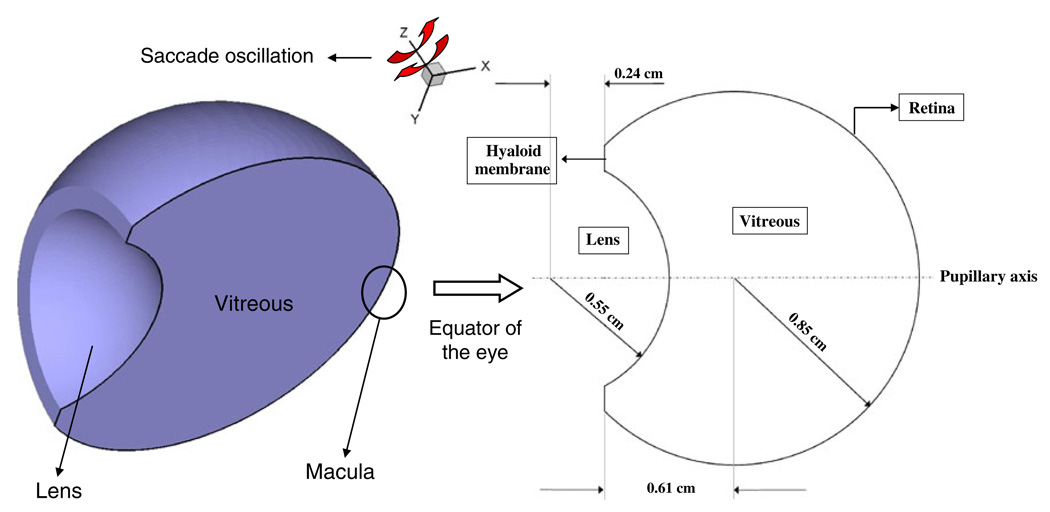
A three-dimensional model based on the Galerkin finite element method (GFEM) was developed to simulate drug dispersion in the vitreous chamber. Since our focus was only the vitreous, other posterior tissues, including the sclera, choroid, and retina with its pigment epithelium, were not modeled. Fig. 1 shows a schematic of the vitreous geometry that was used. The dimensions indicated in the figure are those of the human eye as used by others (15, 17). The vitreous is bounded by the hyaloid and lens on the anterior side and by the retina on the posterior side. The vitreous sloshing velocities were first computed and were later used to solve for the drug concentrations in the eye. Due to symmetry, only half the vitreous was modeled.
Fig. 1.
Schematic of the geometry of the vitreous showing the domains and the boundaries along with the axis of saccade oscillations (z-axis). Only half the vitreous was modeled due to symmetry.
Model Development: Fluid Flow Problem
Vitreous motion can be attributed to various eye and head movements. Some of the movements are small-amplitude, high-frequency oscillations, while others are large-amplitude oscillations. In our model, small-amplitude saccades were assumed to cause negligible drug dispersion when compared to the large-amplitude saccades and were neglected. Also, only left-right saccadic oscillation was considered, as noted in Fig. 1. The saccades were modeled as sinusoids, and a 40° continuous saccade oscillation was chosen to investigate the effects of vitreous sloshing on drug transport.
Becker (26) developed emperical relationships to describe the amplitude (A), duration (D), and peak angular velocity (Ωp) for saccades. The saccade duration for amplitudes in the range 5° < A < 50° was determined to be linearly dependent on amplitude based on the relationship
| (1) |
where D0 and d were constants measured to be 0.025 s and 0.0025 s deg−1, respectively. The time period (T) of a saccade oscillation of amplitude A would be
| (2) |
Becker suggested that the relationship between peak (Ωp) and average angular velocity (Ω̅ = A/D) is
| (3) |
Based on the above relationships, the time period, average angular velocity, and peak angular velocity for a 40° saccade oscillation were evaluated to be 0.25 s, 0.7 rad s−1, and 1.14 rad s−1, respectively. The saccade angular velocity (Ω) was modeled using a sinusoid with the above calculated peak velocity as
| (4) |
where ω = 2π/T rad s−1 is the angular frequency of oscillation. Such an approximation for the saccade angular velocity resulted in an overshoot of 2.6% for angular displacement, which was considered acceptable. It should be noted that the dynamics of real saccades are very complex, and a simplistic approach like ours does not entirely capture that complexity. However, given the focus of this work, the simplistic approach was deemed to be sufficient.
The vitreous humor was modeled as a purely viscous Newtonian fluid, as for our problem of interest, the vitreous is either liquefied or replaced with a tamponade fluid. David et al. (27) developed an analytical model for fluid flow in the vitreous. They observed that the elastic properties of the vitreous do not significantly affect the flow field. Since the vitreous is mainly composed of water, it is assumed that a completely liquefied vitreous would have similar properties to that of water. The viscosity of the vitreous gel has been measured to be 0.03–2 Pa·s (1, 4), and hence the partially liquefied vitreous was assumed to be up to three orders of magnitude more viscous than water. Also, most tamponade fluids, typically silicone oils, are highly viscous Newtonian fluids with a viscosity that is almost three to four orders of magnitude higher than that of water. Hence, in our simulation, the viscosity was varied from 0.001 to 1 Pa·s by multiples of ten to simulate the entire range of viscosity for vitreous fluids. It should be noted that apart from the viscosity effects, the chemistry of the vitreous substitute could impact transport. For example, the diffusivity of the drug in the vitreous substitute could be different from that used in the model. Also, partitioning effects could be significant. Chemical effects were not dealt with in this work.
The fluid velocity in the vitreous chamber was calculated by solving the three-dimensional Navier-Stokes equations. Stocchino et al. (24) found that the flow becomes approximately periodic after a few cycles; hence, we solve for the velocity for four periods and assume periodicity. The problem was solved in a frame of reference rotating along with the vitreous; hence, the equations were modified to accommodate the change as follows:
| (5) |
| (6) |
where, r, Ω, α, and v are the radial coordinate, saccade angular velocity, saccade angular acceleration, and velocity relative to the rotating frame of reference, respectively. The other symbols in the equations have their usual meanings. The walls of the vitreous were assumed to be stationary in the rotating frame. A multi-module GFEM code in C was written and was used to solve the fluid flow problem in the vitreous. The model domain was divided into 12,285 hexahedral 27-node elements. The total number of nodes in the domain was 104,725. Velocity was calculated on all nodes of an element, while the pressure was solved for only on nodes at the element corners. Hence, tri-quadratic and tri-linear basis functions were used to solve for the velocity and pressure respectively. Implicit Euler was used to integrate the ordinary differential equations resulting from the GFEM discretization and Newton-Raphson iteration was used for the nonlinear algebraic problem. MUMPS (MUlti frontal Massively Parallel sparse direct Solver (28)) was used to solve the resulting system of algebraic equations.
Model Development: Drug Dispersion Problem
The convective-diffusive transport equation was used to solve for the concentration of drug in the vitreous.
| (7) |
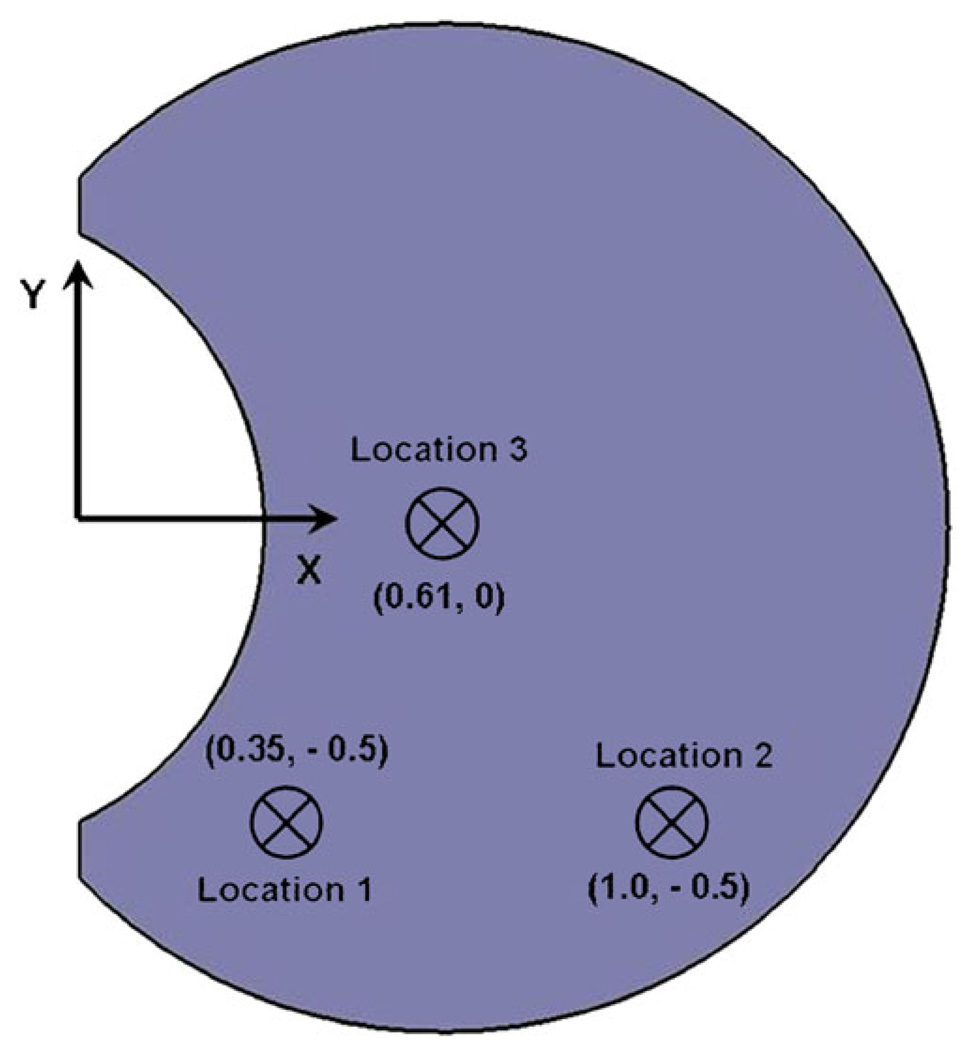
where c is the concentration of drug, v is the velocity of the fluid calculated from Eqs. 4 and 5, and Dv is the diffusivity of the model drug (fluorescein) in the vitreous. The diffusivity for fluorescein in the vitreous humor was set to be 6 × 10⁻⁶ cm2s−1 (which is the typical value used in literature (15, 16)). The diffusivity does not change significantly with change in physical state of the vitreous (10). Two types of drug sources were modeled to evaluate the impact of vitreous sloshing. To simulate transscleral drug delivery, a constant-concentration surface source on the sclera was considered, and to simulate intravitreal drug delivery in the form of an injection, a Gaussian point source was placed in the vitreous. The constant-concentration transscleral source was placed on the equator to make use of symmetry. The point source was placed at three different locations on the equator of the eye to evaluate the effect of placement of the injection on drug distribution. The positions of the point source are illustrated in Fig. 2.
Fig. 2.
Schematic showing the position of the point sources in the vitreous. The point sources were placed on the equator of the eye. Injections were idealized to a single point, neglecting trailing or mixing due to the withdrawal of the needle.
Boundary Conditions
The flux of drug into and out of the vitreous through the retina is dependent on the transport properties of the posterior tissues, like sclera, choroid, and retina with its pigment epithelium. The retinal pigment epithelium (RPE) is known to transport solutes actively from the vitreous out of the eye (29). Drug diffusing through the choroid is also cleared away by the vast network of blood vessels (choriocapillaris) in the choroid (30). These transport phenomena were modeled using parameters estimated previously to determine the boundary conditions on the vitreous surface (31).
Two sets of flux boundary conditions were evaluated for our problem:
flux of drug from the vitreous out of the eye through the retinal surface and
flux of drug into the vitreous from a constant concentration transscleral drug source.
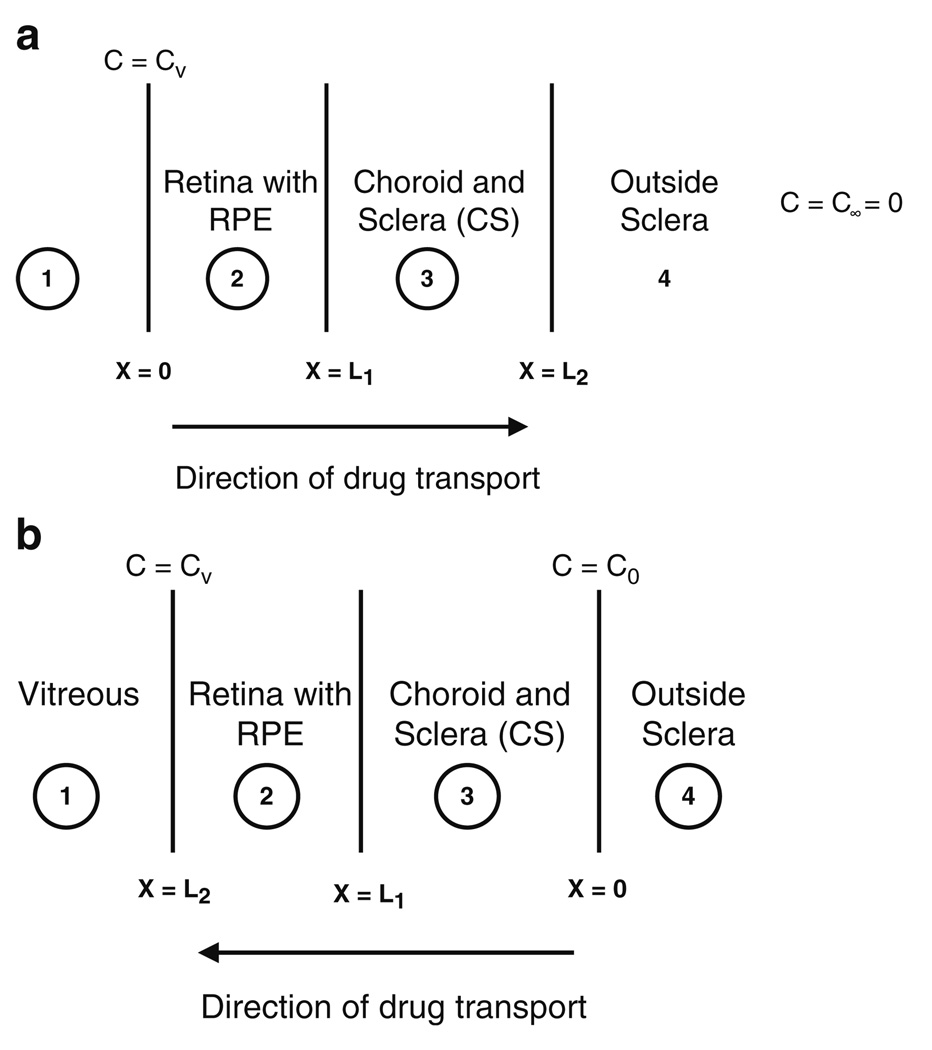
Fig. 3a and b illustrate the two cases. The thickness of sclera, choroid, and retina is small (~ 7%) compared to the radius of curvature of the vitreous. Hence, transport in these posterior tissues was assumed to be planar and one-dimensional. The choroid and sclera were lumped as one entity following our previous analysis (31). Owing to the small thickness of the posterior tissues, the dynamics of transport in them were assumed to play a limited role in determining vitreous drug concentrations; hence, a pseudo-steady-state approximation was used. To further simplify the problem, the choroid and the retina under the transscleral source were assumed to be ablated. The assumption is justified, as ablation eliminates potential impediments to drug transport, namely, active transport by the RPE and loss to choroidal blood flow, and hence improves the efficacy of the method. Based on these assumptions, a set of planar, one-dimensional transport equations were solved in the posterior tissues, and the flux values were evaluated.
Fig. 3.
Illustration of the one-dimensional pseudo-steady-state model used to simulate transport in the posterior tissues like retina/RPE, choroid and sclera. The models were used to evaluate (a) flux of drug from the vitreous out of the eye through the retinal surface, and (b) flux of drug into the vitreous from a constant concentration transscleral drug source.
Flux of drug out of the retinal surface was determined to be
| (8) |
The flux into the vitreous from a transscleral drug source was determined to be
| (9) |
Here, c0 is the concentration of the transscleral drug source, and cv is the vitreous drug concentration at the retinal surface. The outward normal at the surface is given by n. To model the impact of drug dispersion in the vitreous for a transscleral drug source, Eq. 7 was used as the boundary condition at the retinal surface right under the drug source, and Eq. 8 was used elsewhere on the retinal surface. For simulations of intravitreal source, Eq. 8 was used for the entire retinal surface. The planar, one-dimensional transport equations along with details of the derivation that were used to estimate the fluxes are provided in the Appendix.
The boundary condition at the hyaloid and lens was set to be
| (10) |
and
| (11) |
respectively. cv here is the vitreous drug concentration at the hyaloid. The mass transport coefficient at the hyaloid in Eq. 9 was based on existing drug transport models in literature (19). The flux at the lens surface was set to zero, i.e. no penetration of drug into the lens (32). It should be noted that the clearance flux from the vitreous would increase with drug accumulation at the retina and hyaloid. The coefficients in the boundary terms represent the general case. The processes represented by those coefficients, and thus the coefficients themselves, may change with age. Absent any published data, however, we assumed in our analysis that the major change in the aging eye with respect to intravitreal transport was liquefaction.
Convection-Dominated Transport
The Péclet number (Pé) for our problem was defined as the ratio of the diffusive to the convective time scale.
| (12) |
where L is the characteristic length, and U is the characteristic velocity. With the radius of the vitreous as L and the average eye wall velocity as U, Pé was evaluated to be of the order of 106. At such high Péclet numbers, the Galerkin finite element method becomes unstable, and spurious oscillations in space and time cloud the actual solution unless a highly refined mesh is used (33). Mesh refinement improves stability by balancing the disparity between convection and diffusion at the length scale of the finite element. Given the magnitude of the Péclet number, the amount of mesh refinement that would be needed for stability would render the problem prohibitively large. To overcome the problem, we used the streamline upwinding technique discussed by Brooks et al. (33). An artificial balancing diffusivity was added along the streamlines to balance the strength of convection. The net diffusivity (true plus balancing), was defined as
| (13) |
where ⊗ is the dyad product, and D is the net diffusivity tensor. The balancing diffusivity, Dbal, is a function of the velocity (v), element dimension in the direction of velocity, and the mesh Péclet number. The mesh Péclet number is defined similarly to the overall Péclet number, except that the element dimension is used as the characteristic length scale.
The functional form of the balancing diffusivity (Dbal) and the impact of artificial diffusivity on the results have been discussed elsewhere (25). Briefly, a test problem with a known analytical solution was simulated with the numerical scheme, and the results were compared to assess the error introduced by artificial diffusivity and the overall numerical scheme.
Multi-Scale Time Integration
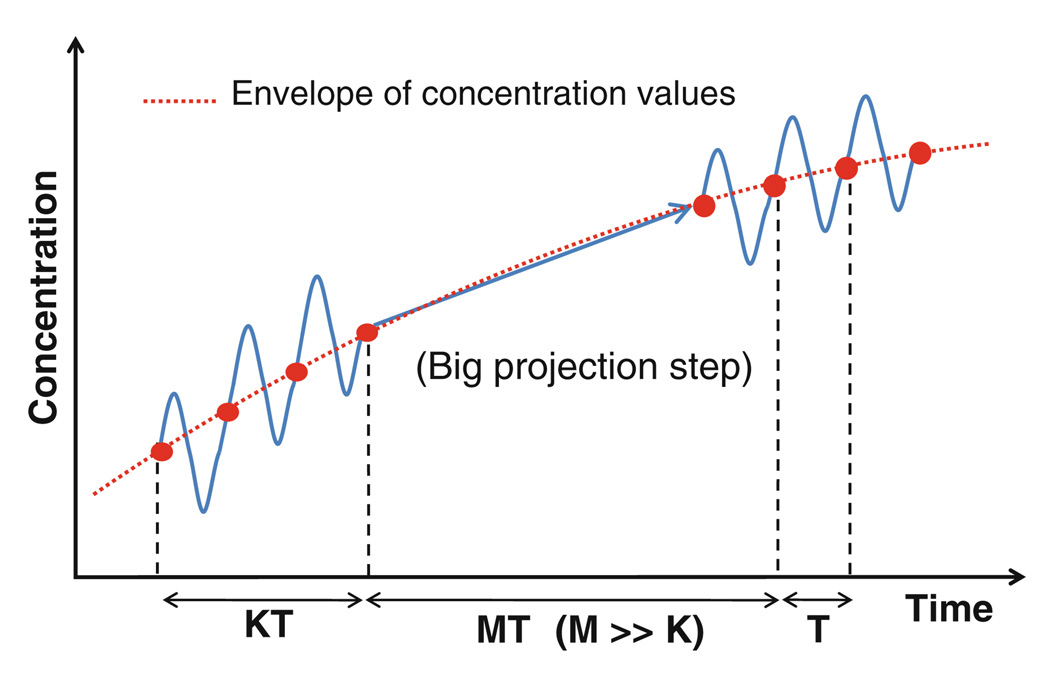
Three time scales were identified in the above problem: convective, diffusive, and the time period of saccade oscillations. The convective (L/U) and diffusive time scales (L2/Dv) were evaluated to be approximately 0.2 s and 33 h, respectively. The time period of oscillation for a 40° saccade was evaluated based on Eq. 1 to be 0.25 s. Clearly, there is a wide separation between the time scales, and conventional techniques for time integration would necessitate the use of time steps of the order of the smallest time scale. Simulating over long periods using such an approach would lead to impractical processing times. On the other hand, using large time steps corresponding to the diffusive time scale would result in loss of valuable information provided by the smaller time scales. To overcome the problem, a multi-scale scheme based on implicit envelope tracking was used to solve the problem (34). The envelope of the fast-varying components is expected to be a slowly varying function of time, since the diffusive process underlying the fast oscillations is slow. Hence, the method tracks the envelope of the variations instead of the fast oscillations. The method is illustrated in Fig. 4. At each time step, the concentration was evaluated over a few small periods (K) to determine the trend in the envelope. The trend was then extrapolated using a big time step (MT, where M ≫ K), in a fully implicit manner to move forward in time.
Fig. 4.
Schematic of the multi-scale envelope tracking method proposed by Petzold (34) to bridge the time scales.
The extent of speed-up achieved, however, was limited by stability (35). To achieve increased speed-ups without compromising on stability, telescopic projective methods were combined with the above technique. We have dealt with the method used to solve the vitreous dispersion problem only briefly in this paper, as it was considered to be beyond the scope of this current work. The detailed methodology for simulating dispersion in rapidly oscillating flows is presented elsewhere (25).
The mass transport problem was solved using the same mesh as the fluid flow problem. Concentration was calculated on all the nodes, and tri-quadratic basis functions were used to interpolate between nodes. Implicit Euler was used as the time-stepping method for the fast oscillations, with MUMPS as the solver. For the implicit projections for tracking the envelope of oscillations, GMRES was used to solve the linear equations.
RESULTS
Vitreous Sloshing Flow Field
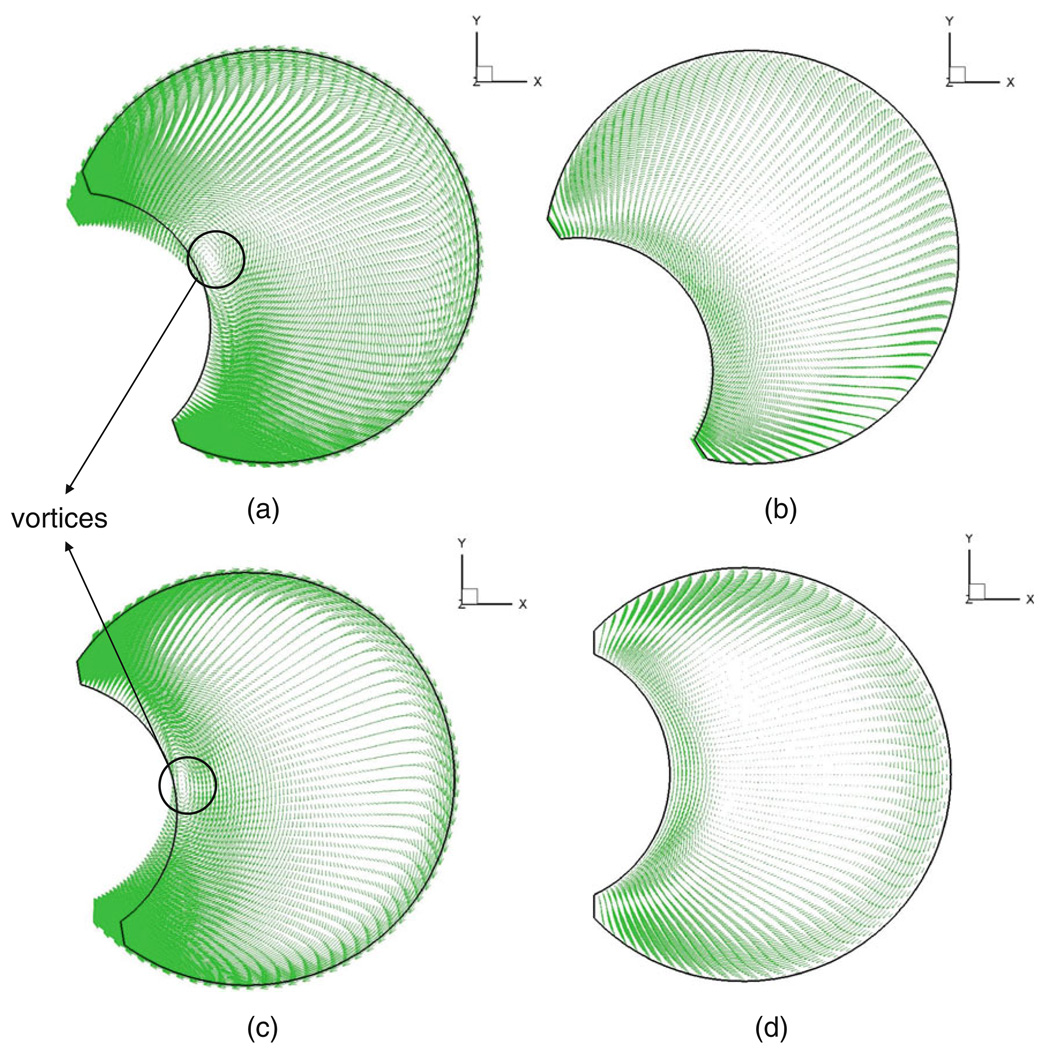
Velocity vector fields depicting flow in the vitreous are shown in Fig. 5 at times t = 0, T/4, T/2, and 3 T/4. The figures show the velocity with respect to a stationary frame of reference on the equatorial plane of the vitreous when its viscosity was set to 0.01 Pa·s. Stocchino et al. (24) investigated the dynamics of vitreous humor motion induced by eye rotations experimentally, and our computational results match their experimental PIV (particle image velocimetry) measurements qualitatively. A quantitative comparison was not feasible given the nature of the experimental work. In the following paragraph, we highlight some of the salient features of the flow field and refer the interested reader to Stocchino’s work for a detailed review.
Fig. 5.
Velocity vector fields depicting flow in the vitreous at (a) T = 0, (b) T = T/4, (c) T = T/2, (d) T = 3 T/4 for μ = 0.01 Pa.s. The velocity vectors on the equator of the vitreous are shown.
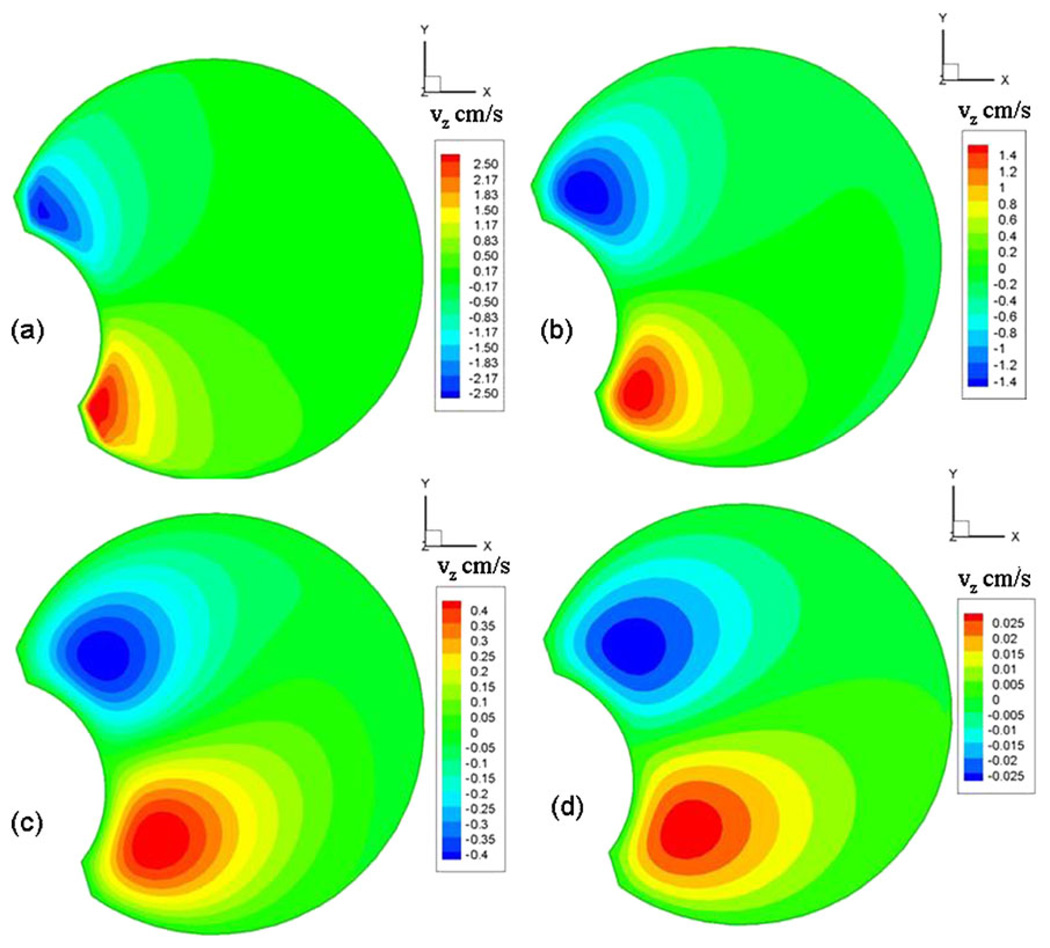
The presence of the lens, which causes the vitreous geometry to deviate from a sphere, influenced the flow field greatly. In our model, vortices were observed to form adjacent to the lens surface and were found to migrate towards the core of the domain before dissipation (Fig. 5). They formed and dissipated on either side of the peak velocity value for both the rise and fall cycles and lasted for almost half the time period of oscillation. Both David et al. (27) and Repetto et al.(22), in their fluid flow model inside a spherical vitreous, observed that the fluid velocity components in the direction of the axis of rotation (z-axis) were up to four orders of magnitude smaller than the velocity components on planes perpendicular to the axis of rotation (x-y plane). However, Stocchino et al. speculated that the presence of the lens would increase the z-velocity component. Our model results showed that the maximum z-velocity varied from two orders of magnitude lower to on par with the x-y-velocity components. The z-velocities were comparable to the x-y components when the viscosity was 0.001 Pa·s and were two orders of magnitude smaller when the viscosity was 1 Pa·s. As shown in Fig. 6, the maximum z-velocities occurred near the lens. The scale bars on the chart for the four figures indicate the magnitude of the z-velocity component for the different viscosities considered. A similar result was reported by Stocchino et al., who observed particle accumulation close to the lens, which would suggest an ejection of flow close to the lens along the z-axis. The zone where the maximum velocity was observed shifted posteriorly with increase in viscosity. Such a complicated three-dimensional flow would cause intense mixing of the vitreous fluid and, hence, significant drug dispersion.
Fig. 6.
Maximum z-velocities on the plane z = 0.35 cm for (a) μ = 0.001 Pa.s, (b) μ = 0.01 Pa.s, (c) μ = 0.1 Pa.s, (d) μ = 1.0 Pa.s. The maximum z-velocities were observed on this plane.
Drug Dispersion in the Vitreous
The goal of this work was to investigate the impact of increased vitreous mobility on drug dispersion. Hence, we present comparisons between the vitreous sloshing case and the static case. We define
| (15) |
where δ(μ) is the relative difference in value between the sloshing case, when the vitreous viscosity is μ, and static case, expressed as a percentage. For example, δ(μ = 0.1) for drug uptake would correspond to the relative difference in drug uptake between the sloshing case, when the viscosity is 0.1 Pa·s, and the static vitreous case, expressed as a percentage. δ was used in our plots to evaluate the effect of saccade-induced drug dispersion. The results for the case when the vitreous viscosity was 0.001 Pa·s are not discussed in this section, as the computational method was not able to predict drug mixing accurately.
Drug Dispersion for the Transscleral Source
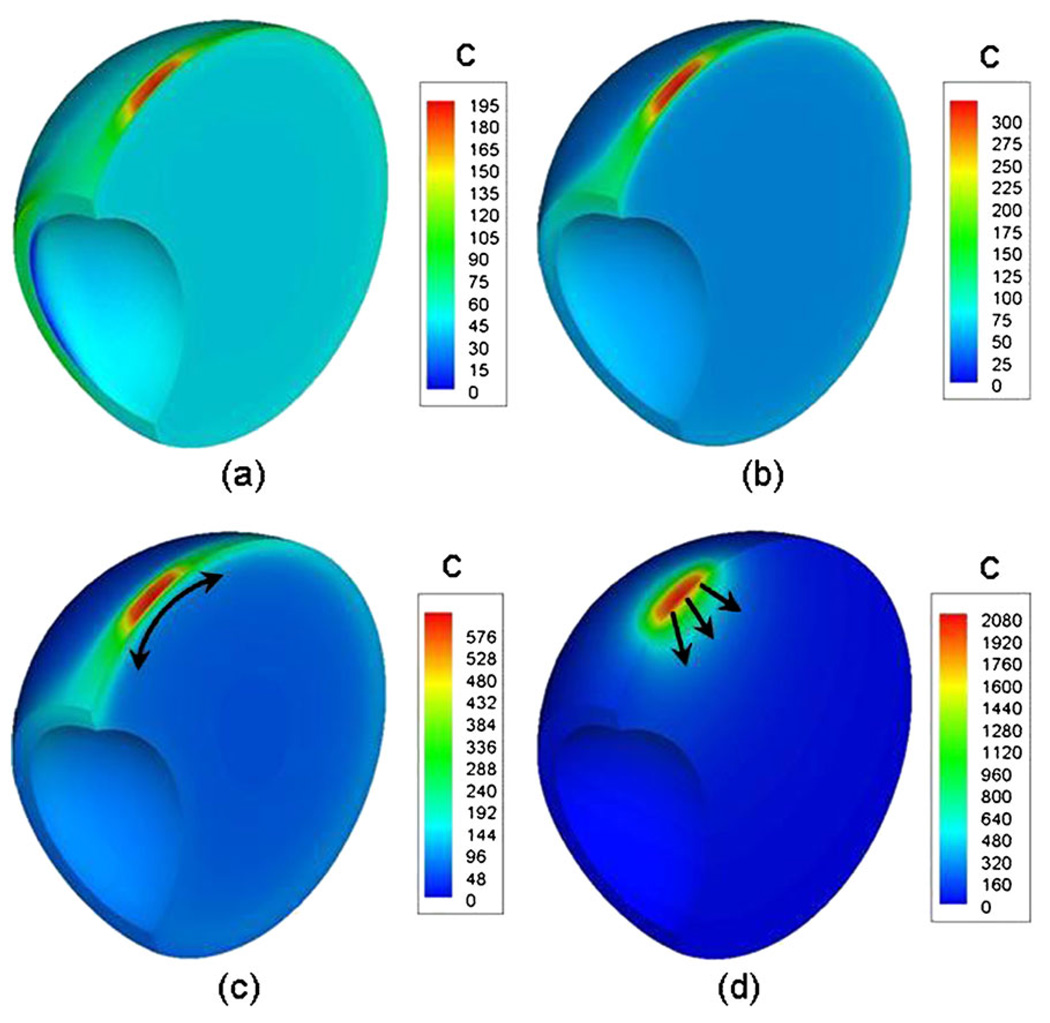
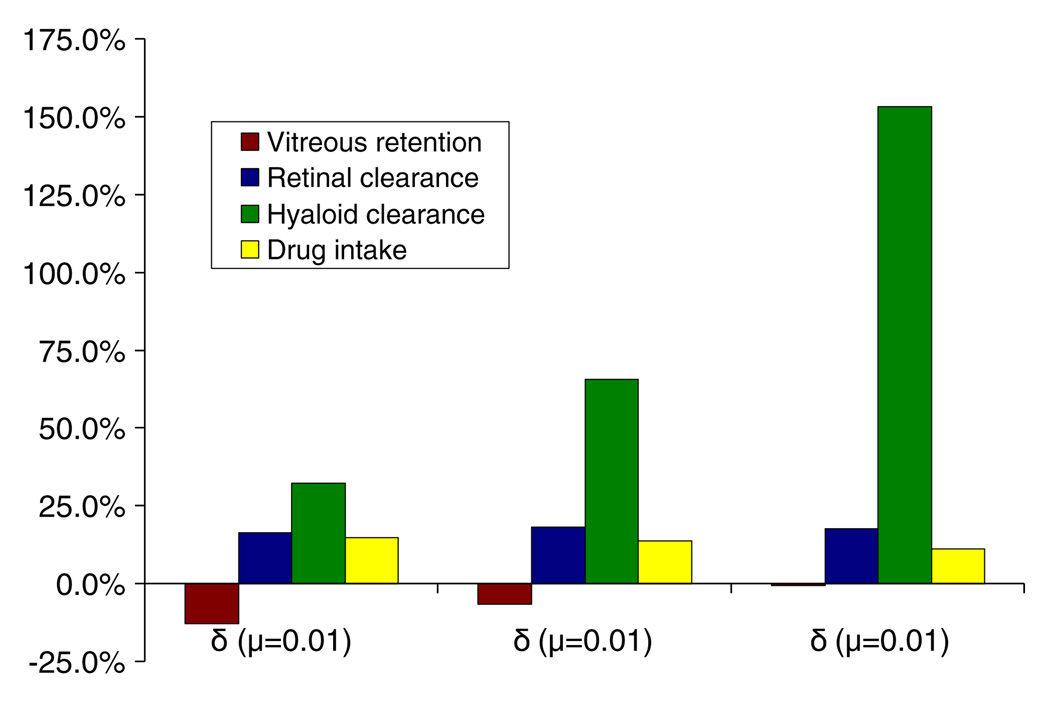
Fig. 7 shows the concentration plots for the sloshing cases and the static case, 48 h after transscleral drug administration. Fig. 7a–c correspond to the sloshing case with vitreous viscosities of 0.01, 0.1, and 1.0 Pa·s, respectively, and Fig. 7d corresponds to the static vitreous. Since the species balance equation is a linear equation in concentration (c), arbitrary source strength of 1 × 10⁴ was picked for the simulations. Hence, the plots in Fig. 7 are for comparative purposes only. In all cases, the system reached steady state within 48 h. The peak concentrations, which were observed directly under the drug source, increased with increasing viscosities. The maximum peak concentration was observed for the static case. Also, steep concentration gradients were observed for the static vitreous, and more uniform spreading was observed for the sloshing vitreous. The uniformity increased with decrease in viscosity for the sloshing cases. This suggests that the degree of mixing is high at low viscosities and decreases with increasing viscosity. With increasing viscosity, the vitreous is expected to behave more as a rigid body; hence, the static vitreous can be construed as a limiting case in which the vitreous viscosity is infinity. The difference in the degree of mixing for the different cases can be gauged from the time scale for drug transport. Table I list the time for the average vitreous concentration to reach 95% of its steady state value for all the cases. Variation by a factor of 1.5 in the time values between the μ = 0.01 Pa·s case and the μ = 1.0 Pa·s case/static vitreous is indicative of the difference in the extent of mixing induced by the saccade oscillations. Fig. 8 shows the impact of sloshing on retinal clearance, hyaloid clearance, vitreous retention, and drug uptake. These four factors along with the concentration at the macula could influence the dosing strategies and the overall efficacy of the drug delivery system.
Fig. 7.
Concentration contour plots for the sloshing cases and the static case 48 h after transscleral drug administration. (a), (b), (c) correspond to the sloshing cases with viscosities μ = 0.01, 0.1, and 1.0, respectively. (d) corresponds to the static vitreous. Source concentration for the simulation was 1 × 10⁴.
Table I.
Time to Attain 95% of the Steady-State Concentration After Transscleral Drug Administration with a Constant Concentration Source
| Condition of the vitreous | Time (hours) | |
|---|---|---|
| Sloshing vitreous | μ = 0.01 | 18.1 |
| μ = 0.1 | 20.8 | |
| μ = 1.0 | 27.7 | |
| Static vitreous | 27.9 |
Fig. 8.
Impact of sloshing on retinal clearance, hyaloid clearance, vitreous retention and drug uptake calculated relative to the static vitreous case for the transscleral source.
Drug transport in the sloshing vitreous, when compared to the static vitreous, resulted in an increase in the amount of drug lost through the retina and the hyaloid. Even though the peak concentration at the retina was high for the static vitreous, it was highly localized near the drug source. In contrast, sloshing resulted in a more uniform drug distribution, thus making available a large portion of drug at the retina and hyaloid for clearance. Sloshing affected hyaloid clearance the most. The maximum increase was when the viscosity was 1.0 Pa·s. The flow mixing pattern coupled with the proximity of the drug source to the anterior eye was deemed to be responsible for the effect. Flow under the drug source results in spreading along the wall in the tangential direction, as opposed to radial transport for the static vitreous (see Fig. 7 c and d). Owing to the proximity of the drug source to the anterior eye, this type of spreading results in high concentrations at the hyaloid. The thickness of the fluid domain that experiences that influence of the eye wall motion increases with viscosity. Hence, we observe the effect to be more significant for the higher viscosity cases. Also, as the viscosity increases, the magnitude of the z-velocity component, which was found to be maximum near the hyaloid, was observed to decrease (see Fig. 6). The fluid flow in the z-direction could be responsible to drug spreading in the bulk of the domain. Hence, the absence of a significant z-velocity component contributes to drug accumulation at the hyaloid and increased clearance through the hyaloid when μ = 1.0 Pa·s.
Fluid flow washed away any drug accumulation under the source, resulting in increased drug uptake by the sloshing vitreous when compared to the static vitreous. This effect, however, was outweighed by the increased clearance from the eye, resulting in lower vitreous concentrations. The difference in drug uptake among the sloshing cases, though, was found to be very minimal. A slight drop in drug uptake was observed with increase in viscosity with the maximum difference between the μ = 0.01 Pa·s case and μ = 1.0 Pa·s case being around 3%. For the low viscosity cases, the fluid flow caused spreading in the bulk of the domain, resulting in the increased uptake. With the retinal clearance only varying slightly for the sloshing cases, average intravitreal drug concentrations were determined by the loss of drug to the anterior eye. The steady-state vitreous concentrations decreased with increasing viscosity as the drug lost to the anterior chamber increased.
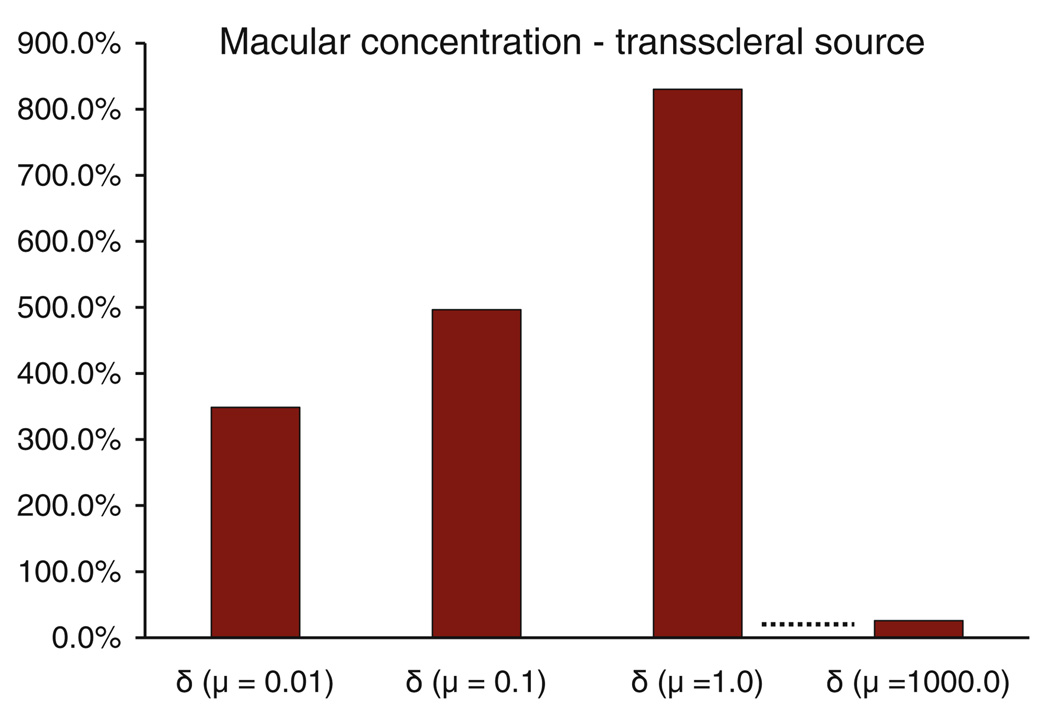
Macular concentrations were observed to be up to 850% higher for the sloshing vitreous when compared to the static vitreous (Fig. 9). Macular concentrations were also found to be significantly different from each other for the vitreous viscosities considered in the model with the value increasing with increasing viscosity for the range considered. This trend was not expected to continue, as increasing the viscosity up to infinity would simulate transport in the static vitreous. We ran a case at μ = 1000.0 Pa·s and confirmed our premise.
Fig. 9.
Impact of sloshing on the macular concentrations calculated relative to the static vitreous case for the transscleral source.
Drug Dispersion for the Intravitreal Source
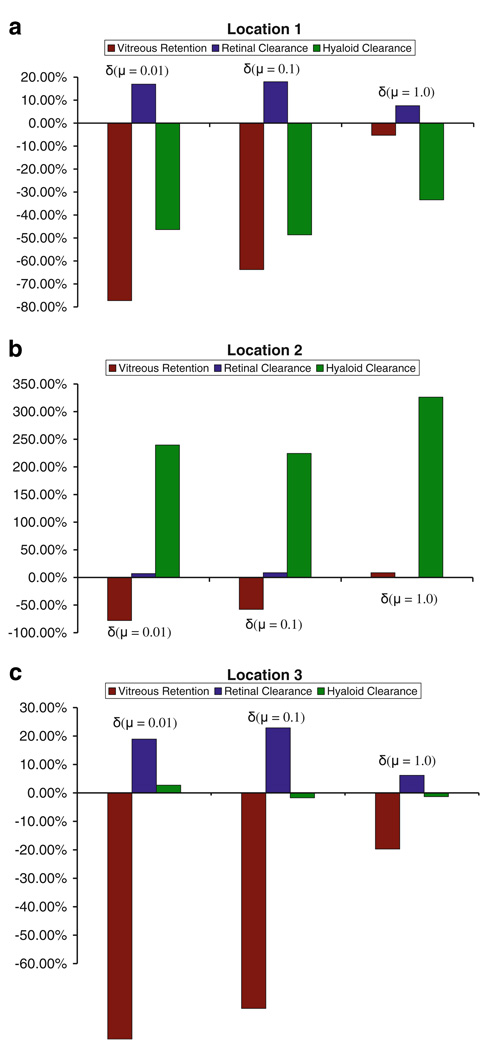
Fig. 10a–c show the impact of saccade-induced dispersion on vitreous concentration, retinal clearance, and hyaloid clearance for the point source at three different locations indicated in Fig. 2. The plots show results after ~13 h of simulation. Vitreous levels for the sloshing vitreous, for all three locations, were found to be lower as drug mixing resulted in easier access to the clearance routes. Although the figures only show the trend at the 13 h time point, the same trend was also observed at intermediate time points, with the exception of a few very early time points. Retinal clearance accounted for nearly 95% of all drug eliminated from the eye and, hence, had the most impact on residual vitreous concentrations. For all three locations, μ = 0.01 and 0.1 Pa·s showed similar results, while μ = 1.0 Pa·s differed significantly. The plots in Fig. 10 illustrate the above-mentioned trend, even though they only show data relative to the static vitreous case. The dynamics of transport within the vitreous for μ = 0.01 and 0.1 Pa·s died down before the first time point (~14 mins), while that for μ = 1.0 Pa·s lasted longer. In essence, the time scale for transport within the vitreous was much smaller than the time scale for drug elimination from the eye.
Fig. 10.
Impact of saccade-induced dispersion on vitreous concentration, retinal clearance, and hyaloid clearance for the point source at three different locations at the 13 h time point. The numbers were relative to that for the static vitreous.
For the point source at location 1, sloshing resulted in a decrease in drug clearance through the hyaloid. This could be attributed to the position of the drug source. At location 1, the drug source is positioned close to the hyaloid, so for the static vitreous, pure diffusion results in significant drug accumulation at the hyaloid. With sloshing, however, most of the drug is distributed into the bulk, resulting in lower concentrations at the hyaloid. The effect was reversed when the drug source was placed at location 2, wherein sloshing resulted in higher drug concentrations at the hyaloid. At location 3, sloshing did not affect clearance through the hyaloid significantly.
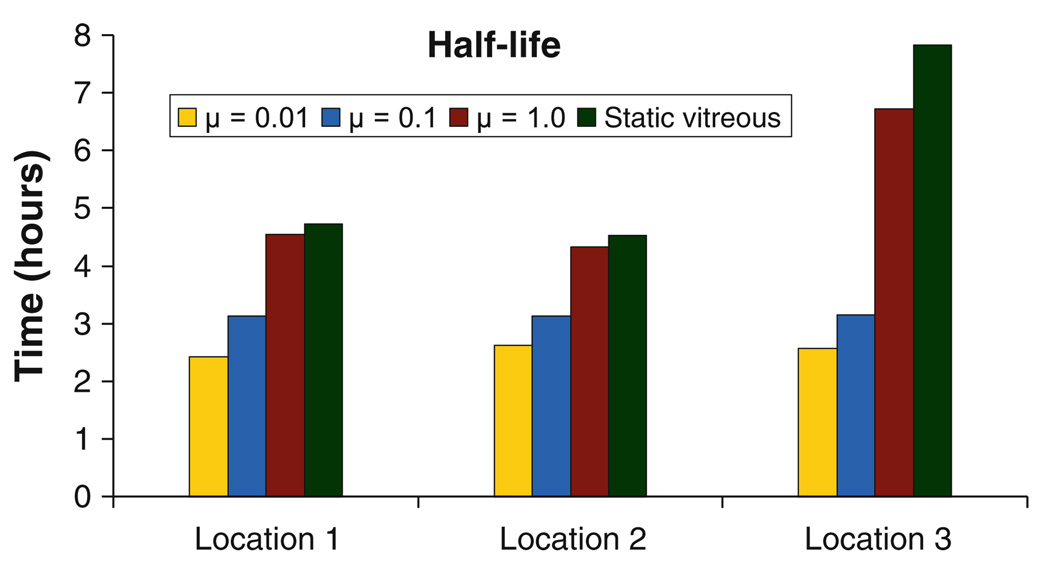
Sloshing-induced dispersion resulted in increased clearance through the retina, when compared to the static vitreous. The increase was only in the 10–25% range, but it altered the half-life of the drug in the vitreous (Fig. 11). For all three locations, retinal clearance was least affected due to sloshing for the highest viscosity case, as the degree of mixing was the lowest for that case. Fig. 11 shows that the half-life does not vary significantly with the location of the point source for the lower viscosities, but for μ = 1.0 and for the static case when the drug source is placed at the center of the eye, lack of sufficient mixing results in a significant increase in the half-life value. Table II summarizes the effect of location on drug distribution for the sloshing cases. As can be observed, for a given viscosity, the location of the point source does not seem to have a significant impact on drug distribution except for μ = 1.0 Pa·s, where a centrally placed injection differed from an injection placed towards the walls. The numbers suggest that mixing dominated for the lower viscosities, so the location of the point source is immaterial to the overall drug distribution.
Fig. 11.
Half-life of the drug after intravitreal administration at the three locations for the sloshing and the static vitreous.
Table II.
Summary of the Effect of Location on Drug Distribution for the Sloshing Cases. Data Shown for Locations 2 and 3 Were Normalized with That for Location 1 for Each Viscosity to Help Compare the Effect
| μ = 0.01 Pa.s | μ = 0.1 Pa.s | μ = 1.0 Pa.s | |||||||
|---|---|---|---|---|---|---|---|---|---|
| Location 1 | Location 2 | Location 3 | Location 1 | Location 2 | Location 3 | Location 1 | Location 2 | Location 3 | |
| Vitreous retention | 1.00 | 0.89 | 0.85 | 1.00 | 1.02 | 1.00 | 1.00 | 1.00 | 1.27 |
| Retinal clearance | 1.00 | 1.02 | 0.98 | 1.00 | 1.01 | 0.98 | 1.00 | 1.02 | 0.95 |
| Hyaloid clearance | 1.00 | 1.02 | 0.98 | 1.00 | 1.02 | 1.00 | 1.00 | 1.03 | 0.76 |
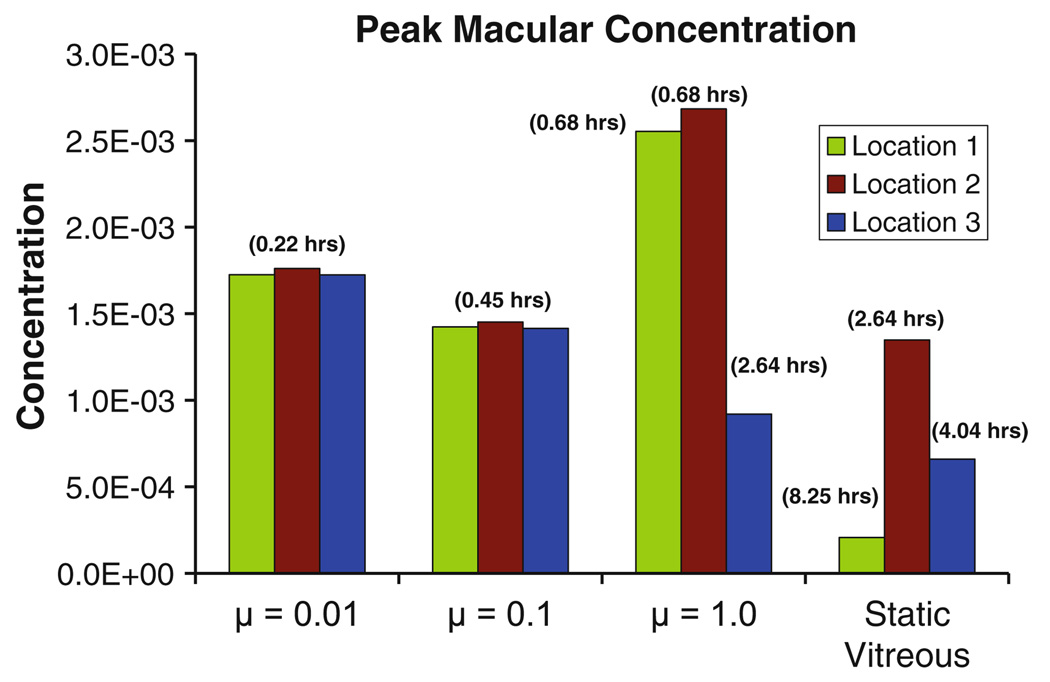
The impact of sloshing on the macular concentrations for the point sources is shown in Fig. 12. The peak macular concentration is plotted, and the time taken to reach the peak concentration is indicated in parentheses. For μ = 0.01 and 0.1 Pa·s, the maximum concentrations were reached at the same time. The similarity in the concentration values adds to the existing evidence that drug distribution for sloshing at the low viscosities is independent of the location of the drug source.
Fig. 12.
Peak macular concentration for the sloshing and the static vitreous for the point source at the three locations. Also listed in parenthesis is the time to attain the peak concentration.
DISCUSSION
Intravitreal and transscleral drug delivery for treatment of posterior segment eye diseases has gained a lot of attention recently. The advantage of intravitreal delivery is that it provides a localized drug depot in the vitreous and, hence, easy access to the posterior eye. Transscleral drug delivery is an attractive option due to the non-invasive nature of the technique. A major portion of the drug delivered through either transscleral or intravitreal route reaches the target tissues by transport through the vitreous. Until recently (23), there has been little attention devoted to understanding the effect the physical state of the vitreous has on intravitreal drug transport. With the presence of a liquid, instead of a gel, in the vitreous chamber, either due to vitreous liquefaction or due to vitrectomy, transport properties could be altered dramatically. To emphasize the significance of the problem, it is noted that most patients with posterior diseases like AMD would have a liquefied vitreous. Although it has been shown that the diffusion properties do not change significantly with liquefaction, advection due to saccade-induced flow in the vitreous chamber could affect the pharmacokinetics of the drug in the eye. With the development of controlled-release delivery systems, capable of delivering drug over long durations so as to prevent frequent interventions, saccade-induced advection effects could play a significant role in determining the mode of treatment and dosing strategies. The computational model we have developed, although not entirely predictive in nature, provides insights into this critical issue.
The model to study the effect of saccade-induced dispersion is an idealized model. Some of the assumptions which make the model deviate from reality are discussed in the next few paragraphs. The model assumes simple sinusoidal saccadic eye rotations. Only continuous, horizontal saccades of fixed amplitude were used. In reality, though, eye rotations are very complex and not necessarily sinusoidal in nature. Also, vertical and horizontal eye rotations of varying amplitudes follow periods of rest, which could potentially alter the flow field in the vitreous. These eye rotations are irregular and dependent on the activity of the person. Irregularity in the amplitude of saccade oscillations could be incorporated into a future model.
The model also assumes that the vitreous chamber is filled with a homogenous Newtonian fluid. The rationale behind the assumption was that the vitreous, due to its high degree of hydration, after liquefaction would be mostly water. The process of liquefaction, however, is complex and in most cases incomplete. Sebag observed thick and tortuous fibers even in a highly degenerate vitreous (3); hence, it is not certain that even a completely liquefied vitreous would exhibit Newtonian behavior. Bettelheim et al. (36) also observed spatial variation in viscosity in a 77-year-old liquid vitreous, thus highlighting the inhomogeneity. Incorporating the inhomogeneity and the non-Newtonian rheology of the vitreous could be challenging to model. Also, experimental measurements have to be made on the rheological properties of liquefied vitreous, so that they can be incorporated to get an accurate model. Given the complexities, however, a Newtonian model can provide key insights and trends on saccade-induced dispersion while maintaining computational tractability.
A detailed model of transport in the posterior tissues, like the retinal pigment epithelium, choroid, and sclera, was not considered. A one-dimensional pseudo-steady-state model was used to evaluate the mass transfer coefficient at the retinal surface. Since the thickness of the posterior tissues is much smaller than the radius of the eye (~ 7%), assuming one-dimensional transport in them is justified. As mentioned before, the time scale for diffusional transport in the static vitreous was evaluated to be ~33 h. For the posterior tissues, using the appropriate length scale for the posterior tissues and a representative diffusivity of 1 × 10⁻⁶ cm2s−1, the time scale for transport was evaluated to be ~1 h. This would imply that transport in the posterior tissues is much faster than diffusive transport in the vitreous; hence, the pseudo-steady-state approximation is deemed to be valid. In the sloshing vitreous, since transport in the vitreous is much faster than transport in the posterior tissues, the use of the steady-state flux underestimates the clearance through the retina, as steep concentration gradients are expected at the retina during the initial time points. Over longer durations of several hours, the transient effects in the posterior tissues are not significant. It is also important to note that transport in posterior tissues is much slower than eye oscillations. Hence, a pseudo-steady-state approach would under-predict the flux value at locations where the concentration at the retinal surface varies significantly within a period of oscillation. A periodic-steady-state approach for the posterior tissues would help overcome this problem, since the average of the concentration is not expected to change significantly from one period to the other.
Apart from the other limitations mentioned above, the model was found to be inaccurate for low viscosities. For μ = 0.001 Pa.s, mass balance errors were found to be as high as 30%, while for the other viscosities considered, the mass balance errors were less than 5%. The error could be due to an inherent lack of robustness in the drug dispersion model when dealing with sloshing for the low viscous cases. The fluid flow field becomes increasingly complex, and the Péclet number increases with decreasing viscosities. Also, post-processing of the model results could contribute significantly to the error if high concentration gradients exist within an element in the vitreous. Such high gradients result in numerical inaccuracies when evaluating fluxes and average concentrations.
Our results suggest that transport of drug when the vitreous is sloshing is vastly different from that in a static vitreous. The time scale for transport reduced from hours to minutes, suggesting rapid loss of drug from the posterior eye. Half-lives for the point sources and the time to attain steady state for the surface source confirm this. The time scales determine the dosing frequency. For invasive procedures, like intravitreal injections, where patient tolerance is low, this becomes doubly important, as frequent interventions have been known to cause retinal tears and hemorrhage. For controlled release systems, the rate of drug release from the source needs to be modulated based on the transport time scales as well to maintain desired drug levels over long durations.
The magnitude of the difference in the local concentrations at the retina and the macula for the different cases discussed could be extremely significant from a clinical perspective. Excessive drug concentrations have been known to cause retinal damage. The increase in macular concentrations, for the transscleral drug source, for the sloshing vitreous was up to 850% when compared to the static vitreous. Significant variation in macular concentrations were also observed when the sloshing cases with varying viscosity and point source locations were compared to their counterparts for the static vitreous. The variations were observed to be more significant for the high viscosity fluids. For the treatment of vitreoretinal infections, the highest possible non-toxic dosage of antibiotics is administered, as the infection can cause blindness (37). Our results suggest that a supposed non-toxic dose could prove to be toxic depending on the state of the vitreous. On the other hand, sloshing also results in distributing the drug throughout the vitreous, thus eliminating highly localized drug concentrations due to diffusive transport. The localized concentrations would render delivery systems ineffective if the target area is away from the drug source. Therefore, sloshing is advantageous, and, as was observed for the point sources, the placement of the drug source becomes less critical. This advantage would, however, not be uniformly available to all the subjects, as the degree of liquefaction might vary.
Care should be taken when interpreting the changes in retinal and hyaloid clearance from the vitreous. The drug lost to the anterior eye not only affects residual vitreous concentrations, but could also result in drug accumulation in the anterior eye. The aqueous humor flow in the anterior eye is expected to wash away any drug leaving the hyaloid, but unintended exposure of, for example, the iris, is a possibility. Also, drug treated in the current model as leaving the retina could be useful in some cases. For example, if the goal were to treat the choroid or the optic nerve head, we should be more concerned about the amount of drug crossing the retina. In this work, the macula was chosen as the target tissue, and the results should be interpreted with care when the target area is different.
In summary, a model was developed describing drug transport in the vitreous when the vitreous sloshes due to saccadic eye movements. The model helps the understanding of the balance in the transport rates for drug in the eye when the vitreous sloshes. The transport rates determine macular concentrations as well as the rate of drug elimination through the hyaloid and retina. Hence, the model could be used to assess efficacy and toxicity for the drug delivery systems. The limitations not withstanding, the model can facilitate the optimization of drug administration techniques for posterior segment eye diseases. In its current state, the model can be used to gauge trends in drug distribution under various conditions. Future developments, like including a realistic saccade sequence, the effect the vitreous substitutes have on drug partitioning and diffusion, and partial liquefaction of the vitreous, could help make the model an extremely useful predictive tool.
ACKNOWLEDGMENTS
This work was supported by the Institute for Engineering and Medicine at the University of Minnesota and by the National Institute for Health (R03 EB007815). Simulations were done with the help of the resources provided by the Minnesota Supercomputing Institute (MSI) at the University of Minnesota.
APPENDIX
A description and the value of the parameters used in the equations in this section are provided in Table III. For more details on the values and description of the parameters, see (31). c2 and c3 in the following equations represent the concentrations in the retina and the choroid-sclera, respectively.
Table III.
Parameters Used for Evaluating Flux at the Retinal Surface
| Symbol | Description | Value |
|---|---|---|
| Dr | Diffusivity of fluorescein in the retina | 3.9 × 10⁻⁷ cm2 s−1 |
| Dcs | Diffusivity of fluorescein in the choroid-sclera | 1 × 10⁻⁶ cm2 s−1 |
| Ka | Parameter used to quantify active transport in the RPE | 3.1 × 10⁻⁵ cm s−1 |
| γ | Rate constant for volumetric drug loss across the choroid | 1.98 × 10⁻⁵ s−1 |
A. Flux of Drug from the Vitreous Out of the Eye
The species balance equations in the posterior tissues are given by Eqs. A1 and A2, and the corresponding solution to the equations are given by Eqs. A3 and A4. The flux in the tissues is given by Eqs. A5 and A6 (Fig. 3).
| (A1) |
| (A2) |
| (A3) |
| (A4) |
| (A5) |
| (A6) |
A1, A2, A3, and A4 are constants, and alpha and beta in the above equations are defined as
| (A7) |
The boundary conditions that were solved simultaneously for A1, A2, A3, and A4, are defined as follows:
value, x = 0, c2|x=0 = cv
value, x = L1, c2|x=L1 = c3|x=L1
flux, x = L1, flux2|x=L1 = flux3|x=L1
flux, x = L2, flux3|x=L2 = kscc3|x=L2
The flux of drug at x = 0 which was used in the model (Eq. 8) was evaluated by substituting the constants into either Eqs. A5 or A6.
B. Flux of Drug from a Constant Concentration Transscleral Source into the Vitreous
The choroid and retina were assumed to be ablated under the transscleral drug source. Hence, the species balance equations for transport in the posterior tissues listed above were modified to accommodate the changes as follows:
| (A8) |
| (A9) |
| (A10) |
| (A11) |
| (A12) |
| (A13) |
As in the previous case, the boundary conditions were solved simultaneously for the constants B1, B2, B3, and B4. The boundary conditions are defined as below:
value, x = 0, c3|x=0 = c0
value, x = L1, c3|x=L1 = c2|x=L1
flux, x = L1, flux3|x=L1 = flux2|x=L1
value, x = L2, c2|x=L2 = cv
The flux of drug at x = L2 was evaluated by substituting the coefficients into either Eq. 19 or 20.
Contributor Information
Ram K. Balachandran, Department of Mechanical Engineering, University of Minnesota Minneapolis, Minnesota, USA
Victor H. Barocas, Department of Biomedical Engineering, University of Minnesota, 7-105 Nils Hasselmo Hall, 312 Church Street SE, Minneapolis, Minnesota 55455, USA, baroc001@umn.edu
REFERENCES
- 1.Lee B, Litt M, Buchsbaum G. Rheology of the vitreous body. Part I: Viscoelasticity of human vitreous. Biorheology. 1992;29:521–533. doi: 10.3233/bir-1992-295-612. [DOI] [PubMed] [Google Scholar]
- 2.Lee B, Litt M, Buchsbaum G. Rheology of the vitreous body: Part 2. Viscoelasticity of bovine and porcine vitreous. Biorheology. 1994;31:327–338. doi: 10.3233/bir-1994-31403. [DOI] [PubMed] [Google Scholar]
- 3.Sebag J. Age-related changes in human vitreous structure. Graefes Arch Clin Exp Ophthalmol. 1987;225:89–93. doi: 10.1007/BF02160337. [DOI] [PubMed] [Google Scholar]
- 4.Soman N, Banerjee R. Artificial vitreous replacements. Biomed Mater Eng. 2003;13:59–74. [PubMed] [Google Scholar]
- 5.Harocopos GJ, Shui YB, McKinnon M, Holekamp NM, Gordon MO, Beebe DC. Importance of vitreous liquefaction in age-related cataract. Invest Ophthalmol Vis Sci. 2004;45:77–85. doi: 10.1167/iovs.03-0820. [DOI] [PubMed] [Google Scholar]
- 6.Holekamp NM, Shui YB, Beebe DC. Vitrectomy surgery increases oxygen exposure to the lens: a possible mechanism for nuclear cataract formation. Am J Ophthalmol. 2005;139:302–310. doi: 10.1016/j.ajo.2004.09.046. [DOI] [PubMed] [Google Scholar]
- 7.Stefansson E. Ocular oxygenation and the treatment of diabetic retinopathy. Surv Ophthalmol. 2006;51:364–380. doi: 10.1016/j.survophthal.2006.04.005. [DOI] [PubMed] [Google Scholar]
- 8.Chin H, Park T, Moon Y, Oh J. Difference in clearance of intravitreal traimcinolone acetonide between vitrectomized and nonvitrectomized eyes. Retina. 2005;25:556–560. doi: 10.1097/00006982-200507000-00002. [DOI] [PubMed] [Google Scholar]
- 9.Doft BH, Weiskopf J, Nilsson-Ehle I, Wingard LB., Jr Amphotericin clearance in vitrectomized versus nonvitrectomized eyes. Ophthalmology. 1985;92:1601–1605. doi: 10.1016/s0161-6420(85)33838-1. [DOI] [PubMed] [Google Scholar]
- 10.Barton KA, Shui YB, Petrash JM, Beebe DC. Comment on: the Stokes–Einstein equation and the physiological effects of vitreous surgery. Acta Ophthalmol Scand. 2007;85:339–340. doi: 10.1111/j.1600-0420.2007.00902.x. [DOI] [PMC free article] [PubMed] [Google Scholar]
- 11.Walton KA, Meyer CH, Harkrider CJ, Cox TA, Toth CA. Age-related changes in vitreous mobility as measured by video B scan ultrasound. Exp Eye Res. 2002;74:173–180. doi: 10.1006/exer.2001.1136. [DOI] [PubMed] [Google Scholar]
- 12.Geroski DH, Edelhauser HF. Drug delivery for posterior segment eye disease. Invest Ophthalmol Vis Sci. 2000;41:961–964. [PubMed] [Google Scholar]
- 13.Hegazy HM, Kivilcim M, Peyman GA, Unal MH, Liang C, Molinari LC, et al. Evaluation of toxicity of intravitreal ceftazidime, vancomycin, and ganciclovir in a silicone oil-filled eye. Retina. 1999;19:553–557. doi: 10.1097/00006982-199911000-00013. [DOI] [PubMed] [Google Scholar]
- 14.Xu J, Heys JJ, Barocas VH, Randolph TW. Permeability and diffusion in vitreous humor: implications for drug delivery. Pharm Res. 2000;17:664–669. doi: 10.1023/a:1007517912927. [DOI] [PubMed] [Google Scholar]
- 15.Stay MS, Xu J, Randolph TW, Barocas VH. Computer simulation of convective and diffusive transport of controlled-release drugs in the vitreous humor. Pharm Res. 2003;20:96–102. doi: 10.1023/a:1022207026982. [DOI] [PubMed] [Google Scholar]
- 16.Araie M, Maurice DM. The loss of fluorescein, fluorescein glucuronide and fluorescein isothiocyanate dextran from the vitreous by the anterior and retinal pathways. Exp Eye Res. 1991;52:27–39. doi: 10.1016/0014-4835(91)90125-x. [DOI] [PubMed] [Google Scholar]
- 17.Friedrich S, Cheng YL, Saville B. Drug distribution in the vitreous humor of the human eye: the effects of intravitreal injection position and volume. Curr Eye Res. 1997;16:663–669. doi: 10.1076/ceyr.16.7.663.5061. [DOI] [PubMed] [Google Scholar]
- 18.Yoshida A, Ishiko S, Kojima M. Outward permeability of the blood-retinal barrier. Graefes Arch Clin Exp Ophthalmol. 1992;230:78–83. doi: 10.1007/BF00166767. [DOI] [PubMed] [Google Scholar]
- 19.Missel PJ. Hydraulic Flow and Vascular Clearance Influences on Intravitreal Drug Delivery. Pharm Res. 2002;19:1636–1647. doi: 10.1023/a:1020940927675. [DOI] [PubMed] [Google Scholar]
- 20.Repetto R. An analytical model of the dynamics of the liquefied vitreous induced by saccadic eye movements. Meccanica. 2006;41:101–117. [Google Scholar]
- 21.Repetto R, Siggers JH, Stocchino A. Steady streaming within a periodically rotating sphere. J Fluid Mech. 2008;608:71–80. [Google Scholar]
- 22.Repetto R, Stocchino A, Cafferata C. Experimental investigation of vitreous humour motion within a human eye model. Phys Med Biol. 2005;50:4729–4743. doi: 10.1088/0031-9155/50/19/021. [DOI] [PubMed] [Google Scholar]
- 23.Repetto R, Siggers JH, Stocchino A. Mathematical model of flow in the vitreous humor induced by saccadic eye rotations: effect of geometry. Biomech Model Mechanobiol. 2009;9:65–76. doi: 10.1007/s10237-009-0159-0. [DOI] [PubMed] [Google Scholar]
- 24.Stocchino A, Repetto R, Cafferata C. Eye rotation induced dynamics of a Newtonian fluid within the vitreous cavity: the effect of the chamber shape. Phys Med Biol. 2007;52:2021–2034. doi: 10.1088/0031-9155/52/7/016. [DOI] [PubMed] [Google Scholar]
- 25.Balachandran RK. Computational modeling of drug transport in the posterior eye. 2010 [Google Scholar]
- 26.Becker W. The neurobiology of saccadic eye movements. Metrics Rev Oculomot Res. 1989;3:13–67. [PubMed] [Google Scholar]
- 27.David T, Smye S, Dabbs T, James T. A model for the fluid motion of vitreous humour of the human eye during saccadic movement. Phys Med Biol. 1998;43:1385–1400. doi: 10.1088/0031-9155/43/6/001. [DOI] [PubMed] [Google Scholar]
- 28.Amestoy PR, L'Excellent JY. MUMPS MUltifrontal Massively Parallel Solver, Version 2.0. J Phys Condens Matter. 1998;10:7975. [Google Scholar]
- 29.Cunha-Vaz J. The blood-ocular barriers. Surv Ophthalmol. 1979;23:279–296. doi: 10.1016/0039-6257(79)90158-9. [DOI] [PubMed] [Google Scholar]
- 30.Kim H, Robinson MR, Lizak MJ, Tansey G, Lutz RJ, Yuan P, et al. Controlled drug release from an ocular implant: an evaluation using dynamic three-dimensional magnetic resonance imaging. Invest Ophthalmol Vis Sci. 2004;45:2722–2731. doi: 10.1167/iovs.04-0091. [DOI] [PubMed] [Google Scholar]
- 31.Balachandran RK, Barocas VH. Computer Modeling of Drug Delivery to the Posterior Eye: Effect of Active Transport and Loss to Choroidal Blood Flow. Pharm Res. 2008;25:2685–2696. doi: 10.1007/s11095-008-9691-3. [DOI] [PubMed] [Google Scholar]
- 32.Kaiser RJ, Maurice DM. The Diffusion of Fluorescein in the Lens. Exp Eye Res. 1964;3:156–165. doi: 10.1016/s0014-4835(64)80030-0. [DOI] [PubMed] [Google Scholar]
- 33.Brooks AN, Hughes TJR. Streamline upwind/Petrov-Galerkin formulations for convection dominated flows with particular emphasis on the incompressible Navier-Stokes equations. Comput Methods Appl Mech Eng. 1982;32:199–259. [Google Scholar]
- 34.Petzold LR. An efficient numerical method for highly oscillatory ordinary differential equations. SIAM J Numer Anal. 1981;18:455–479. [Google Scholar]
- 35.Gear C, Kevrekidis I. Telescopic projective integrators for stiff differential equations. J Comput Phys. 2003;187:95–109. [Google Scholar]
- 36.Bettelheim FA, Zigler JS. Regional mapping of molecular components of human liquid vitreous by dynamic light scattering. Exp Eye Res. 2004;79:713–718. doi: 10.1016/j.exer.2004.07.011. [DOI] [PubMed] [Google Scholar]
- 37.Baum J. Therapy for ocular bacterial infection. Trans Ophthalmol Soc U K. 1986;105(Pt 1):69–77. [PubMed] [Google Scholar]


