

Abstract
The formation of organized nanocrystals that resemble enamel is crucial for successful enamel remineralization. Calcium, phosphate and fluoride ions and amelogenin are important ingredients for the formation of organized hydroxyapatite (HAP) crystals in vitro. However, the effects of these remineralization agents on the enamel crystal morphology have not been thoroughly studied. The objective of this study was to investigate the effects of fluoride ions, supersaturation degree and amelogenin on the crystal morphology and organization of ex vivo remineralized human enamel. Extracted third molars were sliced thin and acid-etched to provide the enamel surface for immersion in different remineralization solutions. The crystal morphology and mineral phase of the remineralized enamel surface were analyzed by FE-SEM, ATR-FTIR and XRD. The concentration of fluoride and supersaturation degree of hydroxyapatite had significant effects on the crystal morphology and crystal organization, which varied from plate-like loose crystals to rod-like densely packed nanocrystal arrays. Densely packed arrays of fluoridated hydroxyapatite nanorods were observed under the following conditions: σ(HAP) = 10.2±2.0 with fluoride 1.5±0.5 mg/L and amelogenin 40±10 µg/mL, pH 6.8±0.4. A phase diagram summarized the conditions that form dense or loose hydroxyapatite nanocrystal structures. This study provides the basis for the development of novel dental materials for caries management.
Keywords: Supersaturation degree, Enamel-like crystals, Fluoride, Remineralization, Amelogenin
Introduction
Dental enamel is the hardest tissue in vertebrates and is comprised of more than 95 % mineral by weight. Enamel is composed of highly organized nanocrystals of fluoro-substituted carbonated hydroxyapatite (HAP). This structure provides enamel with hardness and resistance to fracture and erosion compared to monolith hydroxyapatite. However, due to the acellular and protein-free composition of mature enamel, after trauma or decay the regeneration of enamel is not observed. Thus, the synthesis of enamel through biomimetics is of great interest to dental clinicians. In the past decades, enamel-mimicking material comprised of hydroxyapatite nanocrystal coatings have been synthesized using different in vitro methods. Biomimetic synthesis 1, 2 was a highly promising approach due to mild and biocompatible synthesis conditions in comparison to other approaches requiring harsh treatments such as a high temperature hydrothermal method3 and a method using a strong acid in a calcium phosphate paste.4, 5, 6
Dental caries originate from the demineralization of dentin, enamel or cementum caused by acid-producing bacteria which alter the dynamic demineralization –remineralization process. When proper methods are used, caries at early stage can be halted and even reversed. Enamel remineralization is a well-accepted concept for controlling coronal caries. Many clinical products including topical fluoride varnish,7 fluoride dentifrice8 and casein phosphopeptide-amorphous calcium phosphate containing paste9, 10 have been developed to improve enamel remineralization. However, there was an irregular morphology and organization of the crystals on eroded enamel after treatment with these remineralization agents. Previous reports on dental enamel remineralization indicated that a high content of spherical calcium fluoride11 and loosely-structured calcium phosphate12 were commonly observed during enamel remineralization.
Amelogenin is an enamel extracellular matrix protein that controls the formation of hierarchical organized minerals.13, 14 Many in vitro studies have shown that amelogenin is a crucial promoter of mineralization and a modulator of calcium phosphate nanocrystal structure.15, 16, 17 The cooperation mechanism of protein assembly and mineralization was first demonstrated by Beniash et al. who reported the alignment of hydroxyapatite crystals in the presence of full-length amelogenin using homogenous nucleation18. Nancollas’ group recently applied constant-composition nucleation to demonstrate the role of amelogenin in the formation of elongated hydroxyapatite crystals at an initial stage of nucleation.19, 20 Fan et al. have recently reported that amelogenin and fluoride are key components for the regrowth of organized apatite nanocrystals on an enamel substratum. Nanocrystals of hydroxyapatite with a diameter of 20 nm formed bundles on an eroded enamel surface in a supersaturated remineralization solution.21, 22
Application of a remineralization microenvironment on enamel, which provides an adequate amount of amelogenin, calcium, phosphate and fluoride for enamel remineralization, can promote the formation of enamel-like structures. Previous studies revealed that the phase formation and morphology of calcium phosphate crystals may be affected by temperature, ionic strength, pH, fluoride and supersaturation degrees.23, 24, 25 The change of solution supersaturation degree and fluoride concentration in mineralization solutions was reported to affect the crystal morphology dramatically.23, 26 The self-assembly of amelogenin shows a strong dependency on pH.27 However, the systematic effects of the above mineralization parameters on the nanocrystal morphology and organization of ex vivo enamel remineralization are not fully understood. These parameters are of great significance for the advances in enamel remineralization technology.
The aim of this study was to investigate how the crystal morphology of the ex vivo remineralized enamel is affected by pH and concentrations of calcium, phosphate, fluoride, and amelogenin. The current study differs from and builds upon previous work performed with a fixed pH and supersaturation degree.21 Our study determines the zones or ranges of pH and supersaturation degree wherein enamel remineralization with densely packed nanorods are observed. The crystal morphology and mineral phase of the remineralized enamel surface were analyzed by FE-SEM, ATR-FTIR and XRD. The microhardness of the remineralized enamel surface was analyzed and correlated with the optimal conditions for formation of dense bundled enamel-like crystals.
Materials and Methods
Amelogenin preparation
Purified recombinant full-length porcine amelogenin (rP172) was prepared as described previously.13, 28. The protein was expressed in Escherichia coli strain BL21-codon plus (DE3-RP, Strategene), purified by ammonium sulfate precipitation and reverse-phase preparative high performance liquid chromatography (Dionex Summit HPLC with Jupiter 250 mm × ϕ21.2 mm, 10 µm C4 column, Phenominex, CA), using a mobile phase 20–60% acetonitrile/water + 0.1% TFA (trifluoroacetic acid) under a flow rate of 10 mL/min. The molecular weight of purified rP172 was confirmed by a mass spectrometer (Bruker Esquire 3000) as 19572 ±1 Da.
Preparation of remineralization solution
All reagents and buffers were purchased from commercial sources (Sigma or Thermo-Fisher). Supersaturated calcium phosphate solutions, Tris (tris(hydroxymethyl)-aminomethane) or HEPES (4-(2-hydroxyethyl)-1-piperazineethanesulfonic acid) buffered at pH 6.5–7.6 were prepared by dissolving CaCl2.2H2O, KH2PO4, NaCl and Tris-HCl or Na-HEPES in distilled deionized water (DDW) to achieve an ionic strength (IS) of 190 mM. In our remineralization buffer solutions, the initial molar ratio of Ca2+ to PO4 ions is 1.67, and for simplicity we only report the Ca concentration in the text. Remineralizing solutions with various pH levels, [Ca2+] and [F−] were prepared and tested as indicated in Table 1. Experiments were performed at least 3 times and similar results were obtained each time.
Table 1.
Crystal morphology in remineralization buffers with variable compositions and σ (37°C).
| Description | 22°C pH |
37°C pH |
[F−] mg/L |
[Ca2+] mM |
[PO4] mM |
σ(OCP) | σ(HAP) | σ(FAP) | Crystals Morphology |
|---|---|---|---|---|---|---|---|---|---|
|
Change [Ca2+] at 1 mg/L [F−] and pH 7.0, Tris |
7.00 | 6.54 | 1.0 | 2.0 | 1.2 | 0.38 | 4.58 | 15.2 | Loose nanoneedle |
| 7.00 | 6.54 | 1.0 | 2.5 | 1.5 | 0.67 | 5.77 | 18.6 | Loose nanoneedle | |
| 7.00 | 6.54 | 1.0 | 2.8 | 1.67 | 0.84 | 6.45 | 20.6 | Loose nanorod | |
| 7.00 | 6.54 | 1.0 | 3.0 | 1.8 | 0.95 | 6.92 | 21.9 | Dense nanorod | |
| 7.00 | 6.54 | 1.0 | 4.0 | 2.4 | 1.48 | 9.12 | 28.3 | Thin plate | |
| 7.00 | 6.54 | 1.0 | 4.5 | 2.69 | 1.73 | 10.2 | 31.3 | Plate | |
| 7.00 | 6.54 | 1.0 | 5.0 | 3.0 | 1.99 | 11.2 | 34.3 | Plate | |
|
Change [F−] at 4mM [Ca2+] and pH 7.2 Tris |
7.20 | 6.74 | 1.0 | 4.0 | 2.4 | 2.02 | 12.3 | 35.7 | Plate |
| 7.20 | 6.74 | 2.0 | 4.0 | 2.4 | 2.02 | 12.3 | 38.6 | Plate | |
| 7.20 | 6.74 | 5.0 | 4.0 | 2.4 | 2.02 | 12.3 | 42.8 | Loose nanoneedle | |
| 7.20 | 6.74 | 10.0 | 4.0 | 2.4 | 2.02 | 12.3 | 46.3 | Large branched nanorod | |
|
Change [F−] at 5mM [Ca2+] and pH 7.2 Tris |
7.20 | 6.74 | 0 | 5.0 | 3.0 | 2.62 | 15.0 | --- | Plate |
| 7.20 | 6.74 | 1.0 | 5.0 | 3.0 | 2.62 | 15.0 | 43.1 | Plate | |
| 7.20 | 6.74 | 2.0 | 5.0 | 3.0 | 2.62 | 15.0 | 46.7 | Plate | |
| 7.20 | 6.74 | 5.0 | 5.0 | 3.0 | 2.62 | 15.0 | 51.8 | Plate and nanorod | |
| 7.20 | 6.74 | 10 | 5.0 | 3.0 | 2.62 | 15.0 | 56.0 | Large nanorod | |
|
Change pH at 0 F and 2.8 mM [Ca2+], HEPES |
6.50 | 6.30 | 0 | 2.8 | 1.67 | 0.42 | 4.21 | --- | No crystal growth |
| 7.00 | 6.80 | 0 | 2.8 | 1.67 | 1.37 | 9.65 | --- | Thin plate | |
| 7.20 | 7.00 | 0 | 2.8 | 1.67 | 1.82 | 12.8 | --- | Plate | |
|
Change pH at 1 mg/L [F−] and 2.8 mM [Ca2+] HEPES |
6.50 | 6.30 | 1.0 | 2.8 | 1.67 | 0.42 | 4.21 | 12.1 | Loose nanoneedle |
| 7.00 | 6.80 | 1.0 | 2.8 | 1.67 | 1.37 | 9.65 | 27.9 | Loose nanoneedle | |
| 7.20 | 7.00 | 1.0 | 2.8 | 1.67 | 1.82 | 12.8 | 34.4 | Nanorod | |
|
Other conditions in Tris |
7.47 | 7.00 | 2.0 | 2.5 | 1.5 | 1.57 | 11.5 | 33.9 | Dense nanorod |
| 7.00 | 6.54 | 2.0 | 4.0 | 2.4 | 1.48 | 9.12 | 30.6 | Dense nanorod | |
| 7.00 | 6.54 | 0.1 | 2.0 | 1.2 | 0.38 | 4.58 | 11.5 | Nanoneedle | |
| 7.00 | 6.54 | 0.01 | 2.0 | 1.2 | 0.38 | 4.58 | 8.69 | No crystals | |
| 7.00 | 6.54 | 0.05 | 2.5 | 1.5 | 0.67 | 5.77 | 13.1 | Plate | |
| 7.00 | 6.54 | 0.01 | 3.0 | 1.8 | 0.95 | 6.92 | 12.7 | Plate | |
The relative supersaturation degree of octacalcium phosphate [Ca8H2(PO4)6·5H2O] (OCP) hydroxyapatite [Ca10(PO4)6(OH)2] and fluoroapatite [Ca10(PO4)6F2] (FAP) were calculated using previously described methods.24 The definition of relative supersaturation degree (σ) of hydroxyapatite is:
where the ion activity coefficient (γ) was calculated from the total ion strength by the extended Debye-Huckel equation.24 Table 1 lists the composition of different remineralization solutions. To calculate the buffer pH at 37°C, the temperature coefficients, −0.031 ΔpH/°C for Tris-HCl buffer and −0.014 ΔpH/°C for HEPES buffer29 were used to adjust the pH from room temperature (22±2°C) to 37°C. The relative supersaturation degrees at 37°C were from 4.21 to 15.0 for HAP, from 0 to 56.0 for FAP, and from 0.42 to 2.62 for OCP in this study.
The selection of pH is based on the physiological range of pH from 6.3 to 7.2 and in this pH range amelogenin is soluble. Amelogenin rP172 has a theoretical isoelectric point of 6.8 (by ExPASy Proteomics Server). Recombinant full-length amelogenin reportedly forms nanospheres at pH 6.5–7.4.13, 27 The range of amelogenin concentrations was selected according to previous publications21 and the known solubility of amleogenin of 30 µg/mL at 25°C pH 6.5.
Mineralization of eroded enamel
Extracted human third molars (randomly selected from a tooth bank from unidentified donors at the School of Dentistry, Louisiana State University Health Science Center, approved by Intuitional Review Board) were sliced thin and acid etched to provide ex vivo enamel surface. Teeth were cut longitudinally to a thickness of 0.4 mm-thick slices using a water-cooled diamond blade on a section machine (Accutom 50, Struers, Denmark). The slices were stored at 4°C in PBS. Before remineralization, the slices were etched in 5% HNO3 for 30 seconds and rinsed in de-ionized water. The slices were immersed in a 12 mL freshly prepared remineralization solution containing 50 mM Tris or 20 mM HEPES buffer (pH 6.30–7.20); amelogenin rP172 (30–70 µg/mL21) and fluoride (0.001–10 mg/L) and then incubated at 37°C. The samples were removed at the indicated times and rinsed with de-ionized water, air-dried, and then analyzed as described below.
Characterization of remineralized enamel
The remineralized enamel surfaces were analyzed by Field Emission - Scanning Electron Microscope (FE-SEM, LEO 1530 VP). The specimens were coated with carbon using a Carbon coater 208C (Cressington Scientific Instruments, Watford, UK). The crystal sizes in the digital SEM images were measured using Photoshop (n>15).
Attenuated total reflection-Fourier transformed Infrared (ATR-FTIR) spectra were acquired with Nexus 670 FT-IR spectrometer (Thermo-Nicolet, Madison WI) equipped with a Vision Gladi diamond ATR (Pike Technology, Madison WI). The enamel samples were pressed on the diamond crystal and testing locations were confirmed by a live video monitoring beneath the diamond crystal. The samples were scanned for 128 times at 4 cm−1 resolution from 4000 cm−1 to 400 cm−1.
The X-ray diffraction (XRD) spectrum was acquired on a Scintag XDS 2000 diffractometer from 2θ = 2–60 degree at a scan rate of 0.60 °/min. X-ray source of Cu Kα1 0.154 nm radiation was generated at −43 kV and 38 mA. The X-ray beam was carefully aligned on the enamel region of the tooth sample through a 0.3 mm receiving lead slit. The samples for XRD analysis were freshly prepared to prevent hydrolysis of octacalcium phosphate.
Surface hardness on remineralized enamel
Third molars (12 total) were embedded in epoxy resin, polished with a series of 600-grit and 1200-grit SiC papers and 1 and 0.05 micron alumina slurry to expose flat occlusal enamel. Then the teeth were demineralized for 3 days at 37°C in lactic acid solution (0.1M pH 4.5) supplemented with 3 mM CaCl2, 3 mM KH2PO4 and 0.2% guar gum. The etched teeth were randomly divided into three groups (n=4 per group) and immersed in three different remineralization solutions for 24 hours. The Knoop hardness number (KHN) on enamel surface before and after remineralization was measured using a Microhardness Tester (MicroMet 5400, Buhler, Lake Bluff, IL) under 25 g force and 15 s dwell time. For each sample, seven indentation measurements were randomly taken. Analysis of variance (ANOVA) with post-hoc analysis done via Tukey’s Honestly Significant Differences test was used to compare the mean change in KHN after remineralization and among different groups.
Results
We were interested in determining the working concentrations of [F−], [Ca2+] and pH that support growth of dense nanocrystals on enamel. To address this question, we prepared a series of remineralization buffers containing variable concentrations of [F−], [Ca2+] and pH. To perform the experiments systematically, remineralization buffers were designed such that the concentration of two factors was kept constant while the third was variable.
Effects of calcium and fluoride concentrations on the remineralized crystal morphology
The increase in [Ca2+] from 2.8 mM to 5 mM resulted in an increase in crystal sizes and a change in morphology from rod-like to plate-like. At a pH of 6.54, a [F−] of 1 mg/L and a [Ca2+] of 2.8 mM, nanorod crystals with diameters of 34 ± 3 nm and an aspect ratio of 10 were detected (Fig. 1a). Nanoneedle crystals with a large aspect ratio (>30) were observed at a [Ca2+] of 3.0 mM (Fig. 1b). Increasing the [Ca2+] to 4.0 mM yielded thin plate-like crystals with a thickness of 27±6 nm (Fig. 1c). Crystals with a thickness of 164±50 nm were detected at a [Ca2+] of 4.5 mM (Fig. 1d).
Fig. 1.
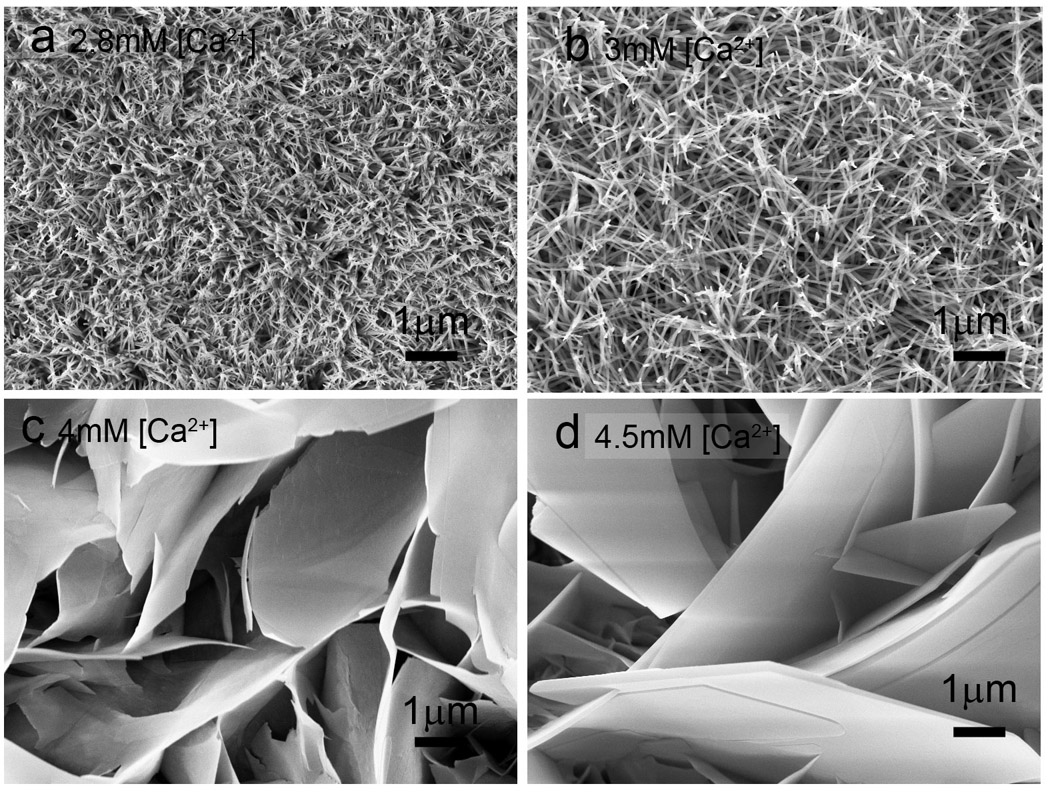
Effects of calcium concentration on crystal morphology. Crystals were grown on acid-etched enamel for 24 hours in Tris buffered remineralization solution (pH 6.54 at 37°C) in the presence of [F−] at 1 mg/L and variable [Ca2+] of (a) 2.8 mM (b) 3 mM (c) 4 mM and (d) 4.5 mM.
The effects of [F−] on the crystal organization were assayed by the addition of low to high [F−] from 1 µg/L to 10 mg/L in remineralization solutions with a pH of 6.74 and a [Ca2+] of 5 mM. With increasing [F−], the remineralized crystal morphology changed from plate-like crystals of a few micrometers in width to nanorod crystals with diameters of 20–50 nm. The crystals were plate-like without F (Fig. 2a) or up to 1 mg/L [F−]. With intermediate [F−] at 2 mg/L, both plate-like and rod-like morphologies were observed (Fig. 2b). The morphology was predominantly rod-like with diameters of 32±10 nm with a [F−] of 5 mg/L, but the crystals were loosely organized (Fig. 2c). Large and branched rod-like crystals with diameters of 90±15 nm were observed with a [F−] of 10 mg/L (Fig. 2d). Therefore, there is a critical [F−] at 5 mg/L required to induce the transition from plate-like OCP to rod-like HAP.
Fig. 2.
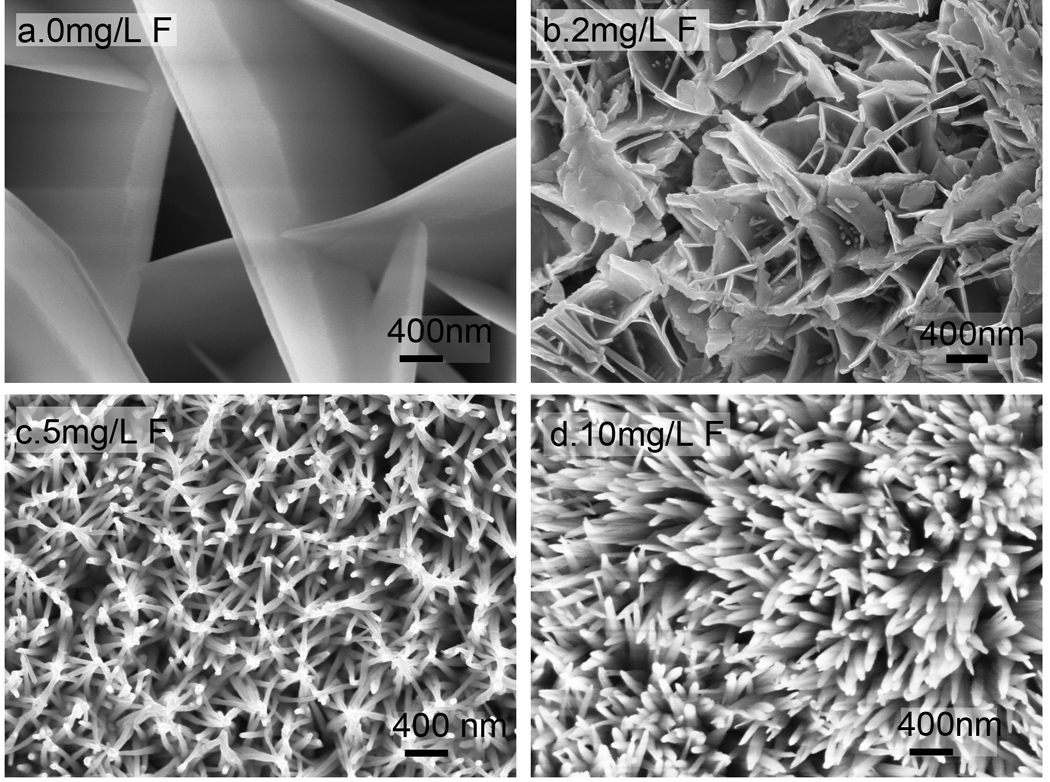
Effects of fluoride concentration on crystal morphology. Crystals were grown on acid-etched enamel for 24 hours in Tris buffered remineralization solution (pH= 6.74 at 37°C) with high σ (HAP)=15.0 and a variable [F−] of (a) 0 (b) 2 mg/L, (c) 5 mg/L, and (d) 10 mg/L.
Effects of pH on the remineralized crystal morphology
The effects of pH on crystal growth and morphology were assayed for pH values ranging from 6.30 to 7.00 in remineralization buffers containing a constant level of [Ca2+] of 2.8 mM and HEPES 20 mM. The crystal growth was assayed using FE-SEM (Fig. 3). There was no detectable remineralization or crystal growth observed at pH 6.30 (Fig. 3-a1). However, at pH 6.80 (Fig. 3-b1) and 7.00 (Fig. 3-c1) large plate-like crystals with widths of 5–10 µm and a porous 3D microstructure were observed. The thickness of these plate-like crystals increased with a higher pH. At a pH of 6.80 a thickness of 57±8 nm was observed, By contrast, at a pH of 7.00 the thickness was 142 ± 51 nm (Fig. 3-b1 and c1). These plate-like crystals grew without preferential orientation. Interestingly, the [F−] significantly affected the crystal morphology in both low and high pH remineralization buffers. At a [F−] of 1 mg/L and a pH of 6.30, the crystals were loose nanorods with a diameter of 51 ± 8 nm and an aspect ratio over 15 in the HAP (002) direction (Fig. 3-a2); however, at 6.80 and higher pH, the crystals transitioned to dense nanorod structures with an orientation along HAP (002) (Fig. 3-b2 and c2). Changing the pH from 6.30 to 7.00 significantly altered the crystal morphologies of the enamel coating.
Fig. 3.
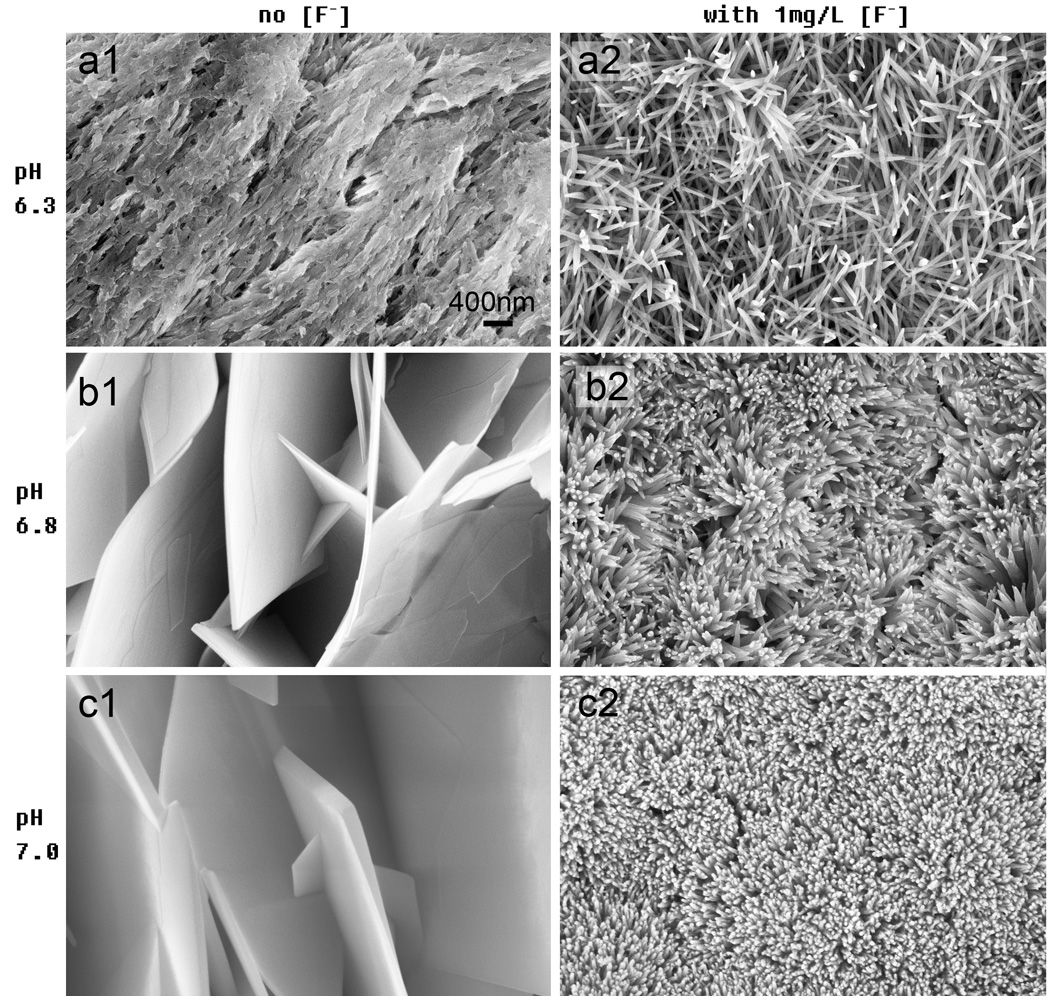
Effects of pH on crystal morphology. Crystals were grown on acid-etched enamel for 24 hours at 37°C in HEPES buffered remineralization solution with a [Ca2+] of 2.8 mM and a [PO43−] of 1.67 mM at a variable pH of (a) 6.30, (b) 6.80, (c) 7.00. The solution contained no [F−] (a1, b1, c1) and 1 mg/L [F−] (a2, b2, c2), respectively. The images are 50,000× magnifications.
Effects of superstaturation and fluoride concentration on the morphology of the remineralized crystals
Our observations indicate that the effective critical [F−] is dependent on both pH and [Ca2+] in the remineralization buffers. For example, a [F−] of 5 mg/L is the critical concentration when the [Ca2+] is 5 mM and the pH is 6.74 (Fig. 2c). However, at low [Ca2+] 2–3 mM and pH 6.54, [F−] at 1 mg/L is sufficient to promote rod-like crystals (Fig. 3-b3). Thus at lower [Ca2+] (<3 mM), the critical concentration of [F−] is below 1 mg/L. The relative supersaturation degrees (σ) of HAP and FAP in various remineralization solutions was calculated and listed in Table 1 taking into consideration the pH, ionic strength, and calcium and phosphate ion concentrations. Analysis of crystal growth in a series of remineralization solutions with a range of [F−] from 0 to 10 mg/L and constant σ, revealed that [F−] dramatically influenced the crystal morphology. Remineralization solutions with [F−] higher than 10 mg/L were unstable and precipitates are detectable within a few hours of preparation. As a result, remineralization effects were not studied for [F−] above 10 mg/L.
A plot of [F−] vs. σ is given in Fig. 4, in which 5 different regions are partitioned based on the different crystal morphologies formed in Tris-buffered solution. The boundary lines between regions correspond to the critical [F−] to form a plate-like mixture of OCP-HAP or rod-like HAP crystals. Region 0 contains no detectable crystal nucleation or growth on enamel after 24 hours at low supersaturation. An example of this phase is shown in Fig. 3-a1. Region 1 contains plate-like crystals formed at high σ (>4.2) and low [F−] <0.5 mg/L. Crystals in Fig. 3-b1 and c1 reside in this region. Region 2, 3 and 4 all contain rod-like nanocrystals with different organizations in the different regions. In region 2 the crystals are loosely packed nanorods or nanoneedles. SEM of nanoneedles with a large aspect ratio is shown in Fig.3-a2 and Fig. 1b. In region 3 the crystals are dense nanorods and their SEM images are shown in Fig. 3-c2. Hyperbranched and large rod-like crystals (SEM, Fig. 2d) that form with [F−] at 5 mg/L and σ >12 reside in region 4. It should be noted that the boundaries between region 2, 3 and 4 are postulated and have not been experimentally determined for each point along the lines. Mixtures of plate-like crystals and nanorod crystals may form with a buffer composition at the boundary between region 1 and 3 or 4. The remineralization buffers containing 20mM HEPES had a 50% lower critical [F−] to form rod-like crystals compared to 50mM Tris-HCl.
Fig. 4.
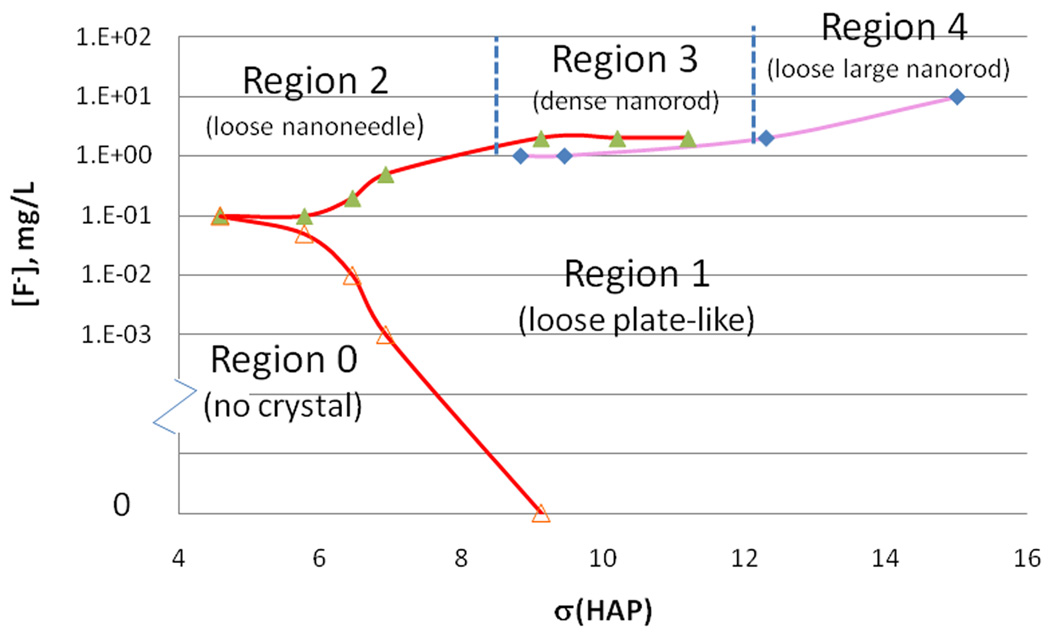
Phase diagram of different crystal morphologies in the remineralization buffers. The x-axis is the σ with regard to HAP; the y-axis is the [F−]. The critical [F−] are indicated as the red line (pH 6.54 at 37°C) and the purple line (pH=6.74 at 37°C). The triangle and square symbols are experimental data. Based on the different crystal morphologies, five regions are partitioned.
Effect of amelogenin on crystal morphology
During tooth development, amelogenin is an important regulator of enamel deposition and integrity in vivo. After constructing the phase diagram in Fig. 4, we were interested in determining whether amelogenin preferentially controls growth of dense nanocrystals within a particular region of the phase diagram or whether amelogenin can induce dense nanorods in all regions. To investigate this we tested the effect of amelogenin on the crystal morphologies of remineralized enamel from different regions of the phase diagram. The addition of amelogenin at 30–50 µg/mL at the boundary of Region 1 and Region 4 induced a transition of the straight plate-like crystals (Fig. 2b) to curved plates and rod-like crystals (Fig. 5a). The inclusion of amelogenin in Region 2 with a [Ca2+] of 2.8 mM at a pH of 6.30 caused the formation of mesh-like nanorod crystal bundles (Fig. 5b) that in the absence of amelogenin are plate-like. End-fused bundles with a loose structure were seen at higher σ in pH 6.80 solution (Fig. 5c). With the addition of amelogenin, coatings derived from conditions in Region 3 yielded the highest packing density of nanorod crystals (Fig. 5d and Fig. 5e). In Region 4, however, amelogenin promoted the formation of large branched loose-structured nanorods with diameters of 80–100 nm in remineralization solution with [Ca2+] of 5 mM and [F−] of 10 mg/L from Region 4 (Fig. 5f). We conclude that in Region 3 amelogenin significantly promotes the formation of densely-packed nanorod crystals.
Fig. 5.
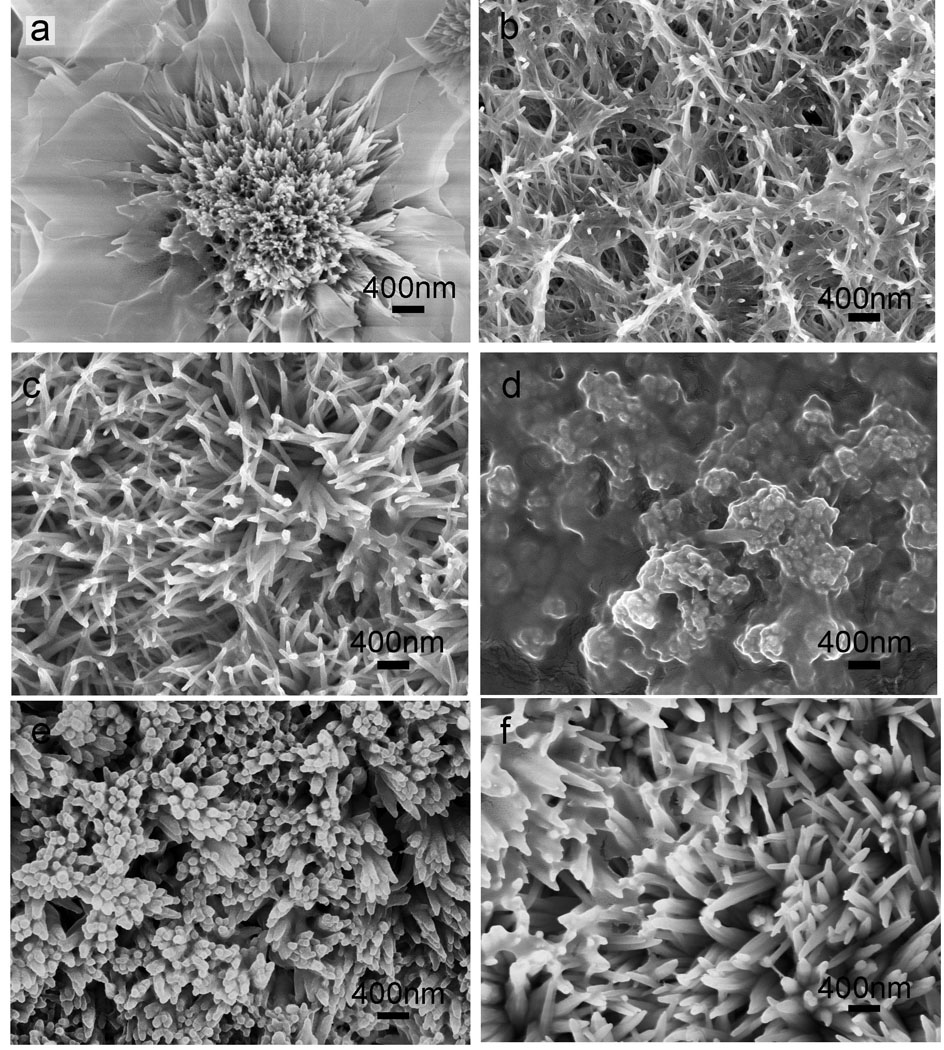
Effects of amelogenin on crystal morphology. Amelogenin at 30 µg/mL was added to remineralization solutions from different regions of Figure 4. (a) curved plate-like crystals with rod-like crystals formed at the boundary between Region 1 and 4 ([F−]=2 mg/L, [Ca2+]=5 mM, Tris buffered solution pH 6.74, σ(HAP)=15.0); (b) bundled nanorod mesh in Region 2 ([F−]=1 mg/L, [Ca2+]=2.8 mM, HEPES buffered solution pH 6.30, σ(HAP)=4.21); (c) end-fused loose nanorod crystals in Region 2 ([F−]=1 mg/L, [Ca2+]=2.8 mM, HEPES buffered solution pH 6.80, σ(HAP)= 9.65); (d) densely packed crystal bundles in Region 3 ([F−]=1 mg/L, [Ca2+]=2.8 mM, HEPES buffered solution pH 7.00, σ(HAP)=12.8); (e) densely packed crystal arrays in region 3 ([F−]=2 mg/L, [Ca2+]=4 mM, Tris buffered solution pH 6.74, σ(HAP)=12.3); (f) large nanorods and hyperbranched nanorod crystals in region 4 ([F−]=10 mg/L, [Ca2+]=5 mM, Tris buffered solution pH 6.74, σ(HAP)=15.0). These experiments were performed at least three times (n≥3).
FTIR and XRD analysis on mineralized coatings
Early mineral deposition was examined to understand the initial process of ex vivo remineralization in the presence of amelogenin (Fig 6a–c). The ATR-FTIR spectrum was analyzed to reveal the features of the hybrid composite as well as the phases of calcium phosphate (Fig 6d). Within 2 hours, short rod-like nanocrystals with diameters of 116±24 nm and length of 300–400 nm formed over the enamel surface (Fig. 6a). Each nanorod contained stacks of globules with diameters of 80±5 nm. The HPO4 υ1 band (1020 cm−1) and υ4 band (600 and 554 cm−1) indicated the formation of hydroxyapatite. Protein amide I, II, and III bands (1650, 1453, 1256 cm−1) indicated the presence of amelogenin (Fig. 6d, curve b). After 2 hours, the nanorods increased in length (> 1µm) and had diameters of 85±16 nm. Crystal bundles first appeared at 4 hours and then nanorods transitioned to a densely packed structure after 12 hours (Fig. 6b). FT-IR spectra showed that the ratio of phosphate to protein increased from 2 to 12 hours (Fig. 6d, curve c and d). After 72 hours, the newly formed top layer of the coating changed to plate-like crystals (Fig. 6c), due to a change in the composition of the solution. By 72 hours the fluoride concentration decreased to less than 10% of the starting concentration. Thus, the composition of the solution shifted from Region 3 to Region 1. In FT-IR spectrum, the protein amide I band (1648 cm−1) was prominent at 12 hrs and phosphate bands (1021, 600 and 554 cm−1) became sharper than those at 2 hrs, indicating higher crystallinity and less protein content at 12 hrs (curve d in Fig 6d). The broadening of the υ4 band at 554 cm−1 and the υ3 band at 1021 cm−1 may be due to fluoridation of the HAP lattice30.
Fig. 6.
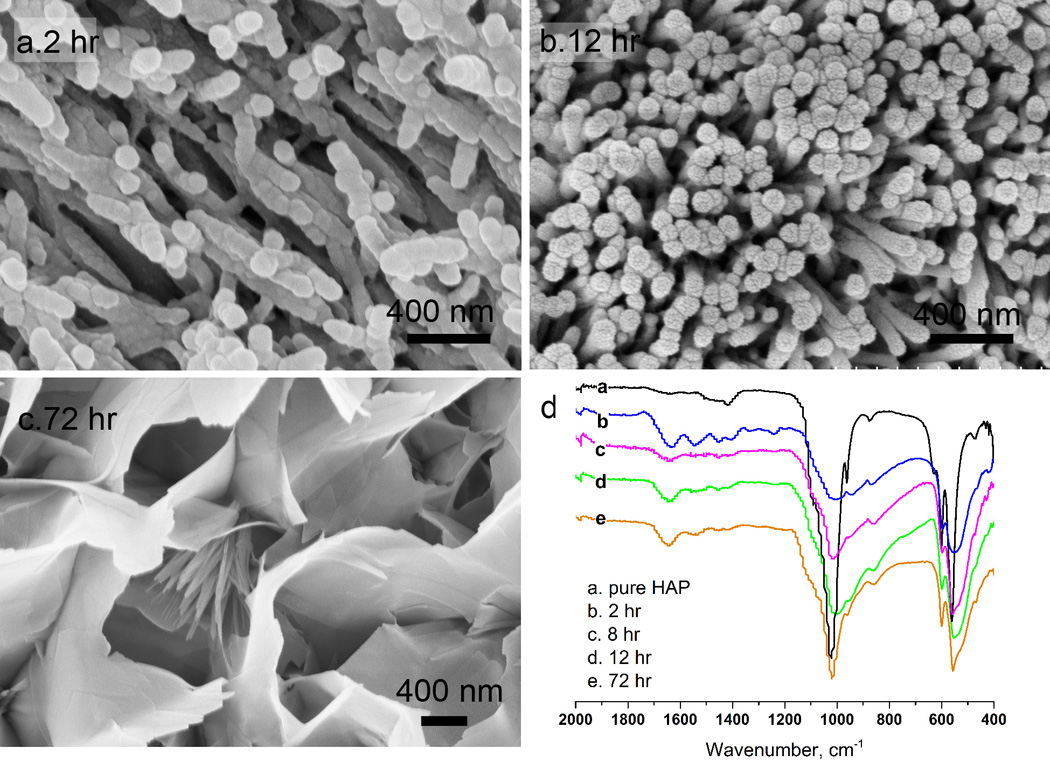
The time course of crystal growth on acid-etched enamel. SEM image of coating at various times (hours) (a) 2, (b) 8, and (c) 72 with initial σ(HAP) of 12.8 in the presence of amelogenin 50 µg/mL and [F−]=1 mg/L at pH 7.2; (d) the ATR FT-IR spectra of synthetic hydroxyapatite and remineralized enamel. Absorption bands at 1650, 1453, 1256 cm−1 (amide I, II, III bands) correspond to protein and absorption bands at 600 and 554 cm−1 (hydrogen-phosphate υ4 bands) correspond to apatite.
To determine the mineral phases of the different enamel coatings compared to native enamel, the XRD spectrum was acquired to distinguish the relative abundance of HAP and OCP (Fig. 7). Diffraction peaks at 2θ = 31.8° for the HAP(211) plane and 2θ = 4.6° for the OCP(010) plane were calculated by a peak separation process using a Gaussian fit. The XRD data allowed the calculation of the relative weight percentage and crystal size of OCP and HAP in the remineralized coatings. The calculations were based on Scherrer’s equation31 using Jade™ software (Materials Data, Inc.). Table 2 lists the stimulated phase percentage of OCP (JCPDS #26-1056) and HAP (JCPDS #09-0432). The plate-like crystals that grew on enamel in buffers from Region 1 without fluoride were mixed phases of OCP (31% wt.) and HAP (69% wt.). With the addition of [F−] at 2 mg/L in buffers from Region 3, the coating was 97% HAP indicating a homogenous apatite phase of rod-like nanocrystals. Fluoride-substituted hydroxyapatite (FHAP) has an identical crystal structure and XRD diffraction pattern as HAP; therefore it is not possible to distinguish HAP and FHAP in the XRD spectra. We conclude that amelgenin induces nanorod crystals that are predominantly comprised of HAP.
Fig. 7.

XRD spectra of the remineralized enamel and acid-etched enamel. Remineralization was performed with Tris buffered solution at a pH of 7.00 in (a) region 1 (σ(HAP) =11.5, no fluoride), (b) region 3 (σ(HAP)=11.5, [F−]=2 mg/L), (c) region 3 (σ(HAP) =11.5, [F−]=2 mg/L and an amelogenin concentration of 50 µg/mL), and (d) Acid-etched enamel prior to remineralization. Diffraction peak at 2θ= 4.6° correspond to typical OCP crystal (010) plane and peaks at 2θ= 25.8°, 31.8° and 32.9° correspond to HAP crystal (002), (211) and (300) planes, respectively.
Table 2.
Mineral phase composition of remineralized enamel crystals.
| Enamel Sample | Crystal Morphology |
OCP Wt % |
HAPWt % |
Size† nm |
|---|---|---|---|---|
| Ca-P remineralization* | Plate-like | 31 | 69 | 50 |
| Ca-P-F remineralization¶ | Rod-like | 2 | 98 | 35 |
| Native enamel | Rod-like | 3 | 97 | 40 |
Ca-P: Tris buffered solution at pH 7.00 in region 1 (σ (HAP) =11.5, no fluoride),
Ca-P-F: Tris buffered solution at pH 7.00 in region 3 (σ(HAP)=11.5, [F−] 2 mg/L),
Crystal size was calculated using Scherrer’s equation.
Microhardness of mineralized coating
The microhardness of enamel is an important indicator of tooth function. The ideal enamel remineralization coating on carious lesions will restore enamel crystal structure and enamel hardness. We investigated whether the microhardness of the artificial caries lesion increases similarly after remineralization using buffers from region 1 or 3 in the phase diagram. The microhardness was assayed by measuring the Knoop hardness number (KHN) and values are shown in Table 3.
Table 3.
Knoop hardness numbers on enamel surfaces before and after remineralization at different conditions.
| Sample Treatment | Knoop hardness number (KNH) (mean±SD) | ||
|---|---|---|---|
| Polished intact enamel (n=4) | 315.94±24.95aA | 365.61±32.08aA | 356.67±33.07aA |
| Acid-etched enamel (n=4) | 30.86±10.94bA | 33.79±13.12bA | 34.27±7.88bA |
| Ca-P | Ca-P-F | Ca-P-F-AMGN | |
| Remineralized enamel (n=4) | 44.37±24.27bA | 91.47±44.56cB | 172.50±70.69cC |
Remineralization treatment (n=4 teeth)
Ca-P: pH 7.00 σ(HAP)=11.5 HEPES buffer solution for 24 hours.
Ca-P-F: pH 7.00 σ(HAP)=11.5 HEPES buffer solution with [F−]=2 mg/L
Ca-P-F-AMGN: pH 7.00 σ(HAP)=11.5 HEPES buffer solution with [F−]=2 mg/L and an amelogenin concentration of 50µg/mL
Lower-case superscripts indicate grouping in each column. Upper-case superscripts indicate the grouping in each row. Different letters in one group indicate a statistically significant difference (p<0.05).
First, the carious lesions were generated in vitro by acid-etching the enamel surface in lactic acid solution (pH= 4.5 for 72 hours). The hardness of the artificial caries lesions was measured as a KHN of 33.0±10.6. In contrast, the KHN value of original enamel was 346.1±30.0. Remineralization in σ(HAP) =11.5 in the absence of [F−]. A buffer from region 1 for 24 hours resulted in a plate-like crystal coating. Hardness testing revealed there was no significant change in KHN values (44.37±24.27) from that of artificial caries enamel (p=0.962). In contrast, 24 hr incubation with this remineralization buffer containing a [F−] of 2 mg/L generated rod-like crystals in the SEM. Hardness test revealed a significant increase in the KHN value to 91.5±44.6 (p=0.054). When amelogenin (50 µg/mL) was added to the buffer containing a [F−] of 2 mg/L, a densely-bundled crystal coating was observed by SEM. The microhardness after addition of amelogenin was tested and the KHN value increased significantly to 172.5±70.7 (p<0.001). Thus the presence of 2 mg/L [F−] and 50 µg/mL amelogenin can increase the microhardness of the demineralized enamel significantly higher than that increase in the absence of amelgoenin (p = 0.003). We observed that coatings with densely-packed nanorods had the highest KHN values.
Discussions
Our study shows that the morphologies and mineral phases of remineralized calcium phosphate nanocrystals were strongly affected by the composition of the remineralization solution. In particular, the nanocrystal structures were sensitive to the degree of supersaturation, pH, fluoride and calcium concentrations. The various morphologies and phases could be due to the changes in nucleation sites and rates of mineralization linked to variation in supersaturation degrees of apatite and its precursor OCP. At high supersaturation of OCP and low supersaturation of FAP, OCP phase was kinetically stable during nucleation, and the crystals were plate-like with a loose structure, represented by region 1. In aqueous solution, the conversion from plate-like OCP crystals to thermodynamically stable HAP crystals is rapid and may not alter the morphology.32 As a result, plate-like HAP crystals are observed in XRD. The nucleation rate is low at low supersaturation (pH 6.3) and increases with higher supersaturation (pH>6.7). Growth along pre-existing crystals in the (002) direction is prominent with a longer induction time during crystallization. A long induction time facilitates the dissolution of subcritical amorphous crystals clusters. In Region 2, a few crystals elongated to generate lower packing densities of loosely structured nano-needles. In Regions 3 and 4 with higher supersaturation, subcritical crystal clusters developed rapidly into large crystals and the density of crystal packing increased.
Fluoride is a known promoter involved in the conversion of metastable octacalcium phosphate (OCP) into hydroxyapatite (HAP) crystals. However, the minimal concentration of fluoride required for this activity is not clear. Iijima et al. reported the conversion of ribbon-like OCP into needle-like apatite crystals in a membrane diffusion mineralization system after an addition of [F−] of 1–2 mg/L32. A recent report demonstrated that fluoride ions might not only form the elongated HAP but promote epitaxyl growth into hyper-branched crystals with a [F−] above 20 mg/L.33 Hyperbranched and dumbbell-shaped FAP had also been reported in a gel with high concentrations of fluoride (0.5 g/L).34 Our XRD analysis shows the mineral phases of rod-like crystals grown in presence of fluoride are mostly HAP, whereas the plate-like crystals in the absence of fluoride contain large amounts of OCP. Therefore, the morphological transformation from plate-like crystals to rod-like crystals may indicate the rapid phase transition of OCP to HAP at a high supersaturation of FAP. However, the critical level of supersaturation continues to increase with higher concentrations of calcium ions. Thus our data suggests that calcium may inhibit the transition from plates to rods.
A change in remineralization solution composition during crystallization will affect the crystal morphology and phase. Reductions in the solution σ below a threshold level, such as from Region 3 to Region 2, will reduce the crystal density of the remineralized coating. In our current study, the large ratio of solution volume to enamel surface area (1.2–2.5 mL remineralization solution per square millimeter of enamel) was applied and all remineralization tests were finished in less than 24 hours. Therefore, we were able to minimize the shifts in remineralization buffer composition. For long-term remineralization with dense crystals, replenishing the ions and amelogenin will be necessary. Although Fig. 4 suggests the transition of different morphologies with different supersaturation degrees and [F−], it should be noted that the transition boundary may shift with different pH solutions, buffers and enamel substratum.
Amelogenin self-assembly is critical for its function in calcium phosphate mineralization. In this study, we utilized ranges of temperature, protein concentration and pH that are optimal for amelogenin self-assembly.35, 36 An increase in calcium phosphate mineral density is observed with amelogenin concentration of 30–50 µg/mL. But the desired dense crystal arrays form with particular ranges of supersaturation degree and fluoride concentration as shown in Fig. 4. Recently it was proposed that amelogenin may improve the mineralization by forming transitional complexes with amorphous calcium phosphate (ACP).18, 20, 37 Therefore, at the early stage of deposition, the spherical structures were possibly ACP complexed with amelogenin (Fig. 6a). These spherical structures then form rod-like shapes by stacking with each other in an unidirectional manner. During a long remineralization reaction, fluoride and amelogenin promote hydrolysis of ACP to stable HAP and growth of nanorod-like crystals to form densely-packed nanocrystals.
Remineralization for 24 hr shows significant improvement in KHN in the presence of amelogenin at a concentration of 50 µg/mL and a [F−] of 2 mg/L. Although the hardness value of recovered enamel was 51% less than the native enamel, the densely-packed enamel-like coating had a greater KHN value than the plate-like crystals. Future studies will focus on increasing the KHN values and may require longer periods of remineralization or inclusion of different additives, such as ameloblastin and poly(aspartic acid) to suppress crystal growth rate. Alternatively, we may use enzymes such as enamelysin to remove excess amelogenin in order to improve the packing density.
Conclusion
The inability to coat teeth with fluoridated hydroxyapatite with a high mineral packing density currently prevents effective enamel remineralization therapy. Our study reveals that the enamel-like structure can only be formed under certain conditions, which are determined by the synergetic effects of supersaturation degree, pH, fluoride and amelogenin concentration. In this study, we report the conditions needed to form densely-packed arrays of fluoridated hydroxyapatite nanorods. The remineralization buffer is effective at a pH of 6.8±0.4, σ (HAP)=10.2±2 with [F−] 1.5±0.5 mg/L and an amelogenin concentration of 40±10 µg/mL. Outside of these indicated ranges, the coatings are loose nanorods or plate-like crystals, both of which are highly porous structures that may fail to function as a protective coating on teeth. Therefore, this study has laid the foundation for the development of novel and more effective remineralization procedures and dental materials for the treatment and prevention of early carious lesions.
Acknowledgement
This study was supported financially by LSUHSC-NO Chancellor Translational Research Initiative and NIH/NCRR CoBRE pilot grant (5P20RR020160-05) to Yuwei Fan and NIH/NIDCR (1R01 DE019203) to Xiaoming Xu. We would like to thank Dr. Janet Moradian-Oldak at University of Southern California for kindly providing the E coil strain for the production of recombinant amelogenin (NIH-NIDCR DE-013414 and DE-015644), and Dr. Zhi Sun for valuable scientific editing.
Footnotes
Publisher's Disclaimer: This is a PDF file of an unedited manuscript that has been accepted for publication. As a service to our customers we are providing this early version of the manuscript. The manuscript will undergo copyediting, typesetting, and review of the resulting proof before it is published in its final citable form. Please note that during the production process errors may be discovered which could affect the content, and all legal disclaimers that apply to the journal pertain.
References
- 1.Ye W, Wang XX. Ribbon-like and rod-like hydroxyapatite crystals deposited on titanium surface with electrochemical method. Mater Lett. 2007;61(19–20):4062–4065. [Google Scholar]
- 2.Hayakawa S, Li YQ, Tsuru K, Osaka A, Fujii E, Kawabata K. Preparation of nanometer-scale rod array of hydroxyapatite crystal. Acta Biomater. 2009;5:2152–2160. doi: 10.1016/j.actbio.2009.02.018. [DOI] [PubMed] [Google Scholar]
- 3.Chen HF, Tang ZY, Liu J, Sun K, Chang S-R, Peters MC, et al. Acellular synthesis of a human enamel-like microstructure. Adv Mater. 2006;18:1846–1851. [Google Scholar]
- 4.Yamagishi K, Onuma K, Suzuki T, Okada F, Tagami J, Otsuki M, et al. A synthetic enamel for rapid tooth repair. Nature. 2005;433(7028):819. doi: 10.1038/433819a. [DOI] [PubMed] [Google Scholar]
- 5.Wang XK, Xia CJ, Zhang ZH, Den XL, Wei SC, Zheng G, et al. Direct Growth of Human Enamel-Like Calcium Phosphate Microstructures on Human Tooth. J Nanosci Nanotech. 2009;9:1361–1364. doi: 10.1166/jnn.2009.c157. [DOI] [PubMed] [Google Scholar]
- 6.Yujing Yin, Song Yun, Jieshi Fang, Haifeng Chen. Chemical regeneration of human tooth enamel under near-physiological conditions. Chem. Comm. 2009;39:5892–5894. doi: 10.1039/b911407f. [DOI] [PubMed] [Google Scholar]
- 7.Azarpazhooh A, Main PA. Fluoride varnish in the prevention of dental caries in children and adolescents: A systematic review. J Can Dent Assoc. 2008;74:73–79. [PubMed] [Google Scholar]
- 8.Zimmer S. Caries-preventive effects of fluoride products when used in conjunction with fluoride dentifrice. Caries Res. 2001;35:18–21. doi: 10.1159/000049104. [DOI] [PubMed] [Google Scholar]
- 9.Reynolds EC, Cai F, Cochrane NJ, Shen P, Walker GD, Morgan MV, et al. Fluoride and casein phosphopeptide-amorphous calcium phosphate. J Dent Res. 2008;87:344–348. doi: 10.1177/154405910808700420. [DOI] [PubMed] [Google Scholar]
- 10.Pulido MT, Wefel JS, Hernandez MM, Denehy GE, Guzman-Armstrong S, Chalmers JM, et al. The inhibitory effect of MI paste, fluoride and a combination of both on the progression of artificial caries-like lesions in enamel. Operative Dent. 2008;33:550–555. doi: 10.2341/07-136. [DOI] [PubMed] [Google Scholar]
- 11.Petzold M. The influence of different fluoride compounds and treatment conditions on dental enamel: A descriptive in-vitro study of the CaF2 precipitation and microstructure. Caries Res. 2001;35 Suppl 1:45–51. doi: 10.1159/000049110. [DOI] [PubMed] [Google Scholar]
- 12.Roveri N, Battistella E, Bianchi CL, Foltran I, Foresti E, Iafisco M, et al. Surface Enamel Remineralization: Biomimetic Apatite Nanocrystals and Fluoride Ions Different Effects. J Nanomater. 2009 Article ID 746383. [Google Scholar]
- 13.Moradian-Oldak J, Du C, Falini G. On the formation of amelogenin microribbons. Eur J Oral Sci. 2006;114 Suppl 1:289–296. doi: 10.1111/j.1600-0722.2006.00285.x. discussion 327-289, 382. [DOI] [PubMed] [Google Scholar]
- 14.Margolis HC, Beniash E, Fowler CE. Role of macromolecular assembly of enamel matrix proteins in enamel formation. J Dent Res. 2006;85:775–793. doi: 10.1177/154405910608500902. [DOI] [PubMed] [Google Scholar]
- 15.Iijima M, Moriwaki Y, Wen HB, Fincham AG, Moradian-Oldak J. Elongated growth of octacalcium phosphate crystals in recombinant amelogenin gels under controlled ionic flow. J Dent Res. 2002;81(1):69–73. doi: 10.1177/002203450208100115. [DOI] [PubMed] [Google Scholar]
- 16.Iijima M, Moradian-Oldak J. Control of octacalcium phosphate and apatite crystal growth by amelogenin matrices. J Mater Chem. 2004;14:2189–2199. [Google Scholar]
- 17.Wen HB, Moradian-Oldak J. Modification of calcium-phosphate coatings on titanium by recombinant amelogenin. J Biomed Mater Res A. 2003;64(3):483–490. doi: 10.1002/jbm.a.10401. [DOI] [PubMed] [Google Scholar]
- 18.Beniash E, Simmer JP, Margolis HC. The effect of recombinant mouse amelogenins on the formation and organization of hydroxyapatite crystals in vitro. J Struct Biol. 2005;149(2):182–190. doi: 10.1016/j.jsb.2004.11.001. [DOI] [PubMed] [Google Scholar]
- 19.Wang LJ, Guan XY, Yin HY, Moradian-Oldak J, Nancollas GH. Mimicking the self-organized microstructure of tooth enamel. J Phys Chem C. 2008;112(15):5892–5899. doi: 10.1021/jp077105+. [DOI] [PMC free article] [PubMed] [Google Scholar]
- 20.Yang XD, Wang LJ, Qin YL, Sun Z, Henneman ZJ, Moradian-Oldak J, et al. How Amelogenin Orchestrates the Organization of Hierarchical Elongated Microstructures of Apatite. J Phy Chem B. 2010;114:2293–2300. doi: 10.1021/jp910219s. [DOI] [PMC free article] [PubMed] [Google Scholar]
- 21.Fan Y, Sun Z, Moradian-Oldak J. Controlled remineralization of enamel in the presence of amelogenin and fluoride. Biomater. 2009;30(4):478–483. doi: 10.1016/j.biomaterials.2008.10.019. [DOI] [PMC free article] [PubMed] [Google Scholar]
- 22.Fan YW, Moradian-Oldak J. Amelogenin Supramolecular Assembly: A Basis for Enamel-Inspired Nanocomposite Fabrication, MRS; Symposium Proceedings; 2008. 1094-DD09-01. [DOI] [PMC free article] [PubMed] [Google Scholar]
- 23.Fan Y, Sun Z, Moradian-Oldak J. Effect of fluoride on the morphology of calcium phosphate crystals grown on acid etched human enamel. Caries Res. 2009;43:132–136. doi: 10.1159/000209346. [DOI] [PMC free article] [PubMed] [Google Scholar]
- 24.Wang LJ, Nancollas GH. Calcium Orthophosphates: Crystallization and Dissolution. Chem Rev. 2008;108:4628–4669. doi: 10.1021/cr0782574. [DOI] [PMC free article] [PubMed] [Google Scholar]
- 25.Johnsson MSA, Nancollas GH. The role of brushite and octacalcium phosphate in apatite formation. Critical Rev Oral Biol Med. 1992;3(1–2):61–82. doi: 10.1177/10454411920030010601. [DOI] [PubMed] [Google Scholar]
- 26.Wang ZQ, Ma GB, Liu XY. Will Fluoride Toughen or Weaken Our Teeth? Understandings Based on Nucleation, Morphology, and Structural Assembly. J Phys Chem B. 2009;113:16393–16399. doi: 10.1021/jp905846p. [DOI] [PubMed] [Google Scholar]
- 27.Wiedemann-Bidlack FB, Beniash E, Yamakoshi Y, Simmer JP, Margolis HC. pH triggered self-assembly of native and recombinant amelogenins under physiological pH and temperature in vitro. J Struct Biol. 2007;160:57–69. doi: 10.1016/j.jsb.2007.06.007. [DOI] [PMC free article] [PubMed] [Google Scholar]
- 28.Ryu OH, Fincham AG, Hu CC, Zhang C, Qian Q, Bartlett JD, Simmer JP. Characterization of recombinant pig enamelysin activity and cleavage of recombinant pig and mouse amelogenins. J Dent Res. 1999;78:743–750. doi: 10.1177/00220345990780030601. [DOI] [PubMed] [Google Scholar]
- 29.Mohan C. A Guide for the Preparation and Use of Buffers in Biological Systems. EMD Biosciences, Inc.; 2003. [Google Scholar]
- 30.Nikcevic I, Jokanovic V, Mitric M, Nedic Z, Makovec D, Uskokovic D. Mechanochemical synthesis of nanostructured fluorapatite/fluorhydroxyapatite and carbonated fluorapatite/fluorhydroxyapatite. J Solid State Chem. 2004;177:2565–2574. [Google Scholar]
- 31.Hammond C. The basics of crystallography and diffraction. US: Oxford University Press; 2009. p. p219. [Google Scholar]
- 32.Iijima M, Tohda H, Suzuki H, Yanagisawa T, Moriwaki Y. Effects of f- on apatite-octacalcium phosphate intergrowth and crystal morphology in a model system of tooth enamel formation. Calcified Tissue Intl. 1992;50:357–361. doi: 10.1007/BF00301634. [DOI] [PubMed] [Google Scholar]
- 33.Wang ZQ, Ma GB, Liu XY. Will Fluoride Toughen or Weaken Our Teeth? Understandings Based on Nucleation, Morphology, and Structural Assembly. J Phys Chem B. 2009;113(51):16393–16399. doi: 10.1021/jp905846p. [DOI] [PubMed] [Google Scholar]
- 34.Kniep R, Busch S. Biomimetic growth and self-assembly of fluorapatite aggregates by diffusion into denatured collagen matrices. Angew Chem Intl Ed. 1996;35:2624–2626. [Google Scholar]
- 35.Fan YW, Sun Z, Wang R, Abbott C, Moradian-Oldak J. Enamel inspired nanocomposite fabrication through amelogenin supramolecular assembly. Biomater. 2007;28:3034–3042. doi: 10.1016/j.biomaterials.2007.02.016. [DOI] [PMC free article] [PubMed] [Google Scholar]
- 36.Moradian-Oldak J, Goldberg M. Amelogenin supra-molecular assembly in vitro compared with the architecture of the forming enamel matrix. Cells Tissues Organs. 2005;181(3–4):202–218. doi: 10.1159/000091382. [DOI] [PubMed] [Google Scholar]
- 37.Beniash E, Metzler RA, Lam RSK, Gilbert P. Transient amorphous calcium phosphate in forming enamel. J Struct Biol. 2009;166:133–143. doi: 10.1016/j.jsb.2009.02.001. [DOI] [PMC free article] [PubMed] [Google Scholar]