

Abstract
Williams syndrome (WS) is a genetic disorder associated with severe visuospatial deficits, relatively strong language skills, heightened social interest, and increased attention to faces. On the basis of the visuospatial impairments, this disorder has been characterized primarily as a deficit of the dorsal stream, the occipitoparietal brain regions that subserve visuospatial processing. However, some evidence indicates that this disorder may also affect the development of the ventral stream, the occipitotemporal cortical regions that subserve face and object recognition. The present studies examined ventral stream function in WS, with the hypothesis that faces would produce a relatively more mature pattern of ventral occipitotemporal cortical activation, relative to other objects that are also represented across these visual areas. We compared functional magnetic resonance imaging activation patterns during viewing of human faces, cat faces, houses and shoes in individuals with WS (age 14–27), typically developing 6–9 year olds (matched approximately on mental age), and typically developing 14–26 year olds (matched on chronological age). Typically developing individuals exhibited changes in the pattern of activation over age, consistent with previous reports. The ventral stream topography of the WS individuals differed from both control groups, however, reflecting the same level of activation to face stimuli as chronological age matches, but less activation to house stimuli than either mental age or chronological age matches. We discuss the possible causes of this unusual topography and implications for understanding the behavioral profile of people with WS.
Keywords: Williams syndrome, fMRI, ventral stream, FFA, face, temporal lobe, object recognition, mental retardation, intellectual disability, development, children
Williams syndrome (WS) is a rare genetic disorder characterized by physical anomalies, overall intellectual impairment, and an uneven cognitive profile (Bellugi et al., 2000; Mervis et al., 2000; Meyer-Lindenberg et al., 2006). Severe deficits on visuospatial processing, including block construction and drawing tasks, are the hallmark of this disorder (Atkinson et al., 1997; Bellugi et al., 2000; Hoffman et al., 2003; Wang et al., 1995; Landau et al., 2005). Other aspects of visual processing-- such as object recognition-- appear to be less impaired (Landau et al., 2006) and still others-- such as face recognition-- may reflect unusual organization (Deruelle et al., 1999). Indeed, another hallmark of WS is apparent heightened attention to faces, and a strong interest in the social world (Meyer-Lindenberg et al., 2006). This profile of “peaks and valleys” within the visual system, with relatively skilled object recognition along with severe visuospatial impairments, leads to important questions about the precise nature and development of this unusual pattern. In this paper, we explore the nature of the profile and its development by focusing on the representation of several kinds of visual stimuli that are associated with the ventral stream, a major processing stream for visual information.
Visual processing in the brain is handled, in part, by two processing streams extending from primary visual cortex: the dorsal stream (including parietal cortex) responsible for processing of spatial information, and the ventral stream (including fusiform and parahippocampal gyri) responsible for object identification (Ungerleider & Mishkin, 1982), including the representation of faces (Kanwisher et al., 1997) and places (Epstein et al., 2003). The visuospatial deficits observed in WS have been associated with abnormalities in the dorsal stream/parietal lobe, both in structure (Eckert et al., 2005; Meyer-Lindenberg et al., 2004; Reiss et al., 2000; Boddaert et al., 2005; Chiang et al., 2007) and in functional activation during visuospatial processing (Meyer-Lindenberg et al., 2004; Mobbs et al., 2004). In contrast, visual tasks related to ventral stream processing appear relatively strong. This pattern is evident in both the level of functional activation (Meyer-Lindenberg et al., 2004) and behavioral measures that reflect ventral stream function, when compared to tasks that engage the dorsal stream (Atkinson et al., 1997; Dilks et al., 2008; Meyer-Lindenberg et al., 2004; O’Hearn et al., 2009; Paul et al., 2002).
These findings have led to the hypothesis that the cognitive profile in WS reflects a damaged dorsal stream and a relatively normal ventral stream. While the evidence of dorsal stream damage is strong, whether the ventral stream is ‘intact’ is less clear. Some evidence indicates that the ventral stream functions normally, i.e., like typically developed individuals who are matched to people with WS on chronological age (Meyer-Lindenberg et al., 2004). However, other behavioral evidence suggests that ventral stream functions in people with WS may differ from typical controls. People with WS are known for their outgoing and gregarious personalities, and exhibit particular interest in and attention to faces. Consistent with this social personality, face recognition has been long said to be particularly strong (Bellugi et al., 2000; Paul et al., 2002), and relatively better than house recognition under some circumstances (O’Hearn et al., 2009). Uneven strengths and weaknesses across these different types of objects could lead to uneven pattern of activation across the ventral stream, since the level of activation is related to performance (Golarai et al., 2007). In addition, some studies have suggested that people with WS process faces in a different manner from controls. Typically, faces appear to be processed in a unique manner; configural information is particularly utilized so that adults can expertly identify individual faces, which look very similar. Some evidence suggests that people with WS may focus more on featural and less on configural information (Deruelle et al., 1999; Gagliardi et al., 2003; Karmiloff-Smith et al., 2004; but see Tager-Flusberg et al., 2003). If so, such behavioral differences may be reflected in the organization of the ventral stream, as evidence indicates distinct regions subserve configural and featural processing of faces (Maurer et al., 2007).
Further support for differences in ventral stream function in WS comes from measures of brain activity. In an ERP study, Grice and colleagues (2001) found that the neural substrates underlying face processing were abnormal in WS. An fMRI study using passive viewing of faces and houses also revealed some group differences, but this time in house processing (Sarpal et al., 2008). Adults with WS had typical levels of activation for faces, but activation for houses differed from chronologically age matched controls. These group differences did not reach significance in the ventral stream,1 but they did in the dorsal stream, in the intraparietal sulcus (IPS). The WS group also exhibited increased local connectivity among temporal lobe regions; and decreased distal connectivity between parahippocampal gyrus (PPA) and parietal lobe, fusiform gyrus (FFA) and amygdale and prefrontal cortex.
On the basis of this evidence, we hypothesized that the pattern of activation across the ventral stream, for different object classes, would differ for people with WS relative to typically developing individuals. We compared the group with WS to two different control groups, chronological age matches (CA matches) and approximate mental age matches (MA matches). Ventral stream activation for faces and houses changes with typical development between the ages of our MA and CA matches (Golarai et al., 2007). Activation to faces displays a particularly long trajectory, with activation increasing with age into adulthood (Golarai et al., 2010; Scherf et al., 2007). Since face recognition performance in WS – while relatively strong – most often resembles the level of mental age (Deruelle et al., 1999; Tager-Flusberg et al., 2003), we predicted that face activation would be similar to MA matches. If so, face activation would be decreased in the WS group compared to CA matches, similar to decreased level expected in MA matches compared to CA matches. In contrast, house recognition may be significantly poorer than mental age (O’Hearn et al., 2009). Therefore, we predicted house activation would be decreased compared to both MA and CA matched controls. Such results would lead to uneven activation across the ventral stream compared to controls, in contrast with previous evidence indicating that the pattern of activation for faces and houses in ventral stream regions in WS was similar to CA matched controls (Meyer-Lindenberg et al., 2004; Sarpal et al., 2008).
We wanted to control for the myriad of factors that contribute to the brain’s response to complex stimuli, so the analyses relied on contrasting brain activity across multiple classes of objects (i.e., directly comparing activity associated with looking at faces versus looking at other classes of objects). Contrasts such as these control, or ‘subtract away’, the effects of factors such as attention and visual stimulation that are known to affect the brain regions included in our analyses. Human faces and houses were used as stimuli because the comparison between them is a common method for identifying face (FFA) and house (PPA) specific regions in the ventral stream (Haxby et al., 2001; Ishai et al., 1999; Serences et al., 2004). In addition, these representations may be differentially affected in individuals with WS, who show relatively more skill for faces than houses, though more recent evidence indicates that their level of performance on face recognition is generally similar to MA matches, but poorer than CA matches (O’Hearn et al., 2009; Tager-Flusberg et al., 2003). In contrast, house recognition may be particularly impaired in WS (O’Hearn et al., 2009). This may reflect that dorsal stream regions, affected in WS (Sarpal et al., 2008), are necessary for processing the more ‘spatial’ qualities of houses (Sala et al., 2003).
We also wanted to ensure that significant effects were not specific to a given contrast – in other words, we wanted to be sure that increased activation to faces in the face/house contrast did not simply reflect decreased activation to houses in WS. To do this, we tested three other types of stimuli in addition to human faces and houses. First, we included shoes and scrambled stimuli. Shoes, provide a good ‘object’ control object (e.g., often recognized individually, quite similar, about the size of faces, an artifact like houses), and scrambled stimuli provide a control for stimulation of the visual system per se. In addition, we included cat faces. The purpose of this control was to examine whether the response properties of FFA were the same in people with WS as in typical adults, for whom cat faces activate FFA (Tong et al., 2000). People with WS may show the same FFA activation as typical adults to cat faces, or they might display activation that is more specific to human faces (i.e., less activation for cat faces) because of their particular interest in people.
To better position our results in development, and to clearly report the differences between groups, differences between the two control groups are reported first (i.e., typical development) and then each of these groups are compared to the WS group. Including both control groups is particularly important since the ventral stream undergoes a long period of development (Gogtay et al., 2004; Golarai et al., 2010; Scherf et al., 2007), which may be disrupted in developmental disorders (Scherf et al., 2010).
Methods
Participants
Participants were nine individuals with WS, nine typically developing people individually matched for sex and chronological age (CA Matches), and nine children (MA matches; See demographic information, Table 1). We recruited the younger typically developing children to be approximate MA matches, based on the ages used in previous studies (Landau et al., 2006; Vicari et al., 2006). This group scored similarly to the individuals with WS on the Kaufman Brief Intelligence Test (Kaufman & Kaufman, 1990), thus approximating MA matches. However, the matches were not exact, with the MA matches performing significantly better on the matrices portion (on average by 5 points) and worse on the verbal portion (on average by 8 points) than the WS group (See Table 1). This pattern is not surprising considering the uneven performance in WS. Mental age matching has often been done on the basis of non-verbal tasks alone (e.g., the matrices portion); therefore, since MA matches performed better than the WS group on the matrices portion, the MA matches in this study may be slightly older than previously reported control groups. Thus, while this group will be referred to as MA matches in this paper, this is done with the understanding that the matching is approximate.
Table 1.
Demographic data
| original group (N=9/group) | ||||
|---|---|---|---|---|
| raw scores on the KBIT | ||||
| age in years;months | sex | matrices | verbal | |
| MA matches | mean 7;4 range 6;4 to 9;0 significant differences |
4 M, 5 F | 27 +/− 4.5 p < .01 |
38 +/− 6.5 p < .05 |
| WS group | mean 18;3 range 12;10–27;10 | 3 M, 6 F | 22 +/− 4.5 | 46 +/− 4.5 |
| CA matches | mean 17;8 range 11;11–26;6 | 3 M, 6 F | * | * |
| neuroimaging group (N=8/group) | ||||
| raw scores on the KBIT | ||||
| age in years;months | sex | matrices | verbal | |
| MA matches | mean 7;3 range 6;4 to 9;0 | 3 M, 5 F | 27 +/− 4.8 p < .05 |
38 +/− 6.9 p = .05 |
| WS group | mean 18;11 range 14;9–27;10 | 3 M, 5 F | 22 +/− 4.8 | 46 +/− 4.8 |
| CA matches | mean 18;5 range 14;1–26;6 | 3 M, 5 F | * | * |
The diagnoses of people with WS were confirmed by fluorescent in situ hybridization (FISH probe), and these individuals had IQs in the typical range for this disorder (composite IQ of 67 +/− 12.5; Mervis et al., 2000). All subjects tested had normal or corrected to normal acuity.2 One participant with WS was excluded from the MRI analysis (but not the behavioral analysis) due to artifact from dental braces; her CA match was also excluded to make the groups comparable in age. In addition, one MA match was excluded from the MRI analysis (but not the behavioral analysis) due to scanner artifact, leading to 8 participants in each group for the neuroimaging analysis.
The experimental protocol was approved by the Institutional Review Boards of both the Johns Hopkins University and the Johns Hopkins Medical Institutions. Participants received compensation for their participation. All participants or their legal guardians gave written informed consent.
Stimuli
Grayscale photos (5.7 × 6.4 cm) were used as stimuli: 12 exemplars from 4 categories (human faces, houses, shoes, cat faces).3 Object stimuli were phase-altered and used as comparison scrambled stimuli. While unidentifiable, the scrambled stimuli had the same luminance, spatial frequency content, and contrast as the objects. Background information was removed from all stimuli, including the hair line around the faces. Human faces (all adults) had a neutral expression and half were male. Each category of objects was presented in a different block during each run (i.e., there were 4 blocks per run).
Procedure
The mock scanner was used to allow all participants to become accustomed to the scanner sounds and environment, and practice the task, prior to the scanning session. The task was to press a button when they saw a previously viewed target exemplar. This ensured attention in the scanner. Auditory cues also reminded participants of the task at hand. All participants were able to complete the scanning session. In the scanner, the distance between projector and the participant was 67.5cm.
There were 8 runs, each of which took 2 minutes, 12 seconds and included all 4 categories (faces, houses, cats, and shoes) in a block design. Task design is illustrated in Figure 1A. Prior to beginning the experiment, participants viewed a target exemplar from each category (e.g., the black cat), and were trained to push a button when they saw this exemplar. The target exemplar was evident either 1 or 2 times per block within a block, in 4 pseudorandom orders that were matched across groups. Prior to each block, participants heard an auditory cue (“Look at the faces. Press the button when you see the special face”) as well as a visual cue with the category name. They then viewed 12 exemplars from that category for 1.5 s each. They then saw the visual cue ‘nothing’ and the auditory cue “Look at the squares”, followed by 2 scrambled control images for 1.5 s each. Participants then saw the three other categories (houses, shoes, cat faces) in each run. The order of the blocks within a run was counterbalanced across the runs. There were 8 pseudorandom orders of categories that were matched across groups.
Figure 1.

Methods and stimuli used in the target detection task. Targets were viewed prior to testing.
fMRI Data Acquisition
All scans were conducted at the F.M. Kirby Research Center for Functional Brain Imaging on a 3 T Philips Intera (Andover, MA). Tasks were automatically synchronized with the scanner. Participants listened to auditory stimuli via pneumatic headphones. An LCD projector located outside of the scanning room rear-projected the stimuli onto a screen located inside the bore of the scanner, behind the participant’s head. Participants viewed the stimuli via a mirror affixed to the top of the head coil. Responses were made on 2 hand-held buttons connected via fiber optic cable to a Cedrus RB-6x0 Response Box (San Pedro, CA). Stimuli were presented and behavioral data were collected on a Dell Inspiron desktop computer using E-prime software Version 1.2 (Psychology Software Tools).
During the functional scans, T2* weighted, gradient echo, echo planar imaging (EPI) scans [TR= 2 s, TE = 30ms, flip angle = 65°, 35 3mm axial slices, 1 mm gap, 1.875×1.875 pixel, 128×128 matrix) were collected. One high-resolution T1 weighted MPRAGE anatomical scan (TR = 8.02 ms, TE = 3.8 ms, flip angle = 8°, 200 1mm coronal slices, 0 mm gap, 1×1 pixel, 256×256 matrix, scan time = 383 s) was collected to allow for anatomical localization.
Data analysis
Behavioral analysis
A repeated measures Analysis of Variance, followed by a series of one-way ANOVAs, were used to examine the effects of the within subject factor of condition (4 levels: human face, house, shoe, cat face) and the between subject factor of group (3 levels: MA match, CA match, WS). Post-hoc comparisons then examined between group differences on each condition separately.
fMRI analysis
Preprocessing
Functional EPI data were preprocessed using FSL utilities (Smith et al., 2004). First, the time series was corrected for slice acquisition time using slicetimer and motion corrected using mcflirt, which uses rigid body motion estimation and then transformation.4 The acquired image from the midpoint of the scan session was used as a reference. After using the brain extraction tool, data were transformed into Talaraich space employing flirt and fnirt with the TT_N27 brain as a reference, using a non-linear transformation, and the data were resampled into 3 × 3 × 3 mm voxels. Talaraich coordinates have been used extensively in both young children (Gathers et al., 2004; Golarai et al., 2007; Scherf et al., 2007) and those with WS (Boddaert et al., 2005; Eckert et al., 2006; Meyer-Lindenberg et al., 2004). As further assurance that the Talaraich transformation did not substantively change the locale of the ventral stream activation in any participant, each subject’s individual data was also examined in native space. The time series were then spatially smoothed with a 5 mm FWHM Gaussian filter. Following the spatial smoothing, we applied a high-pass filter to remove low frequency drift due scanner artifact. Finally, the data across a time series were normalized to have a mean of 100.
Statistical Analysis
The fMRI data were analyzed with Analysis of Functional NeuroImages (AFNI) software (Cox, 1996). For each individual, a deconvolution analysis was used to examine contrasts of interest (face vs. house) using a voxel-wise general linear model. Block regressors modeled sustained activity across all time points within a block, and these were convolved with an estimate of the hemodynamic response function using a standard model (delay time of 2 seconds, rise time of 3 seconds and a fall time of 5 seconds). We first examined whether the individuals displayed the well-established topographical distribution of activity in the ventral stream regions, with face-responsive areas (FFA; fusiform face area in mid-fusiform gyrus) located lateral to house responsive areas. We then used a series of t-tests (2-tailed, unpooled variance) to examine whether either side of a contrast (e.g., face vs. house) was significantly active within a group (p < .05 uncorrected), with participants as a random factor. These ventral stream regions were identified at z = −15 or −16 and are reported in Table 2. The lenient threshold ensured that we identified this pattern, even if immature, as our groups included both children (in the MA matches) and adolescents (in the CA matches and WS group) and the FFA in particular has been shown to undergo a long developmental trajectory (Golarai et al., 2010; Scherf et al., 2007).
Table 2.
Ventral stream areas active within each group for faces and houses Regions corrected for multiple comparisons in normal font (at least 31 voxels): regions appropriately located in FFA/OFA and between 10 and 30 voxels in size reported in italics.
| MA MATCHES | ||||||
|---|---|---|---|---|---|---|
| FACES | ||||||
| talairach coordinates (Center of Mass) | ||||||
| region | BA | x | y | z | # voxels (3×3×3 mm) | |
| face > scrambled | R fusiform gyrus (FFA) | 37 | 37.6 | −44.5 | −11.9 | 15 |
| R fusiform/inferior occipital gyri (OFA) | 18, 19 | 34 | −86.8 | −11.1 | 144 | |
| L fusiform/inferior occipital gyri (OFA) | 18, 19 | −32.9 | −79.8 | −5.4 | 93 | |
| face > house | ||||||
| face > shoe | R fusiform gyrus (FFA) | 37 | 42.1 | −51.2 | −18 | 17 |
| R inferior temporal gyrus (outside ROI) | 20 | 56.4 | −33.2 | −19.8 | 41 | |
| R inferior occipital gyrus (OFA) | 18 | 30.9 | −91.3 | −18 | 28 | |
| L inferior occipital/lingual gyri (OFA) | 17, 18 | −11 | −95.5 | −4.9 | 110 | |
| face > cat | ||||||
| HOUSES | ||||||
| region | BA | x | y | z | # voxels | |
| house >scrambled | R parahippocampal to occipital, parietal to temporal | 26.5 | −70.5 | 17.3 | 1306 | |
| L parahippocampal to occipital, parietal to temporal | −27.1 | −74.8 | 14 | 1072 | ||
| house > face | bilateral parahippocampal to occipital, parietal to temporal | 1.8 | −70.4 | 16.4 | 4413 | |
| house > shoe | bilateral parahippocampal to occipital, parietal to temporal | 2.3 | −77.3 | −3.3 | 2369 | |
| CA MATCHES | ||||||
| FACES | ||||||
| talairach (CM) | ||||||
| BA | x | y | z | # voxels | ||
| face > scrambled | R fusiform, inferior occipital gyri (FFA/OFA) | 20, 37, 18, 19 | 34.2 | −78.5 | −10.6 | 633 |
| L fusiform, inferior occipital gyri (FFA/OFA) | 20, 37, 18, 19 | −34.6 | −78.6 | −8.5 | 477 | |
| face > house | R fusiform gyrus (FFA) | 20, 36, 37 | 41.7 | −39.3 | −21.7 | 59 |
| L fusiform gyrus (FFA) | 20, 36, 37 | −40 | −41.1 | −18.8 | 35 | |
| R inferior occipital gyrus (OFA) | 18 | 41.1 | −86.9 | −14.7 | 13 | |
| face > shoe | R fusiform gyrus (FFA) | 20, 36, 37 | 41.2 | −39.3 | −21.7 | 32 |
| L fusiform gyrus (FFA) | 37 | −38 | −51 | −10.5 | 10 | |
| R lingual/inferior occipital gyri | 19, 37 | 39.4 | −61.1 | −21.3 | 13 | |
| L lingual/inferior occipital gyri | 18, 19 | −20.5 | −77.8 | −10.8 | 14 | |
| face > cat | R fusiform gyrus (FFA) | 20 | 51.9 | −33 | −19.6 | 30 |
| R inferior temporal gyrus (outside ROI) | 20, 21 | 61.9 | −28.5 | −13.9 | 41 | |
| HOUSES | ||||||
| region | BA | x | y | z | # voxels | |
| house > scrambled | R parahippocampal to occipital, parietal to temporal | 28 | −73.8 | −2.6 | 1835 | |
| L parahippocampal to occipital, parietal to temporal | −29 | −78.4 | −1.2 | 1420 | ||
| house > face | bilateral parahippocampal to occipital, parietal to temporal | 1.9 | −68 | −10.8 | 4321 | |
| house > shoe | bilateral parahippocampal to occipital, parietal to temporal | 1.8 | −75.6 | 5.8 | 3439 | |
| WS | ||||||
| FACES | ||||||
| talairach (CM) | ||||||
| region | BA | x | y | z | # voxels | |
| face > scrambled | R fusiform, inferior occipital gyri (FFA/OFA) | 20, 37, 18, 19 | 30.1 | −85.3 | −9.5 | 456 |
| L fusiform gyrus (FFA) | 37 | −36.2 | −49.1 | −17.4 | 83 | |
| L fusiform, inferior occipital gyri (OFA) | 18, 19 | −30.8 | −88.5 | −13 | 233 | |
| face > house | R fusiform gyrus (FFA) | 37 | 40.6 | −47.2 | −20.7 | 34 |
| L fusiform gyrus (FFA) | 37 | −40.2 | −48.6 | −19.6 | 31 | |
| R fusiform, inferior occipital gyri (OFA) | 19 | 39.9 | −72.5 | −16.2 | 17 | |
| face > shoe | R fusiform gyrus (FFA) | 37 | 40.6 | −49.6 | −19.3 | 44 |
| L fusiform gyrus (FFA) | 37 | −41.2 | −48 | −20.3 | 24 | |
| R inferior occipital, middle occipital gyri (OFA) | 18 | 40.6 | −71.1 | −15.9 | 55 | |
| L inferior occipital gyrus (OFA) | 18 | −39.5 | −83.9 | −12.2 | 38 | |
| face > cat | L fusiform gyrus (FFA) | 20, 36, 37 | −47.9 | −35.8 | −18.8 | 12 |
| HOUSES | ||||||
| region | BA | x | y | z | # voxels | |
| house > scrambled | R parahippocampal to occipital, parietal to temporal | 29.2 | −78.8 | −1.8 | 1017 | |
| L parahippocampal to occipital, parietal to temporal | −28 | −79.7 | −4.1 | 752 | ||
| house > face | R parahippocampal gyrus | 36, 37 | 24.3 | −42.1 | −11.5 | 225 |
| L parahippocampal/fusiform gyrus | 19, 36 | −22.2 | −50.1 | −11.4 | 287 | |
| house > shoe | R medial lingual/fusiform/parahippocampal gyri | 18, 19, 36, 37 | 22.7 | −43 | −10.4 | 204 |
| L fusiform/parahippocampal gyri | 18, 19, 36, 37 | −21.1 | −57.6 | −9.3 | 352 | |
To examine between group differences in these areas (reported in Table 3), we used the coefficients from the deconvolution analyses in an analysis of variance (ANOVA) with group as a between-group factor, condition as a within-group factor, and subject as a random factor (e.g., face vs house processing in the WS group vs MA matches). Each group was compared to the other separately to examine a priori hypotheses about group effects from the literature: 1) in typically developing groups, activation in the CA matches would be greater than in MA matches (6–9), but not completely mature (i.e., similar to previous studies with adults but possibly slightly decreased) because the group included adolescents as well as adults (Golarai et al., 2010); 2) in the WS group, face activation would resemble MA matches, but house activation would be decreased, reflecting the level of recognition performance in WS (O’Hearn et al., 2009). However, if the level of activation in the WS group resembled CA matches, this would be consistent with previous neuroimaging evidence of adults with WS who – atypically – had IQs in the normal range (Meyer-Lindenberg et al., 2004; Sarpal et al., 2008).
Table 3.
Ventral stream regions displaying a significant interaction with group.
| Differences between MA and CA matches | |||||||
|---|---|---|---|---|---|---|---|
| CM | |||||||
| FACES | region | BA | x | y | z | # voxels | |
| face > scram | CA > MA | R fusiform gyrus (FFA) | 20, 36, 37 | 39.6 | −42.9 | −7.9 | 53 |
| CA > MA | L fusiform gyrus (FFA) | 20, 36, 37 | −38.5 | −48.8 | −18.3 | 142 | |
| CA > MA | R posterior, inferior occipital gyri (OFA) | 18, 19 | 28.6 | −84.6 | −8.2 | 202 | |
| CA > MA | L fusiform, inferior occipital gyri (OFA) | 18, 19 | −32.2 | −79.3 | −14.8 | 78 | |
| face > house | CA > MA | L fusiform gyrus (FFA) | 37 | −37.5 | −48 | −10.3 | 42 |
| face > shoe | CA > MA | L fusiform gyrus (FFA) | 37 | −38.5 | −45 | −14.5 | 54 |
| face > cat | |||||||
| HOUSES | |||||||
| house > scram | MA>CA | R fusiform gyrus | 19, 37 | 28.6 | −42 | −1.7 | 169 |
| CA > MA | R fusiform, inferior occipital, parahippocampal gyri | 18, 19 | 31.1 | −68.9 | −14.2 | 244 | |
| CA > MA | L inferior occipital ctx | 18, 19 | −27.9 | −79.1 | −14.4 | 76 | |
| house > face | MA> CA | R fusiform gyrus | 19 | 28.8 | −59.1 | −7.8 | 55 |
| house > shoe | MA> CA | R fusiform gyrus | 19 | 28 | −59.2 | −6.3 | 50 |
| CA > MA | R lingual/fusiform gyri | 18, 19 | 19.3 | −74 | 3.5 | 79 | |
| CA > MA | R parahippocampal/fusiform gyri | 36 | 20.3 | −38 | −11.5 | 36 | |
| CA > MA | L lingual/fusiform | 18, 19 | −22.2 | −71.6 | −11.5 | 50 | |
| SHOES | |||||||
| shoe > scram | CA > MA | R fusiform, inferior occipital, lingual gyri | 18, 19, 37 | 28.1 | −78.7 | −13 | 312 |
| CA > MA | L fusiform/inferior occipital gyri | 18, 19 | −34.5 | −77.2 | −13.9 | 172 | |
| shoe > face | CA > MA | R fusiform gyri | 20, 37 | 52.9 | −53.9 | −18.8 | 44 |
| shoe > house | |||||||
| Differences between WS group and CA matches | |||||||
| CM | |||||||
| FACES | region | BA | x | y | z | # voxels | |
| face > scram | WS> CA | R fusiform gyrus (FFA) | 37 | 24.7 | −50.5 | −9.3 | 54 |
| WS> CA | L fusiform gyrus | 19 | −28.1 | −57.4 | −14.9 | 38 | |
| face > house | |||||||
| face > shoe | |||||||
| HOUSES | |||||||
| house > scram | CA > WS | R fusiform/lingual gyrus | 18, 19 | 27.6 | −74.9 | −13.5 | 157 |
| CA > WS | L fusiform/lingual gyrus | 18, 19 | −30.5 | −82.9 | −2.9 | 212 | |
| house > face | CA > WS | R fusiform, lingual, inferior occipital gyri | 18, 19, 37 | 19.6 | −69.2 | −9.2 | 355 |
| CA > WS | L fusiform gyrus | 19, 37 | −26.9 | −59.6 | −12 | 147 | |
| house > shoe | CA > WS | R fusiform, lingual gyri | 18, 19 | 19.1 | −71.8 | −12.2 | 110 |
| CA > WS | L fusiform, lingual gyri | 18, 19 | −16.7 | −84.9 | −9.9 | 204 | |
| SHOES | |||||||
| shoe > scram | CA > WS | R fusiform, lingual gyri | 18, 19, 37 | 40.7 | −73.4 | −15.6 | 71 |
| shoe > face | |||||||
| shoe > house | |||||||
| Differences between WS group and MA matches ** same area | |||||||
| CM | |||||||
| FACES | region | BA | x | y | z | # voxels | |
| face > scram | WS > MA | L fusiform gyrus (FFA) | 37 | −37.6 | −48.2 | −18 | 85 |
| WS > MA | R fusiform (FFA), bilateral lingual gyri | 18, 19 | 15.7 | −73.4 | −12.3 | 298 | |
| WS > MA | L inferior, middle occipital gyri (OFA) | 18, 19 | −34.6 | −79.5 | −17.1 | 44 | |
| face > house | WS > MA | L fusiform (FFA), inferior occipital gyri** | 36, 37 | −30.3 | −64.1 | −6.2 | 255 |
| face > shoe | WS > MA | L fusiform gyrus (FFA) | 37 | −41.2 | −50 | −20 | 60 |
| HOUSES | |||||||
| house > scram | |||||||
| house > face | MA > WS | R fusiform, lingual, inferior occipital gyri, to dorsal regions | 18, 19, 37 | 29 | −70.3 | −8.2 | 516 |
| MA > WS | L fusiform, inferior occipital gyri** | 36, 37 | same region as above | ||||
| house > shoe | MA > WS | L lingual, fusiform gyri | 18, 19 | −18 | −82.9 | 0 | 279 |
| MA > WS | R fusiform, parahippocampal gyri | 18, 19, 37 | 28.6 | −65.5 | −6.3 | 155 | |
| SHOES | |||||||
| shoe > scram | WS > MA | R fusiform gyrus | 19 | 25.6 | −65.2 | −10.7 | 56 |
| shoe > face | MA > WS | R fusiform gyrus | 19 | 21.3 | −52.5 | −9.5 | 112 |
| shoe > house | |||||||
Given our a priori hypotheses, we restricted our main analyses to the ventral stream. We used a mask of ventral temporal and occipital regions, created to encompass regions typically active in studies of object recognition, including portions of the fusiform, posterior parahippocampal, lingual, inferior and middle occipital gyri. We performed a small-volume correction by conducting a Monte Carlo simulation on Regions of Interest in L and R hemispheres separately. This analysis identified clusters of 31 or more contiguous voxels at p< .05 as significant in a family-wise comparison (p < .05). Regions showing a significant interaction between group and condition, and reaching this threshold, are reported in Table 3. When we used a voxel threshold of p< .01, with the cluster size requirements appropriately reduced to 17 voxels (p<.05), FFA activation was not apparent in some of the interactions or contrasts. This suggests that the development of face activation in FFA that happens from childhood (MA matches) to adolescence/young adulthood (CA matches) reflects increases in larger areas with a relatively low magnitude. In each section, we start with a description of typical development as background for the WS results.
Results
Behavioral results
Overall, all groups performed well at detecting targets, indicating that they were attending to the task and the stimuli, which was the main goal of this task (Figure 2). The repeated measures ANOVA on the error rates in the target detection task revealed a main effect of group (F(2,24) = 5.10, p = .01); post-hoc comparisons using Bonferroni correction indicated that the WS group performed more poorly than the CA matches (p = .01) but did not differ from the MA matches (who did not differ significantly from either group). There was also a main effect of condition (F(3,72)= 12.08, p < .001), reflecting that the human face and cat face targets were easier to detect than the house and shoe targets. However, group by condition interaction (F(6,72)= 3.10, p = .01) indicated that this condition effect differed across groups. The uneven pattern was confirmed by ANOVAs within each group, with condition as a within subject factor, that showed a main effect of condition in the WS group only (F(3, 24)=7.46, p<.01). To examine these group differences further, one-way ANOVAs using post-hoc comparisons examined each condition separately. This comparison revealed that there were group differences on house detection (F(2,26) = 6.81, p < .01) and shoe detection (F(2,24)=5.47, p = .01). Post-hoc comparisons indicated that the WS group performed more poorly than CA matches on house detection (p< .05), and marginally more poorly than CA matches on shoe detection (p = .05), but that there were no significant differences on face detection or cat detection between groups. However, ceiling effects may be obscuring differences between groups, or across conditions within the other groups.
Figure 2.

Behavioral performance in the 9 participants in each group. Error bars are the standard error of the mean.
Neuroimaging results
Non-scrambled (faces and objects) vs. scrambled stimuli (Figure 3)
Figure 3.
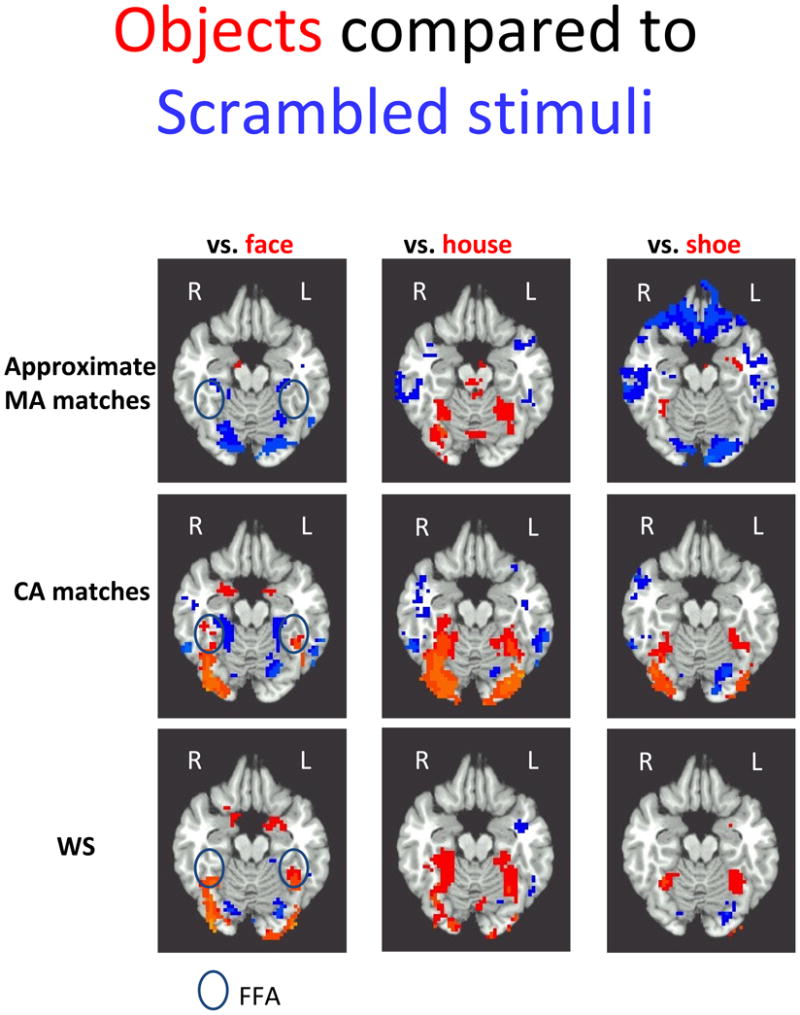
The contrast maps between three distinct classes of objects– faces, houses and shoes – (in blue) and the scrambled stimuli (in red, p< .05, corrected) is shown for each group at z = −16, with approximate MA matches in row 1, CA matches in row 2, and the WS group in row 3 (See also Table 2). Developmental change is evident from row 1 approximate MA matches to row 2 CA matches: approximate MA matches have substantially less activation to objects – regardless of class– and more to the scrambled stimuli than CA matches (reported in Table 3). The WS group in row 3 appears similar in object specificity to CA matches, with little activation for scrambled stimuli; however, they have relatively less activation to houses and shoes, and more activation to faces. Approximate FFA region enclosed in black oval.
Typical development of face- and object-related activation
Scrambled stimuli were included to provide a ‘non-object’ visual category to compare to the object classes. There was typical developmental change in the relative activation for object categories compared to scrambled stimuli, resulting in a significant group by condition interaction in the ANOVA comparing MA and CA matches (for location and size of the significant interactions between group and condition in the ANOVA, see Table 3). When human faces were contrasted with scrambled stimuli, this significant interaction between group (MA, CA matches) and condition (face, scrambled stimuli) was evident in bilateral occipital and fusiform areas. MA matches exhibited little R FFA activation (a non-significant amount) and no L FFA activation for faces compared to scrambled stimuli, while CA matches had substantial bilateral FFA activation for this contrast (see Table 2, Figure 2). For the house/scrambled stimuli comparison, there were again group by condition interactions in bilateral occipital and medial fusiform areas. While both groups showed large regions active for houses compared to scrambled stimuli, CA matches showed more medial fusiform activation while MA matches exhibited house activation in R fusiform regions, in areas active for faces in CA matches. This increased house activation in MA matches, who also displayed increased activation to scrambled stimuli (versus both faces and houses) compared to CA matches, indicates that group differences did not simply reflect overall decreased activation in MA matches. For shoe/scrambled comparison, there was again a group by condition interaction, with more activation in CA matches than MA matches for shoes in bilateral ventral stream areas.
Face- and object-related activation in WS
With this developmental change in object-specific activation as background, we examined the WS group. Activation for objects in the WS group did not resemble either control group. They tended to have more object specific activation and less activation for scrambled stimuli – much like CA matches – but they also displayed a different pattern across object classes compared to the control groups (Figure 3, Table 3). In the face vs. scrambled comparison, there was more activity for faces relative to scrambled stimuli in WS compared to either control group. When the WS group was compared to MA matches, the region displaying a significant interaction included much of the ventral stream, especially posterior regions. When the WS group was compared to CA matches, the region displaying the significant interaction reflected the slightly larger and more posterior activation for faces in WS. The house/scrambled stimuli comparison revealed a different pattern, with the WS group displaying less activation than CA matches for houses compared to scrambled stimuli in bilateral ventral occipitotemporal cortex, but no differences in this contrast compared to MA matches. When shoes were compared to scrambled stimuli, the WS group displayed more activation for shoes compared to scrambled stimuli than MA matches, but less than CA matches, in R fusiform regions. The differences between the WS group and the MA matches reflected in part the increased activation to the scrambled stimuli versus the faces and houses in the MA matches.
Non-scrambled vs. scrambled stimuli summary
CA matches displayed more object-specific activation (object categories > scrambled stimuli) than MA matches, though this developmental change was more striking for faces than houses. This indicates that activation in the ventral stream for objects, compared with non-object visual stimuli, increases with age typically. The WS group appeared to have also undergone this maturation, with almost all the ventral stream displaying increased activation for object categories over scrambled stimuli. However, the pattern of activation in WS across object categories differed from either of the control groups, with activation for faces increased relative to other object classes. The WS group exhibited more activation to faces vs. scrambled stimuli than either MA or CA matches; less activation for houses compared to CA matches; and a middle level of activation for shoes, with less activation than CA matches but more than MA matches.
Faces compared to other objects (Figure 4)
Figure 4.
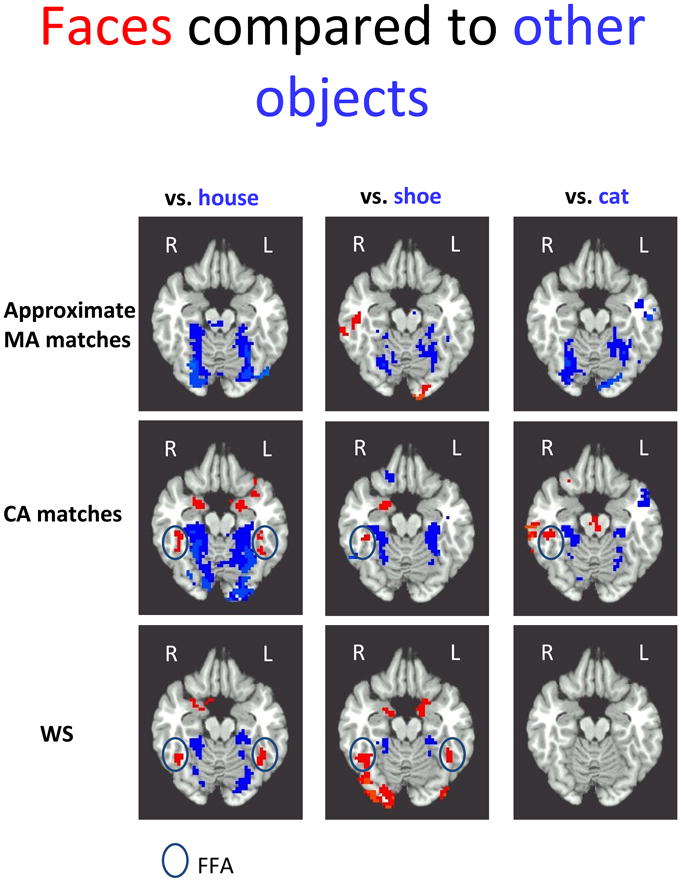
The contrast maps between human faces in red and 3 classes of objects in blue– houses, shoes, and cat faces – is shown for each group at z = −16, with approximate MA matches in row 1, CA matches in row 2, and the WS group in row 3 (See also Table 2). Consistent with previous developmental reports, developmental change in FFA activation is evident in the face vs. house contrast (reported in Table 3), as well as developmental differences in R FFA when faces are compared to shoes and cat faces. The WS group showed bilateral activation to human faces compared to houses and shoes, but less activation to houses, shoes or cat faces than either control group. As expected, there was very little FFA activation when human faces were compared to cat faces. When evident, approximate FFA region is enclosed in a black oval.
Typical development of FFA
We examined mid-fusiform gyri for regions more active for faces than for other objects. There were robust developmental differences between MA and CA matches in L FFA but not R FFA for the contrasts of faces versus the other object categories. (The face/scrambled stimuli contrast did show R FFA activation. See Table 3.) This difference across hemispheres reflected that, while faces activated bilateral FFA in CA matches, activation in MA matches tended to favor faces in the R FFA but other objects in the L FFA (though not always above threshold), leading to greater group differences in the L FFA (Figure 5). Within group analyses indicated that the CA matches had significant bilateral FFA activation when faces were compared to houses and scrambled stimuli, and R FFA activation only when faces were compared to shoes or cat faces (suggesting greater overlap between these categories and faces in the L fusiform gyrus). MA matches displayed very little FFA activation, though there was some face activation in R anterior regions of fusiform gyrus in the face/shoe comparison.
Figure 5.

Regions of significant typical developmental change in the face vs. house contrast were identified. A 6 mm sphere was formed around the peak of the interaction between group (MA, CA matches) and condition (face, house). The mean coefficient of the voxels above threshold in this sphere was graphed. Three regions are shown (illustrated at z = −16), two right fusiform regions more active for houses than faces, and one left fusiform region (FFA) that was more active for faces than houses in the CA matches. In both regions on the right, all groups showed greater activity for houses than faces. In the posterior region, MA matches displayed more activity than CA matches, while the opposite was true of the more anterior medial region. In both cases, the WS group had a level of activation on par with whichever group displayed less activity (CA matches in posterior region, approximate MA matches in anterior region). In L FFA regions, approximate MA matches continued to show slightly more activity for houses but both CA matches and the WS group exhibited more activity for faces in this region. It is not surprising that the WS group showed slightly less activity than the CA matches, since these regions were chosen on the basis of the differences between MA and CA matches, and thus probably utilized regions particularly active for faces in CA matches (which may differ slightly in location from those most active for faces in the WS group).
FFA activation in WS
Individuals with WS had significant activation in both R and L FFA for human faces, compared to houses and shoes, similar to the pattern when faces were compared to scrambled stimuli (Figure 3). There was also a small region of L FFA that was more active for human faces than cat faces in the WS group, but it was below threshold (hence not shown in Figure 4). The pattern of activation in FFA was generally similar to that evident in CA matches (Table 3). Activation for faces in L fusiform gyrus was more extensive in WS than in MA matches, leading to a group by condition interaction in L FFA when faces were compared to houses (which also reflected more activation for houses in MA matches, see** in Table 3) and to shoes.
Occipital regions
We also examined posterior ventral stream for face activation greater than for other objects. Bilateral posterior occipital regions active for faces tended to be evident in all groups, relatively near that reported as occipital face area (OFA) in previous papers (Scherf et al., 2007), though this was more consistent in the CA matches and the WS group. Consistent with previous studies, there were no developmental differences between MA and CA matches in this region (Scherf et al., 2007). In general, the level of activation in the WS group in these regions did not differ from either control group. The exception was the face/house contrast, in which L posterior regions were active for houses in MA matches and faces in the WS group.
Face summary
FFA activation was increased in CA matches compared to MA matches, especially L FFA, but posterior areas (OFA) were not, consistent with previous developmental evidence (Scherf et al., 2007; Gathers et al., 2004). The pattern was somewhat dependent on the contrast - which category of objects was compared to human faces. Individuals with WS showed robust activation to faces when contrasted with the other object categories. Occipitotemporal activation for faces in WS was much like CA matches, and was clearly increased in L FFA compared to MA matches.
Houses and shoes: non-face objects
Typical development of activation for non-face objects
When compared to human faces, activation for houses and shoes occupied medial regions of the ventral stream, with the activation for houses far more extensive than activation for other objects in all groups (opposite side of the contrast, Figure 4; Table 2). The pattern of medial activation for houses and shoes versus faces was generally similar in MA and CA matches. The magnitude of activation was greater for CA matches than MA matches in some medial fusiform and occipital regions for houses (compared to shoes), and in medial fusiform regions for shoes (compared to faces), leading to significant group by condition interactions in these regions (Table 3). In the R hemisphere, MA matches had activation for houses, when compared to faces or shoes, in lateral regions of mid-fusiform gyrus, leading to group differences in these regions that were more active for faces and shoes than houses in CA matches (Table 2, 3).
Activation for non-face objects in WS
While the group with WS exhibited medial fusiform activation for houses and shoes, this was decreased compared to both control groups (Table 2, Figure 3). The WS group had less activation for houses than either MA or CA matches. These group differences occurred regardless of whether houses were contrasted with either faces or shoes (Table 3), indicating that this pattern was not solely driven by the increased activation for faces in WS. The WS group also showed decreased activation for shoes when compared to human faces in R fusiform gyrus compared to both control groups, though this region was not large enough to reach significance when compared to the CA matches (28 voxels when compared with CA matches, 112 with MA matches).
Summary: Houses/shoes
The typical development of areas active for houses/shoes was less dramatic than the development of areas active for human faces, with activation in MA matches generally similar to CA matches. However, there were some significant changes, with house activation becoming more focused in the medial fusiform with age; in other words, house activation in MA matches encompassed some regions that were utilized for faces and shoes in CA matches (R fusiform; Figure 5). Individuals with WS displayed less activation for houses than either control group (especially in posterior and lateral regions). The decreased activation to houses was also evident when houses were compared to shoes, indicating that the decreased activation for houses in the house/face contrast probably did not simply reflect increased attention to faces. However, it is unclear whether this level was below or at the level expected on the basis of mental age, as the MA matches had significantly higher raw scores on the matrices portion of the KBIT, compared to the WS group (see participants section for further explanation).
Cat faces
We examined whether cat faces would activate FFA in our participants, as has been shown with adults previously (Tong et al., 2000), or whether the FFA regions might be more specific to human faces in childhood or in WS. When cat faces were contrasted with houses, both CA matches and the WS group exhibited bilateral FFA activation, while the MA matches did not. This was the same pattern evident with human faces. While human and cat faces showed substantial overlap, the CA matches exhibited R FFA activation that was specific to human faces (Figure 4; as well as more lateral regions of inferior temporal gyrus, which differed between MA and CA matches in the L hemisphere).
Summary: Cat faces
All groups showed a pattern of activation for cat faces that was similar to human faces, suggesting that the response properties of FFA are similar in typically developing individuals and those with WS. This suggests that the FFA activation in WS is not more specific to human faces than in typical development, disproving our hypothesis.
Exploratory analysis: Parietal activation in the face/house contrast
The patterns of activation outside the ventral stream were examined in the face vs. house contrast, in part to see if individuals with WS displayed less parietal activation for houses than controls as previously indicated (Sarpal et al., 2008). We examined each group for regions that were larger than 197 voxels, the size indicated by a Monte Carlo simulation to be required for significance (held to an experiment-wise p < .05) in a whole brain analysis. There was significantly more activation for houses than faces in all groups throughout parietal lobe (as well as posterior cingulate). However, the magnitude of this activation was significantly decreased in the WS group, leading to interactions between group and condition when the WS group was compared to each group separately, consistent with the previous literature (Sarpal et al., 2008). No regions other than the ventral occipitotemporal regions and the parietal lobe were active above threshold in any group.
Individual FFA and PPA data
We analyzed individual data on the face- house contrast to ensure that these findings were not driven by a single subject, or by more variability in one group. To do so, we identified whether FFA and PPA regions were evident in each participant (threshold is p< .01 for FFA and p< .001 for PPA, previously used in the literature; Golarai et al., 2007). This individual data revealed the same pattern as the group analyses, with the number of individuals displaying FFA activation in the WS group on par with CA matches, but fewer individuals with WS showing PPA activation for houses. In the 8 cases analyzed, 6 of the 8 individuals with WS and CA matches displayed both L and R FFA activation for faces but only 3 of the MA matches displayed L FFA activation and 5 exhibited R FFA activation. These results mirrored the previous ones, with fewer MA matches displaying FFA activation than CA matches or the WS group and this difference being more evident in the L FFA than the R FFA. Regarding the PPA, all the CA matches and MA matches exhibited greater activation for houses than faces bilaterally, while only 5 of the 8 individuals with WS displayed bilateral PPA activation. This difference between groups is consistent with previous tests indicating decreased activation for houses in WS compared to either of the control groups.
Correlations
In each group separately, we correlated mental age and chronological age with the size and magnitude (mean or peak) of activation in FFA and PPA, though caution in interpreting these correlations is stressed due to the small sample size, as it makes individual data disproportionately influential and results in decreased power to detect developmental change. These correlations were done separately for the L and the R hemisphere. Performance was not used in these correlations because of ceiling effects. The raw score on the KBIT IQ tests – i.e. mental age – did not correlate with FFA or PPA activation in either the WS group or the MA matches. In WS, chronological age correlated with peak magnitude for faces in R FFA, but surprisingly this correlation was negative (r(6)=−.92, p=.009). Chronological age in the WS group was positively correlated with peak magnitude for houses in R PPA (r(5)=.99, p=.002). In CA matches, chronological age did not correlate with any of the measures.
Discussion and Conclusions
We examined ventral occipitotemporal cortical activation in individuals with WS relative to two control groups: adolescents and young adults individually matched to the people with WS on age and sex (‘CA matches’), and typically developing children who were matched approximately on mental age (‘MA matches’). All groups generally showed the expected ventral stream topography, with large areas active for houses (and small regions for shoes, if any) medial to smaller regions active for human faces. However, there were changes in the relative amounts of activation for different objects within this topography, both with normal development and in WS.
Typical developmental changes were consistent with the previous literature on the development of the ventral stream (Aylward et al., 2005; Gathers et al., 2004; Golarai et al., 2007; Scherf et al., 2007). As in these studies, developmental increases in activation were most notable for face representation in the mid-fusiform areas (i.e., FFA). A similar pattern was evident when cat faces were compared to houses, suggesting that responses in FFA generalize to cat faces in adolescents. In addition, object specific activation (objects > scrambled stimuli) increased between the MA and CA matches throughout the ventral stream, regardless of object class (face, house, shoe). These results – using a less specific contrast than those generally reported in the developmental literature – hints that the ventral stream may become more specialized for objects generally over the course of development (see also Gathers et al., 2004).
The pattern across categories in individuals with WS was distinct from either of the control groups, with relatively more activation for faces and less for houses. This was true regardless of whether face and houses were compared to each other, or compared to another object (shoe) or non-object (scrambled stimuli). Face representation in WS was generally similar to CA matches and increased compared to MA matches, while house activation tended to be less than either MA or CA matches. While our data must be interpreted with caution, due to the small sample size, and wide age range within the WS and CA groups, it is consistent with behavioral studies of Williams syndrome showing face recognition may be stronger than house recognition (O’Hearn et al., 2009). The low level of activation for house stimuli is also consistent with previous imaging findings from Sarpal et al. (2008), who found less activation in the parietal cortex for houses. It is possible that the decreased activation for houses in ventral occipitotemporal cortex in WS is linked to decreases in the broader network of brain regions involved in spatial representations of layouts, including both the parietal and parahippocampal cortices, along with the hippocampus (Burgess, 2008). Recent findings have revealed severe deficits in the ability of people with WS to reorient in space, a capacity that is strongly related to the representation of geometric structures evident in surface layouts (Lakusta et al., 2010).
There was very little activation for the scrambled stimuli in WS, much like or less than CA matches. This indicates that the specialization for objects (vs non-objects) in the ventral stream develops relatively well in this developmental disorder, as would be expected on the basis of previous literature on object recognition and ventral stream activation (Meyer-Lindenberg et al., 2004; Sarpal et al., 2008).
The uneven pattern of activation across faces and houses in WS was evident with several distinct contrasts, helping to ensure that the pattern of results didn’t simply reflect the contrast used. Looking at typical developmental patterns across different contrasts may also provide insight into discrepancies between previous studies. Developmental change for the typical samples has been consistently reported for faces in mid-fusiform gyri (Gathers et al., 2004; Golarai et al., 2007; Scherf et al., 2007; Aylward et al., 2005). However, reports have been contradictory about whether the L FFA (Gathers et al., 2004; Scherf et al., 2007) or the R FFA (Golarai et al., 2007) develop later, and whether the PPA develops at all between these ages (Golarai et al., 2007; Scherf et al., 2007). Our data provide some insight into these inconsistencies – while L FFA tended to represent non-face objects more in MA matches but switched to human faces in CA matches, the R FFA tended to be more active for faces than houses or shoes in both typical groups. Our results are similar to that reported in Scherf and Gathers and colleagues; like them, we contrasted faces with real (“nameable”) object classes, while Golarai compared faces to (“unnameable”) abstract objects. So a possible explanation for the inconsistent literature is that the L FFA development is most striking when faces are compared to real object classes, because this region tends to represent these other object classes in younger children. Activation in the R FFA might increase over development but this region may not actually represent other object classes in younger children. If so, the comparison to abstract objects (as in Golarai and colleagues) might be the best way to identify the development in R FFA. We also found some developmental changes in the location and amount of activation for houses when compared to other objects, with activation moving anterior with age, a commonly reported pattern (Gathers et al., 2004; Scherf et al., 2007), closer to what is generally considered the parahippocampal place area (PPA) in adults.
Why the increased activation in WS for faces? There are several possibilities. The increased activation in WS could reflect expertise for faces, relative to the other object classes. In adulthood, increased FFA activity has been linked with increased expertise at recognizing faces, often individual people (Rotshtein et al., 2005; Grill-Spector et al., 2000). Relatedly, Golarai and colleagues (2007) showed that the increasing size of FFA and PPA with age was correlated with improved recognition memory for faces and places. Similar assumptions have been made about the association between decreased activation in FFA and the impaired face recognition evident in other developmental disorders, such as autism (Pinkham et al., 2008; Pierce, 2001; Schultz et al., 2000). However, this explanation is limited by the fact that there was substantially more activation than would be expected by the level of performance in the WS group. While performance is approximately the same as the MA matches, face activation is significantly increased in the WS group compared to MA matches, contrary to what would be expected if the differences in activation between groups reflected the level of performance alone.
Since the FFA activation appeared more mature (i.e., increased) than would be predicted by the level of behavioral performance in WS, a more likely explanation is that the increased interest in faces found in this syndrome behaviorally leads to particular attention to faces, modulating FFA activation (Serences et al., 2004). This increased attention may lead to relatively increased expertise and activation for faces in WS over development (Karmiloff-Smith, 1998), resulting in the atypical ventral stream profile across object classes. This possibility is similar, but in the opposite direction, to the argument that a lack of interest in/attention to faces leads to decreased FFA activation in autism, which is generally envisioned to be a relatively stable change in the functional architecture of the ventral stream. Another possibility, and a caveat in interpreting these data, is that these effects are more transient and task-specific. Further research on ventral stream organization in WS is needed to identify whether the atypical pattern of ventral stream activation is evident across tasks (e.g., with unattended faces), in order to decouple the relative contributions of attention and expertise to FFA activation.
Finally, alternative explanations focus on neuroanatomy and connectivity between regions. Much in the same way that the genetic differences in WS appear to affect dorsal stream more than ventral stream structure and function, these differences may also affect development in medial ventral stream regions more than lateral ventral stream regions. Differences in medial ventral stream could be associated with nearby abnormalities in hippocampal structure and function in WS (Meyer-Lindenberg et al., 2005). If more intact brain function in lateral fusiform regions leads to an increased ability to process faces, such a developmental difference could actually contribute to some of the behavioral differences evident in WS. In addition, the dorsal and ventral streams are not independent from each other. Because of connections between the two, developmental problems in the dorsal stream may cause changes in the development of the ventral stream. Since some areas of the ventral stream receive more dorsal (“spatial”) input than others, the impact of impaired development of the dorsal stream may be uneven across ventral stream regions, leading to a pattern similar to the current results.
Previous studies of WS using a sample with normal IQs (Meyer-Lindenberg et al., 2004; Sarpal et al., 2008) found no major differences between groups in ventral stream topography with a face/house contrast. We replicated several of the findings from these studies, including face activation in FFA on par with CA matches, and decreased activation for houses in the parietal lobe. Sarpal and colleagues (2008) found some small differences in activation for houses compared to faces in the ventral stream, but these differences did not survive correction for multiple comparisons and were not evident when houses were compared to scrambled stimuli. The group differences we found in house activation were significant and consistent across contrasts. While these two results are relatively coherent, an important question is why the decreased activation for houses in WS is so much more evident in the current study. The most obvious difference between studies is the samples – the present sample included intellectually disabled children and young adults with WS, while the previous studies used adults with WS and IQs in the normal range. How this might affect ventral stream topography is unclear, in part because little is known about how intellectual disability is related to brain function. Some possibilities include that the WS sample with normal IQs may have more typical experiences over development, compared to our population, or they may exhibit fewer of the behavioral abnormalities associated with WS, such as increased and sometimes inappropriate social interest. However, intellectual ability alone cannot explain the pattern of activation in the current study of WS, as face representation was strikingly increased to that expected on the basis of mental age.
It is still an open question whether brain activation in intellectually disabled populations for a given task resembles more closely the level expected on the basis of chronological or mental age. The current study suggests that, not surprisingly, neither accounts fully for the pattern of activation. Further study of the development of ventral stream function, and how it differs in those with developmental disorders, should provide much needed insight into the underlying organization of this region that gives rise to its category dependent topography.
Acknowledgments
This work was done at Johns Hopkins University and supported by grants from NICHD (F32 HD42346 to KOH), Research Center M01-RR00052 (Kirby Center to Barbara Landau and KOH), NINDS (RO1 NS 050876 to Barbara Landau) and NIMH (R01 MH067924 to Beatriz Luna, KO1 081191 to KOH). We thank the staff at the Kirby Center for all their help and the laboratory of James Haxby for generously lending the stimuli. We also thank Catherine Wright for helping to prepare the manuscript. We gratefully acknowledge all of our participants and their families, and the Williams Syndrome Association. Preliminary results were presented at the Annual Meeting of the Society for Neuroscience, November 2006.
Footnotes
The house vs. face comparison revealed a difference in collateral sulcus, but this did not withstand correction for multiple comparisons. The house vs. scrambled stimuli comparison indicated group differences in BA 18 but this contrast, with the scrambled stimuli, did not control for general differences in object specificity in the ventral stream and was not evident in the house vs. face comparison.
While special glasses can be worn in the scanner if needed, one participant with WS chose not to wear them because she found them uncomfortable. To ensure she could see the stimuli well, we made sure she was accurate during practice in the mock scanner.
The human faces, houses and shoes were the canonical views of the stimuli reported in Haxby et al. (2001).
In addition, each participant was individually examined and TRs that included rapid movement were censored from the data during the deconvolution analysis.
Reference List
- Atkinson J, King J, Braddick O, Nokes L, Anker S, Braddick F. A specific deficit of dorsal stream function in William’s syndrome. Neuroreport: An International Journal for the Raid Communication of Research in Neuroscience. 1997;8:1919–1922. doi: 10.1097/00001756-199705260-00025. [DOI] [PubMed] [Google Scholar]
- Aylward EH, Park JE, Field KM, Parsons AC, Richards TL, Cramer SC, et al. Brain activation during face perception: evidence of a developmental change. Journal of Cognitive Neuroscience. 2005;17:308–319. doi: 10.1162/0898929053124884. [DOI] [PubMed] [Google Scholar]
- Bellugi U, Lichtenberger L, Jones W, Lai Z, St George M. I. The neurocognitive profile of Williams syndrome: A complex pattern of strengths and weaknesses. Journal of Cognitive Neuroscience. 2000;12:7–29. doi: 10.1162/089892900561959. [DOI] [PubMed] [Google Scholar]
- Bellugi U, Lichtenberger L, Mills D, Galaburda A, Korenberg JR. Bridging cognition, the brain and molecular genetics: Evidence from Williams syndrome. Trends in Neurosciences. 1999;22:197–207. doi: 10.1016/s0166-2236(99)01397-1. [DOI] [PubMed] [Google Scholar]
- Boddaert N, Mochel F, Meresse I, Seidenwurm D, Cachia A, Brunelle F, et al. Parieto-occipital grey matter abnormalities in children with williams syndrome. Neuroimage. 2005;30:721–725. doi: 10.1016/j.neuroimage.2005.10.051. [DOI] [PubMed] [Google Scholar]
- Burgess N. Spatial cognition and the brain. Ann N Y Acad Sci. 2008;11:77–97. doi: 10.1196/annals.1440.002. [DOI] [PubMed] [Google Scholar]
- Chiang MC, Reiss AL, Lee AD, Bellugi U, Galaburda A, Korenberg JR, et al. 3D pattern of brain abnormalities in Williams syndrome visualized using tensor-based morphometry. Neuroimage. 2007;36:1096–1109. doi: 10.1016/j.neuroimage.2007.04.024. [DOI] [PMC free article] [PubMed] [Google Scholar]
- Cox RW. AFNI: Software for analysis and visualization of functional magnetic resonance neuroimages. Computers and Biomedical Research. 1996;29:162–173. doi: 10.1006/cbmr.1996.0014. [DOI] [PubMed] [Google Scholar]
- Deruelle C, Mancini J, Livet MO, Casse-Perrot C, de Schonen S. Configural and local processing of faces in children with Williams syndrome. Brain & Cognition. 1999;41:276–298. doi: 10.1006/brcg.1999.1127. [DOI] [PubMed] [Google Scholar]
- Dilks DD, Hoffman JE, Landau B. Vision for perception and vision for action: Normal and unusual development. Developmental Science. 2008;11:474–86. doi: 10.1111/j.1467-7687.2008.00693.x. [DOI] [PubMed] [Google Scholar]
- Eckert MA, Hu D, Eliez S, Bellugi U, Galaburda A, Korenberg J, et al. Evidence for superior parietal impairment in Williams syndrome. Neurology. 2005;64:152–153. doi: 10.1212/01.WNL.0000148598.63153.8A. [DOI] [PubMed] [Google Scholar]
- Eckert MA, Tenforde A, Galaburda A, Bellugi U, Korenberg J, Mills D, et al. To modulate or not to modulate: differing results in uniquely shaped Williams syndrome brains. Neuroimage. 2006;32:1001–1007. doi: 10.1016/j.neuroimage.2006.05.014. [DOI] [PubMed] [Google Scholar]
- Epstein R, Graham KS, Downing PE. Viewpoint-specific scene representations in human parahippocampal cortex. Neuron. 2003;37:865–876. doi: 10.1016/s0896-6273(03)00117-x. [DOI] [PubMed] [Google Scholar]
- Gagliardi C, Frigerio E, Burt DM, Cazzaniga I, Perrett DI, Borgatti R. Facial expression recognition in Williams syndrome. Neuropsychologia. 2003;41:733–738. doi: 10.1016/s0028-3932(02)00178-1. [DOI] [PubMed] [Google Scholar]
- Gathers AD, Bhatt R, Corbly CR, Farley AB, Joseph JE. Developmental shifts in cortical loci for face and object recognition. Neuroreport. 2004;15:1549–53. doi: 10.1097/01.wnr.0000133299.84901.86. [DOI] [PMC free article] [PubMed] [Google Scholar]
- Gogtay N, Giedd JN, Lusk L, Hayashi KM, Greenstein D, Vaituzis AC, et al. Dynamic mapping of human cortical development during childhood through early adulthood. Proceedings of the National Academy of Science of the National Academy of the United States of America. 2004;101:8174–9. doi: 10.1073/pnas.0402680101. [DOI] [PMC free article] [PubMed] [Google Scholar]
- Golarai G, Ghahremani DG, Whitfield-Gabrieli S, Reiss A, Eberhardt JL, Gabrieli JDE, et al. Differential development of high-level visual cortex correlates with category-specific recognition memory. Nature Neuroscience. 2007;10:512–522. doi: 10.1038/nn1865. [DOI] [PMC free article] [PubMed] [Google Scholar]
- Golarai G, Liberman A, Yoon J, Grill-Spector K. Differential development of the ventral visual cortex extends through adolescence. Frontiers in Human Neuroscience. 2010 doi: 10.3389/neuro.09.080.2009. [DOI] [PMC free article] [PubMed] [Google Scholar]
- Grice SJ, Spratling MW, Karmiloff-Smith A, Halit H, Csibra G, de Haan M, et al. Disordered visual processing and oscillatory brain activity in autism and Williams syndrome. Neuroreport. 2001;12:2697–700. doi: 10.1097/00001756-200108280-00021. [DOI] [PubMed] [Google Scholar]
- Grill-Spector K, Kushnir T, Malach R. The dynamics of object-selective activation correlate with recognition performance in humans. Nature Neuroscience. 2000;3:837–843. doi: 10.1038/77754. [DOI] [PubMed] [Google Scholar]
- Haxby JV, Gobbini MI, Furey ML, Ishai A, Schouten JL, Pietrini P. Distributed and overlapping representations of faces and objects in ventral temporal cortex. Science. 2001;293:2425–2430. doi: 10.1126/science.1063736. [DOI] [PubMed] [Google Scholar]
- Hoffman JE, Landau B, Pagani B. Spatial breakdown in spatial construction: Evidence from eye fixations in children with Williams syndrome. Cognitive Psychology. 2003;46:260–301. doi: 10.1016/s0010-0285(02)00518-2. [DOI] [PubMed] [Google Scholar]
- Ishai A, Ungerleider LG, Martin A, Schouten JL, Haxby JV. Distributed representation of objects in the human ventral visual pathway. Proceedings of the National Academy of Science of the National Academy of the United States of America. 1999;96:9379–9384. doi: 10.1073/pnas.96.16.9379. [DOI] [PMC free article] [PubMed] [Google Scholar]
- Jordan H, Reiss JE, Hoffman JE, Landau B. Intact perception of biological motion in the face of profound spatial deficits: Williams syndrome. Psychological Science. 2002;13:162–167. doi: 10.1111/1467-9280.00429. [DOI] [PubMed] [Google Scholar]
- Kanwisher N, McDermott J, Chun MM. The fusiform face area: A module in human extrastriate cortex specialized for face perception. Journal of Neuroscience. 1997;17:4302–4311. doi: 10.1523/JNEUROSCI.17-11-04302.1997. [DOI] [PMC free article] [PubMed] [Google Scholar]
- Karmiloff-Smith A, Thomas M, Annaz D, Humphreys K, Ewing S, Brace N, et al. Exploring the Williams syndrome face-processing debate: the importance of building developmental trajectories. Journal of Child Psychology & Psychiatry. 2004;45:1258–1274. doi: 10.1111/j.1469-7610.2004.00322.x. [DOI] [PubMed] [Google Scholar]
- Karmiloff-Smith A. Development itself is the key to understanding developmental disorders. Trends in Cognitive Sciences. 1998;2:389–398. doi: 10.1016/s1364-6613(98)01230-3. [DOI] [PubMed] [Google Scholar]
- Kaufman AS, Kaufman NL. Kaufman brief intelligence test. 1. Circle Pines, MN: American Guidance Service; 1990. [Google Scholar]
- Lakusta L, Dessalegn B, Landau B. Impaired geometric reorientation caused by genetic defect. Proceedings of the National Academy of Science of the National Academy of the United States of America. 2010;107:2813–2817. doi: 10.1073/pnas.0909155107. [DOI] [PMC free article] [PubMed] [Google Scholar]
- Landau B, Hoffman JE, Kurz N. Object recognition with severe spatial deficits in Williams syndrome: sparing and breakdown. Cognition. 2006;100:483–510. doi: 10.1016/j.cognition.2005.06.005. [DOI] [PubMed] [Google Scholar]
- Landau B, Hoffman JE, Reiss JE, Dilks DD, Lakusta L, Chunyo G. Specialization and breakdown in spatial cognition: Lessons from Williams syndrome. In: Morris CA, Lenhoff H, Wang P, editors. Williams-Beuren Syndrome: Research and Clinical Perspectives. Baltimore, MD: Johns Hopkins University Press; 2005. [Google Scholar]
- Maurer D, O’Craven KM, Le Grand R, Mondloch CJ, Springer MV, Lewis TL, Grady CL. Neural correlates of processing facial identity based on features versus their spacing. Neuropsychologia. 2007;45:1438–1451. doi: 10.1016/j.neuropsychologia.2006.11.016. [DOI] [PubMed] [Google Scholar]
- Mervis CB, Robinson BF, Bertrand J, Morris CA, Klein-Tasman BP, Armstrong SC. The Williams syndrome cognitive profile. Brain and Cognition. 2000;44:604–28. doi: 10.1006/brcg.2000.1232. [DOI] [PubMed] [Google Scholar]
- Meyer-Lindenberg A, Kohn P, Mervis CB, Kippenhan JS, Olsen RK, Morris CA, et al. Neural basis of genetically determined visuospatial construction deficit in Williams syndrome. Neuron. 2004;43:623–31. doi: 10.1016/j.neuron.2004.08.014. [DOI] [PubMed] [Google Scholar]
- Meyer-Lindenberg A, Mervis CB, Berman KF. Neural mechanisms in Williams syndrome: a unique window to genetic influences on cognition and behaviour. Nat Rev Neurosci. 2006;7:380–393. doi: 10.1038/nrn1906. [DOI] [PubMed] [Google Scholar]
- Meyer-Lindenberg A, Mervis CB, Sarpal D, Koch P, Steele S, Kohn P, et al. Functional, structural, and metabolic abnormalities of the hippocampal formation in Williams syndrome. The Journal of Clinical Investigation. 2005;115:1888–1895. doi: 10.1172/JCI24892. [DOI] [PMC free article] [PubMed] [Google Scholar]
- Mobbs D, Garrett AS, Menon V, Rose FE, Bellugi U, Reiss AL. Anomalous brain activation during face and gaze processing in Williams syndrome. Neurology. 2004;62:2070–6. doi: 10.1212/01.wnl.0000129536.95274.dc. [DOI] [PubMed] [Google Scholar]
- O’Hearn K, Courtney SM, Street W, Landau B. Working memory impairment in people with Williams syndrome: effects of delay, task and stimuli. Brain & Cognition. 2009;69:495–503. doi: 10.1016/j.bandc.2008.10.004. [DOI] [PMC free article] [PubMed] [Google Scholar]
- Paul BM, Stiles J, Passarotti A, Bavar N, Bellugi U. Face and place processing in Williams syndrome: Evidence for a dorsal-ventral dissociation. Neuroreport. 2002;13:1115–1119. doi: 10.1097/00001756-200207020-00009. [DOI] [PubMed] [Google Scholar]
- Pierce K. Face processing occurs outside the fusiform ‘face area’ in autism: evidence from functional MRI. Brain. 2001;124:2059–2073. doi: 10.1093/brain/124.10.2059. [DOI] [PubMed] [Google Scholar]
- Pinkham AE, Hopfinger JB, Pelphrey KA, Piven J, Penn DL. Neural bases for impaired social cognition in schizophrenia and autism spectrum disorders. Schizophr Res. 2008;99:164–175. doi: 10.1016/j.schres.2007.10.024. [DOI] [PMC free article] [PubMed] [Google Scholar]
- Reiss AL, Eliez S, Schmitt JE, Straus E, Lai Z, Jones W, et al. IV. Neuroanatomy of Williams syndrome: a high-resolution MRI study. Journal of Cognitive Neuroscience. 2000;12(Suppl 1):65–73. doi: 10.1162/089892900561986. [DOI] [PubMed] [Google Scholar]
- Reiss JE, Hoffman JE, Landau B. Motion processing specialization in Williams syndrome. Vision Research. 2005;45:3379–3390. doi: 10.1016/j.visres.2005.05.011. [DOI] [PubMed] [Google Scholar]
- Rotshtein P, Henson RN, Treves A, Driver J, Dolan RJ. Morphing Marilyn into Maggie dissociates physical and identity face representations in the brain. Nature Neuroscience. 2005;8:107–113. doi: 10.1038/nn1370. [DOI] [PubMed] [Google Scholar]
- Sala JB, Rama P, Courtney SM. Functional topography of a distributed neural system for spatial and nonspatial information maintenance in working memory. Neuropsychologia. 2003;41:341–56. doi: 10.1016/s0028-3932(02)00166-5. [DOI] [PubMed] [Google Scholar]
- Sarpal D, Buchsbaum BR, Kohn PD, Kippenhan JS, Mervis CB, Morris CA, et al. A genetic model for understanding high-order visual processing: Functional interactions of the ventral visual stream in Williams Syndrome. Cerebral Cortex. 2008;18:2402–2409. doi: 10.1093/cercor/bhn004. [DOI] [PMC free article] [PubMed] [Google Scholar]
- Scherf K, Luna B, Minshew N, Behrmann M. Atypical development of face-related activation in Autism. Frontiers in Neuroscience 2010 [Google Scholar]
- Scherf KS, Behrmann M, Humphreys K, Luna B. Visual category-selectivity for faces, places and objects emerges along different developmental trajectories. Developmental Science. 2007;10:F15–F30. doi: 10.1111/j.1467-7687.2007.00595.x. [DOI] [PubMed] [Google Scholar]
- Schultz RT, Gauthier I, Klin A, Fulbright RK, Anderson AW, Volkmar F, et al. Abnormal ventral temporal cortical activity during face discrimination among individuals with autism and asperger syndrome. Archives of General Psychiatry. 2000;57:331–340. doi: 10.1001/archpsyc.57.4.331. [DOI] [PubMed] [Google Scholar]
- Serences JT, Schwarzbach J, Courtney SM, Golay X, Yantis S. Control of object-based attention in human cortex. Cerebral Cortex. 2004;14:1346–1357. doi: 10.1093/cercor/bhh095. [DOI] [PubMed] [Google Scholar]
- Smith SM, Jenkinson M, Woolrich MW, Beckmann CF, Behrens TE, Johansen-Berg H, et al. Advances in functional and structural MR image analysis and implementation as FSL. NeuroImage. 2004;23:S208–S219. doi: 10.1016/j.neuroimage.2004.07.051. [DOI] [PubMed] [Google Scholar]
- Tager-Flusberg H, Boshart J, Baron-Cohen S. Reading the windows to the soul: evidence of domain-specific sparing in Williams syndrome. Journal of Cognitive Neuroscience. 1998;10:631–9. doi: 10.1162/089892998563031. [DOI] [PubMed] [Google Scholar]
- Tager-Flusberg H, Plesa-Skwerer D, Faja S, Joseph RM. People with Williams syndrome process faces holistically. Cognition. 2003;89:11–24. doi: 10.1016/s0010-0277(03)00049-0. [DOI] [PubMed] [Google Scholar]
- Tong F, Nakayama K, Moscovitch M, Weinrib O, Kanwisher N. Response properties of the human fusiform face area. Cognitive Neuropsychology. 2000;17:257–279. doi: 10.1080/026432900380607. [DOI] [PubMed] [Google Scholar]
- Ungerleider LG, Mishkin M. Two Cortical Visual Systems. In: Ingle DJ, Goodale MA, Mansfield RJW, editors. Analysis of Visual Behavior. Cambridge, MA: MIT Press; 1982. [Google Scholar]
- Vicari S, Bellucci S, Carlesimo GA. Evidence from two genetic syndromes for the independence of spatial and visual working memory. Developmental Medicine & Child Neurology. 2006;48:126–131. doi: 10.1017/S0012162206000272. [DOI] [PubMed] [Google Scholar]
- Wang PP, Doherty S, Rourke SB, Bellugi U. Unique profile of visuo-perceptual skills in a genetic syndrome. Brain & Cognition. 1995;29:54–65. doi: 10.1006/brcg.1995.1267. [DOI] [PubMed] [Google Scholar]