


Abstract
Because iron toxicity and deficiency are equally life threatening, maintaining intracellular iron levels within a narrow optimal range is critical for nearly all known organisms. However, regulatory mechanisms that establish homeostasis are not well understood in organisms that dwell in environments at the extremes of pH, temperature, and salinity. Under conditions of limited iron, the extremophile Halobacterium salinarum, a salt-loving archaeon, mounts a specific response to scavenge iron for growth. We have identified and characterized the role of two transcription factors (TFs), Idr1 and Idr2, in regulating this important response. An integrated systems analysis of TF knockout gene expression profiles and genome-wide binding locations in the presence and absence of iron has revealed that these TFs operate collaboratively to maintain iron homeostasis. In the presence of iron, Idr1 and Idr2 bind near each other at 24 loci in the genome, where they are both required to repress some genes. By contrast, Idr1 and Idr2 are both necessary to activate other genes in a putative a feed forward loop. Even at loci bound independently, the two TFs target different genes with similar functions in iron homeostasis. We discuss conserved and unique features of the Idr1–Idr2 system in the context of similar systems in organisms from other domains of life.
INTRODUCTION
Iron, a critical element for the physiology of nearly all known organisms, functions as a cofactor and structural component in proteins which drive physiological processes such as aerobic respiration and DNA synthesis (1). However, the solubility of bioavailable iron is low in the presence of oxygen (2). As a result, aerobic iron-requiring biological systems possess inducible high-affinity, energy-driven iron uptake systems (3). For example, siderophores (low–molecular-weight extracellular iron chelators) are secreted into the extracellular environment to chelate iron. Iron-loaded siderophores then cross the membrane through high-affinity uptake systems (4–6). However, when present in excess, iron reacts with hydrogen peroxide generated inside cells by aerobic respiration (7). Resultant reactive oxygen species can damage macromolecules and iron–sulfur cluster cofactors (8–12). Keeping intracellular iron concentration within the optimum range is therefore crucial for physiology and tightly regulated.
Many conserved transcription regulatory systems exist for maintaining iron homeostasis. In yeast, for example, two transcriptional activators, Aft1p and Aft2p (13,14), activate overlapping sets of genes by co-binding relevant promoters in response to iron deficiency (15,16). In bacteria, several classes of transcriptional repressors and activators govern the expression of genes whose products help maintain metal homeostasis, including the DtxR, MerR and Fur protein families. Among these, the DtxR family proteins typically bind metal co-factors to repress uptake genes when metal levels are sufficient (17). During starvation, however, DtxR-regulated promoters are derepressed, allowing the transport of metal into the cell. First identified in pathogenic bacteria (18), DtxR family members have since been discovered in diverse organisms (3). MerR and Fur family proteins, on the other hand, can act as repressors or activators depending on the input stimulus and the extent of posttranscriptional regulation (3,19).
Relative to what is known for the other domains of life, mechanisms regulating metal homeostasis are not well understood in archaea. In general, the archaeal transcriptional machinery is a bacterial–eukaryal hybrid, where the basal apparatus resembles that of the eukaryotic RNA polymerase II and TATA binding proteins (20), while transcriptional activator and repressor proteins function like those found in bacteria (20). These attributes provide a unique standpoint for investigating the evolution of transcriptional mechanisms.
Thus far, five bacterial-like repressor/activator proteins have been implicated in the regulation of metal homeostasis in diverse species of archaea. Two members of a novel TRASH metal-binding domain protein family have been implicated in regulating the copper response, one in Halobacterium salinarum and the other in Sulfolobus solfataricus (21,22). Three DtxR homologs are necessary for manganese and iron homeostasis in diverse species of archaea: (i) SirR has been shown to repress the expression of a metal efflux transport protein-encoding operon in low manganese in H. salinarum (21). These genes are derepressed in a SirR-dependent manner upon the addition of manganese (21); (ii) A DtxR homolog functions as a repressor of iron uptake genes in Thermococcus kodakaraensis (23); and (iii) MDR1 represses its own transcription in a metal-dependent manner in Archaeoglobus fulgidus (24). However, these five regulators are far from the whole story, since at least three other DtxR transcription factor (TF) homologs are encoded in the H. salinarum genome alone (25,26).
We chose H. salinarum as a model system in which to investigate iron response regulation in archaea. This organism requires nearly saturated salt for growth and is typically found in salt lakes and marine salterns (27). There, it is thought to encounter severe and frequent iron limitation (28). Halobacterium salinarum possesses an inducible response system to changes in iron levels in the medium (21,29). Recent work on genome-wide transcription resulted in an environmental gene regulatory inference network (EGRIN) for H. salinarum (30). From this computational model, more than 70 TFs are predicted to control specific groups of target genes in response to a wide array of environmental conditions. Of the four DtxR homologs encoded in the H. salinarum genome (Idr1, Idr2, SirR and TroR), three (Idr2, TroR and SirR) are predicted to influence the expression of cation transport genes in response to a wide array of stress conditions (30). Of these three, only one (SirR) has been characterized (21).
Here, we identify and characterize the function of two DtxR-like metalloregulatory DNA binding proteins, Idr1 and Idr2, in response to changes in iron levels. Epistasis analysis, genome-wide expression profiles and protein–DNA association experiments suggest that Idr1 and Idr2 are bifunctional transcription regulators that bind two putative cis-regulatory motifs. Idr1 and Idr2 independently regulate different genes involved in siderophore biosynthesis and uptake. By contrast, at other promoters, Idr1 and Idr2 bind near one another to regulate gene expression in response to iron. We discuss the conserved and unique features of the interaction between these two TFs relative to other known microbial metal regulatory systems.
MATERIALS AND METHODS
Strains and culturing conditions
Halobacterium salinarum NRC-1 (ATCC700922) was routinely grown in complete medium (CM; 250 g/l NaCl, 20 g/l MgSO4 7H2O, 3 g/l sodium citrate, 2 g/l KCl, 10 g/l peptone) or complete defined medium (CDM, Supplementary Table S1) supplemented with 10 µM MnSO4, 10–100 µM FeSO4, 0.01 µM ZnSO4 and 0.01 µM CuSO4 unless otherwise specified in the text or figures. CDM was prepared with ultrapure salts with minimal trace metal contamination (TraceSelect NaCl, MgSO4 and CuSO4; Sigma, St. Louis, MO; and Puratronic ZnSO4, MnSO4, FeSO4; Alfa Aesar, Ward Hill, MA, USA). Iron levels in CDM medium were determined to be below 0.8 µM by ICP-MS (Supplementary Materials and Methods). Unmarked Δura3 parent and Δidr2, Δidr1, and Δidr1Δidr2 mutant strains were grown in CM or CDM supplemented with 1 mg/ml uracil, whereas idr1::myc and idr2::myc fusion strains were supplemented with 20 µg/ml mevinolin (lovostatin, A.G. Scientific, San Diego, CA, USA) to maintain selection for the epitope-tagged constructs. Any strains grown in CDM were first pre-cultured to mid-logarithmic phase in CM followed by 3-fold washing in CDM prior to inoculation for growth in CDM. CDM and uracil were treated with 10 g/l Chelex resin (BioRad, Hercules, CA, USA) for 1 h and filter sterilized prior to addition of metal supplements and culturing. Prior to growth and microarray experiments in CDM, glassware was treated with 1N HCl or 1N nitric acid for 2 h followed by extensive washing in deionized (18 mΩ filtered) water (Millipore, Billerica, MA, USA).
Strain construction
Unmarked, in-frame deletion mutants of Δidr2 (VNG0835G), Δidr1 (VNG2579G) and Δidr1Δidr2 were prepared by homologous replacement and selection for double crossovers in a uracil auxotroph as previously described (31,32). Construction of in-frame deletion mutants for ΔdpsA, ΔiucA and ΔfepC was described previously (21). For chromatin immunoprecipitation (ChIP)–chip experiments, the complete coding sequence for each of idr1 and idr2 was fused in frame at the C-termini to the epitope tag myc. Cloning details are as described for similar strains in (32) and in the Supplementary Methods section.
High-throughput growth assays
The Δura3 parent, Δidr2, Δidr1, ΔdpsA, ΔiucA, ΔfepC and Δidr1Δidr2 mutant strains were grown in 200 μl triplicate cultures in the conditions indicated in Figure 2, Supplementary Table S1 and Supplementary Figures 2 and 3. Four to six days of continuous growth at ∼225 r.p.m. shaking was monitored in a Bioscreen C (Growth Curves USA, Piscataway, NJ, USA). This instrument was set to measure optical density (O.D.) at 600 nm automatically every 30 min for 200 culture samples simultaneously. At least six biological replicate experiments were conducted for TF mutant strains, yielding 18 replicate growth curves for each strain under each condition. Biological duplicates were conducted for ΔdpsA, ΔiucA and ΔfepC, yielding six replicates. Growth rates were calculated for the parent and each mutant strain on a three-point rolling average. The maximum growth rate (µmax) achieved in mid-logarithmic phase for each strain under each condition was used for further analysis. The average µmax ± SEM from the mean is shown in Figure 2 and Supplementary Figure 3. Significant differences in growth rates between the parent and each mutant strain were calculated by Student’s t-test. Strains for which P < 0.05 are marked with an asterisk in Figure 2. Euclidian distance metrics were calculated using the dist() function in the R statistical analysis package to quantify the difference in growth rate between the double and each of the single mutants and deduce the epistatic relationship between Idr1 and Idr2 (33).
Figure 2.

Epistasis analysis suggests that Idr1 and Idr2 work together in the same genetic pathway. The growth rate of each strain is shown on the y-axis and metal conditions on the x-axis. Note that ‘0 iron’ refers to the fact that no iron was added to the medium. Iron levels in these media formulations were below the detection limits of ICP-MS (≤0.8 µM). Error bars represent ± SEM from the mean of at least six biological replicates and at most 20 (‘Materials and Methods’ section). Asterisks represent P < 0.05 in t-tests comparing the growth rate of the parent strain to those of each mutant. Symbols representing each mutant are described in the legend. Complete data sets for all growth experiments are listed in Supplementary Table S1 and representative growth curve plots are shown in Supplementary Figure S2.
Genome-wide TF-binding site array analysis (ChIP–chip)
Mid-logarithmic phase idr1::myc and idr2::myc cultures grown with or without 100 µM FeSO4 were subjected to ChIP–chip as described in refs. 32, 34 and 35, except that formaldehyde-mediated cross-linking of TF–DNA complexes was performed at room temperature for 30 min. Sonicated DNA was then purified using a protocol modified from (34,35) as described in the Supplementary Materials and Methods. Purified DNA was direct-labeled with Cy3 and Cy5 dyes (Kreatech, Alameda, CA, USA) and hybridized against mock-precipitated DNA fragments (input) to the H. salinarum whole-genome microarray (32,34). This array includes ORFs and intergenic regions tiled at 500-bp resolution, with each tile spotted four times in addition to dye-swapping to rule out dye bias, yielding eight technical replicates per 500-bp tile. Five biological replicate experiments for Idr2 +Fe were conducted (i.e. 40 data points per 500-bp region), three biological replicates for Idr1 +Fe and Idr2 -Fe (24 data points per 500-bp region) and one biological replicate for Idr1 -Fe (8 data points).
TF-binding site location data were analyzed for statistically significant enrichment of features in the immunoprecipitated sample versus the input sample using MeDiChI, a regression-based deconvolution algorithm (36). Significant hits (P < 0.01) from replicate experiments for each strain under each condition were combined using a density-finding algorithm to determine peak locations (32). Genes within 500 bp of the resultant hits that also demonstrated differential expression in the Δidr1 or Δidr2 mutant strains were considered to be direct targets. Genes in operons with the gene nearby the ChIP–chip hits were considered in the analysis as well (37). Idr1 and Idr2 peaks within 500 bp of each other were considered to be shared targets.
One-kilo-base pair sequence regions surrounding each ChIP–chip peak were searched for putative cis-regulatory motif sequences. The WCGAS[C/A]TCGW motif within 500 bp of ChIP–chip hits for Idr1 and Idr2 was identified using MEME with 0–1 motif per sequence and 5–20 bp motif constraints (38). The GTT-N8,9-AAC motif identified previously (24) was detected nearby Idr1 and Idr2 ChIP–chip peaks using the DNA pattern finder function within the Regulatory Sequence Analysis Tools (RSAT) software suite (39). Motifs meeting the following criteria were considered for further analysis: (i) no substitutions from the consensus motifs; (ii) unbiased for genomic position (i.e. coding and non-coding sequences were searched); (iii) located within 500 bp of the open reading frame (ORF) of interest except in rare cases (e.g. proX) where no genes were within 500 bp, in which case the window was expanded to include the two surrounding genes and their operons. Using the Wilcoxon signed-rank test, motif occurrences in 10-fold randomized 1-kb query sequence regions were compared to those found in original query sequence regions. Resultant P-values are reported in the text.
ChIP–qPCR validation of selected Idr2 binding loci
ChIP samples from idr2::myc cells (as described in the ChIP–chip protocol, above) were analyzed by qPCR using primers specific to binding regions as determined by ChIP–chip analysis (Figure 3). Primers (Integrated DNA Technologies, Coralville, IA, USA) were designed according to criteria described in (40) and are listed in the Supplementary Materials and Methods. ChIP samples from trmB::myc cells were run simultaneously as controls, as TrmB is a TF previously shown not to bind at the regions of interest (32). Each 20-µl qPCR reaction contained 25 ng of IP-enriched or mock-precipitated (input) DNA, 0.2 µM each of forward and reverse primers and SYBR Green PCR Master Mix (Applied Biosystems, Carlsbad, CA, USA) to final concentrations of 2 mM MgCl2, 1 mM dNTP and 0.025 U of Amplitaq Gold polymerase. Quantitative analysis was performed in a RotorGene 6000 (QIAGEN, Hilden, Germany) real-time thermocycler for 45 cycles with the following parameters: 95°C for 15 min to activate Taq polymerase, melting for 20 s at 95°C, annealing for 20 s at 55°C and extension and data acquisition for 20 s at 72°C. A melting curve analysis was performed after each run to ensure the specificity of products. Reaction efficiencies were calculated using a three or five-point dilution series of input samples. Each of the four biological replicate samples of Idr2 ChIP were run in triplicate qPCR reactions for a total of 12 data points per sample. Reactions with CT values >0.5 standard deviations from the triplicate mean were excluded from analysis. Enrichment of Idr2 binding at each promoter locus was calculated in each ChIP sample compared to the input sample using relative quantitation against the 3′ end of the gene of interest as described (40). Resultant data reported in Figure 3C represent the mean of the 12 independent trials. Bars marked with asterisks indicate P ≤ 0.05 as determined by Student’s t-test comparisons of enrichment ratios in TrmB versus Idr2 ChIP-qPCR experiments.
Figure 3.

Idr1 and Idr2 bind preferentially in the presence of iron to loci throughout the genome. (A) ChIP–chip binding peaks at sites across the genome. (Left) All Idr1 binding locations detected in the five biological replicate ChIP–chip experiments are depicted as black peaks. (Right) ChIP–chip data are shown for Idr2. On the y-axis, relative enrichment represents the scaled peak intensity for all replicates combined with a density algorithm (‘Materials and Methods’ section). The position of each peak on the chromosome is shown on the x-axis in megabase pairs (Mbp). (B) Representative examples of peaks from the MeDiChI algorithm output. Idr1 targets (top, siderophore transport operon; bottom, xthA endonuclease) are shown on the left. Idr2 targets are shown on the right (top, proX transport operon in the chromosome; bottom, sojC1 cell division protein on the pNRC200 plasmid). Gray arrows depict the direction and location of ORFs along the segments of the chromosome shown on the x-axis. Each ORF is labeled according to its function. Some of these functions are discussed in the text; others are listed in Supplementary Table S2. Gray dotted lines in each peak show the bootstrap confidence range from the MeDiChI model fit, with the innermost line representing the highest confidence. Black peaks represent the best fit to the model (36). Black dots represent raw enrichment ratio data points from representative ChIP–chip experiments. (C) ChIP–qPCR validation of Idr2 binding sites. Primers surrounding the most intense black peaks shown in (B) were used in quantitative PCR experiments to validate the observed ChIP-chip peaks. Error bars represent the ± SEM from the mean of 12 replicate trials. Asterisks represent significant differences (P ≤ 0.05) between the binding enrichments for TrmB compared to those for Idr2.
Microarray
The Δura3 parent, Δidr2 and Δidr1 and Δidr1Δidr2 mutant strains were grown to mid-logarithmic phase (OD600 ∼0.4–0.8) in CDM with all trace metals except iron. Cultures were split in half and FeSO4 was added to one half, while the other was continued under iron limitation. 8-ml samples were collected from each culture every 20 min for 60 min (see also experimental design, Supplementary Figure 1). The zero time point was harvested immediately before the addition of iron. At each time point, samples were removed from the culture, pelleted for 30 s at 15 k.r.p.m. in a microcentrifuge and snap-frozen in liquid nitrogen. Pellets were stored at −80°C overnight and RNA was prepared the following day using the Absolutely RNA miniprep kit according to manufacturer’s instructions (Agilent Technologies, Santa Clara, CA, USA). RNA quality was measured using an Agilent Bioanalyzer as described (32). Freedom from DNA contamination was determined on 200-ng samples of RNA in 25 cycles of PCR. As described above for ChIP–chip, 5 µg RNA were direct-labeled with fluorescent dyes. Labeled RNA from experimental cultures was hybridized against the H. salinarum common reference RNA on the custom H. salinarum ORF microarray as described (41). This array contains 2400 ORFs, each printed in quadruplicate. Dye-swaps were conducted to rule out bias in dye incorporation, resulting in a total of at least eight and at most 16 measurements per gene per time point.
Raw intensity signals from gene expression array and ChIP–chip slides were processed by the SBEAMS-microarray pipeline (42) (www.SBEAMS.org/microarray), where resultant data was median normalized and subjected to variability and error estimates (VERA) analysis. Each data point was assigned a significance statistic, λ, using maximum likelihood (43).
Gene expression array data were analyzed using the TM4 MultiExperiment Viewer (MeV) application (http://www.tm4.org/) and R Bioconductor statistics packages (44) within the Gaggle data analysis environment (45). Gene expression data were first binned into two groups, one including only those genes and operons within 500 bp of ChIP–chip binding peaks for Idr1 and Idr2. The other group of genes did not have ChIP–chip binding peaks nearby. The two resultant gene groups were subjected to significance analysis of microarrays (SAMs) in which the expression profiles of each mutant were compared to the wild type and the two other mutants (e.g. Δidr1 vs. Δidr2, Δura3 parent and Δidr1Δidr2) (Supplementary Table S2). For differentially expressed genes within 500 bp of Idr1 and Idr2 ChIP–chip binding peaks, P-values for overrepresentation of these genes in Gene Ontology (GO) categories were determined using the cumulative hypergeometric distribution (R BioConductor GOStats package) (44) (Figures 4 and 5). Those categories with no P-values listed in the text or in Figure 4 had no annotations in GO and were therefore hand annotated based on protein functional information from several databases (32). Differentially expressed genes with no Idr1 or Idr2 ChIP–chip binding peak nearby are listed Supplementary Table S3. We consider these genes to be subject to indirect transcriptional regulation by Idr1 and Idr2. On those remaining genes with neither differential expression in mutant strains nor ChIP–chip peaks nearby, we performed SAM again, this time testing the effect of iron on gene expression. The resultant genes are listed in a second tab within Supplementary Table S3 and are considered to be Idr1–Idr2 independent but iron responsive.
Figure 4.

Direct target genes of Idr1 and Idr2 are differentially expressed in the corresponding mutant strains. Data shown are genes differentially expressed in the Δidr1, Δidr2 and Δidr1Δidr2 double mutant backgrounds compared to wild type. These genes are also directly bound in their promoters or coding sequences by Idr1 (A) or Idr2 (B). Gene functions are indicated by the text color as described in the legend. Significance of Gene Ontology (GO) functional enrichment of genes in these categories is described in the text. Genes marked with asterisks are those with one or both of the computationally identified cis-regulatory motif sequences within 500 bp of their coding sequence. Gene name labels are listed in Supplementary Table S2 in the same order as depicted in each heatmap. Full details on gene functional annotations and motif sequences can also be found in Supplementary Table S2. Charts shown below each heat map indicate the overlap between the three genome-wide datasets. The first number listed in each circle indicates the number of sites bound in ChIP–chip experiments. The numbers in parentheses indicate the number of genes and operons associated with those sites.
Figure 5.

Idr1 and Idr2 bind at neighboring sites in the genome to influence transcription. (A) The heatmap shows the gene expression profiles of genes bound by both Idr1 and Idr2. Data shown are for genes differentially expressed in the Δidr1Δidr2 double mutant, Δura3 parent strain, and Δidr1 and Δidr2 single mutant strains. GO terms and gene text colors correspond to functional categories as shown in the legend (similar to Figure 4). Asterisks represent those genes with putative cis-regulatory motifs within 500 bp. The red numbers to the left of the hierarchal clustering data in (A) refer to clusters described in the text. The diagrams to the left of the clustering heatmap suggest putative network topologies for how Idr1 and Idr2 could work together (see also text descriptions). Dotted arrow indicates an indirect influence of Idr2 over idr1 gene expression as shown in Supplementary Figure 4. Pointed arrows indicate activation influences, whereas blunted arrows indicate repression influences. (B) Circle chart indicates the overlap between the three genome-wide data sets.
For genes nearby binding peaks shared between Idr1 and Idr2, we performed two-class analysis of variance (ANOVA). In one class, the mutant strains were compared to each other. In the other class, gene expression in the presence versus absence of iron was compared. The resultant 19 differentially expressed genes were then clustered hierarchically. The two main clusters are described in the text and shown in Figure 5. As described above for the epistasis analysis on growth phenotypes, the Euclidean distance was then calculated between mean expression patterns of each cluster in each mutant background. Distance metrics are reported in the text.
RESULTS
Halobacterium salinarum physiology requires iron
Because previous studies have only tested the tolerance of H. salinarum to excess and deficiency of trace metals in complex medium (21,28), we first designed a metal starvation defined medium to control the nutrients provided to the growing organisms. This medium lacks peptone and citrate but contains salts and amino acids with minimal trace metal contamination (Supplementary Table S1). Growth rate in this medium supplemented with varying concentrations of trace metals was determined to be optimum in 100 µM Fe(II), 10 µM Mn(II), 10 nM Cu(II) and 10 nM Zn(II). Although the growth rate of the parent strain changed little during variation from 0 to 10 µM added iron (Figure 2), final culture density was lower in iron-limited cultures after 144 h of growth (Figure 2, Supplementary Table S1, Supplementary Figure 2). Trace metal contamination of this medium was below 0.8 µM (detection limit of ICP-MS, A. Cvetkovic and M.W.W. Adams, personal communication; see Supplementary Materials and Methods), suggesting that H. salinarum grows at low iron concentrations. This confirms growth experiments from other groups, which showed that H. salinarum cannot be completely starved for iron in rich medium, even after the internal iron stores were exhausted by serial passages in low-iron conditions (28,46). By contrast, we observed complete inhibition of growth in the presence of the iron-specific chelator 2,2-dipyridyl (250 µM) in the defined medium (data not shown) (21). We conclude from these growth experiments that the H. salinarum parent strain requires remarkably low levels of iron for growth but that higher levels further stimulate growth.
Identification of two DtxR-like metalloregulatory homologs
As described above, four H. salinarum genes bear significant sequence and structural homology to the DtxR protein family (25,47) (Figure 1A), of which three are computationally predicted to be involved in regulation of metal-responsive genes (30). TroR and SirR are also homologous to the MarR family of antibiotic efflux regulators, of which SirR has been characterized previously (21). Amino acid residues within TroR are highly conserved at critical sites associated with DtxR-type structural regulatory metal binding (1,48) (Figure 1A). By contrast, these residues are altered in Idr1 (VNG2579G) and Idr2 (VNG0835G) (Figure 1A) despite their overall sequence and structural (26) similarity to other DtxR family members.
Figure 1.

DtxR family transcription factors are candidates for the regulation of iron homeostasis in H. salinarum. (A) ClustalW comparison of the four putative DtxR homologs from the H. salinarum genome to those of the DtxR family proteins from other organisms, with representatives from several bacterial and archaeal clades. The black overbar depicts the winged helix–turn–helix DNA-binding domain. Residue locations labeled with a black box have been shown by previous structural studies to bind metal (1,17,48). Conserved residues are labeled underneath the comparison with a star, whereas conservatively substituted residues are labeled with two dots. Mtu, Mycobacterium tuberculosis (Entrez Protein accession is GI:61226440); Cgl, Corynebacterium glutamicum (GI:608593); Hsa, Halobacterium salinarum NRC-1 (idr2, GI:15789985; idr1, GI:15791320; troR, GI:10580129; sirR, GI:15789756); Afu, Archaeoglobus fulgidus (GI:2648555); Tko, Thermococcus kodakaraensis (GI: 57640042); Bsu, Bacillus subtilis (GI:251757298); Mja, Methanococcus jannaschii (GI:1592296). (B) Gene loci surrounding idr2 (above) and idr1 (below). Gray arrows represent open reading frames (ORFs) and the direction of the arrow designates the coding or non-coding strand. Genome coordinates in base pairs (bp) are shown underneath the gray arrows.
Interestingly, we observed that idr1 is divergently transcribed 81 bp away from a gene coding for a putative membrane transport protein with homology to the NUDIX family. This protein contains a CXXC motif within a heavy metal associated domain (HMA), further suggesting a role for Idr1 in metalloregulation (Figure 1B). On the other hand, idr2 is convergently transcribed with the dms operon, which encodes DMSO reductase, a protein complex involved in anaerobic growth that requires molybdopterin as a cofactor (49). These results suggest that Idr1 and Idr2 may play a role in metal homeostasis despite low sequence conservation at metal binding residues.
Idr1 and Idr2 interact genetically and deletion of either alters normal growth characteristics
To investigate the function of Idr1 and Idr2, in-frame single and double deletion mutants were generated and growth rates were measured relative to the isogenic parent strain under varying iron conditions (‘Materials and Methods’ section). Compared to the parent strain, Δidr1 showed a slightly slower growth rate during iron starvation but slightly faster growth in the presence of 10 µM iron (Figure 2). By contrast, Δidr2 was impaired for growth relative to the parent under every iron condition tested (Figure 2). Interestingly, strains deleted for both idr1 and idr2 grew significantly faster than the parent strain, especially upon the addition of 100 µM iron. This phenotypic rescue suggests that deleting idr1 suppresses the Δidr2 phenotype. Using Euclidian distance metrics (‘Materials and Methods’ section), the difference between the growth rates of the double mutant and each of the single mutants was calculated. We observed that the Δidr1 mutant grew at a rate more similar to the double mutant [Euclidian distance (ED) = 5.84 at 100 µM FeSO4] compared with that of Δidr2 (ED = 20.3 at 100 µM FeSO4), indicating that Idr1 may be epistatic to, or downstream of Idr2 (33). Together, these results are consistent with the hypothesis that Idr1 may act downstream of Idr2 as a repressor of Fe-dependent growth. However, the differences between the growth rates Δidr1 and the double mutant at 100 µM iron are also consistent with a more complex relationship between the two TFs.
The Idr1 and Idr2 iron-dependent regulons
In order to further investigate the nature of the interaction between the two TFs, we took a systems biology approach to define the regulons controlled by each of Idr1 and Idr2: (i) TF binding location analysis (ChIP–chip) for each of Idr1 and Idr2 in the presence and absence of iron to identify direct targets (Figure 3, Supplementary Table S4); (ii) gene expression analysis in Δidr1, Δidr2 and Δidr1Δidr2 mutants in the presence and absence of iron to determine which direct targets also exhibit transcriptional dependence on Idr1 and/or Idr2 (Figure 4, 5, Supplementary Table S3, Supplementary Figure 4); and (iii) motif analysis of sequences surrounding the ChIP–chip peak to identify putative cis-regulatory binding consensus sequences (Figures 4 and 5, Supplementary Tables 2 and 4). Genes meeting all three of these criteria were counted as members of the Idr1 and Idr2 regulons (Tables 1–3). Details of the results are described below.
Table 1.
Idr1 regulon
 |
aAll sites were detected on the Chromosome. No Idr1 binding sites were detected on either of the pNRC100 or pNRC200 plasmids. All numbers in the table refer to chromosomal coordinates where the feature of interest was detected.
bColored residues are those that are in the motif. Black residues are outside the motif. Motif 1 is gleaned from Bell et al., 1999, ref. 24. Motif 2 was found computationally in this study.
cBolded entries indicate those loci that are bound in the absence of iron.
dIn the case of large operons, the name of the first gene in the operon is listed.
Genes within 500 bp of Idr1-bound loci that are differentially expressed in the Δidr1 knockout and contain a cis-regulatory motif.
Table 2.
Idr2 regulon
 |
aIndicates which the genomic element on which the Idr2-enriched region was detected. Chr, Chromosome; pNRC100, plasmid 100; pNRC200, plasmid 200.
All numbers in the table refer to coordinates where the feature of interest was detected.
bColored residues are those that are in the motif. Black residues are outside the motif.
cBolded entries indicate those loci that are bound in the absence of iron.
Genes within 500 bp of Idr2-bound loci are listed; these genes are also differentially expressed in the Δidr2 knockout (Figure 4) and contain a cis regulatory motif.
Table 3.
The shared Idr1/Idr2 regulon
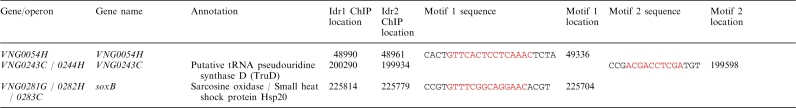 |
Genes within 500 bp of Idr1 and Idr2-bound loci that are differentially expressed in the Δidr1Δidr2 knockout and contain a cis-regulatory motif.
Genome-wide promoter occupancy and gene expression experiments suggest that Idr1 and Idr2 directly regulate iron-responsive genes
To determine if Idr1 and Idr2 bind DNA and to identify direct gene targets, we employed the ChIP–chip method followed by gene expression analysis (32,34). ChIP–chip detects the locations of in vivo TF–DNA interactions across the genome in a two-step process. Briefly, TF–chromatin complexes were cross-linked and immunoprecipitated from cells grown in the presence or absence of added iron (ChIP) (Materials and Methods, Supplementary Methods). DNA fragments were purified from complexes and hybridized against mock-precipitated (‘input’) DNA fragments on the H. salinarum whole-genome microarray (34) (Figure 3). To determine whether Idr1 and Idr2 are involved in repression and/or activation of the genes in the vicinity (within 500 bp) of ChIP–chip binding sites, Δidr1, Δidr2, Δidr1Δidr2 double mutants and the parent strain were grown in iron-starved conditions. Genome-wide transcription patterns were then monitored using microarrays every 20 min for 60 min upon the addition of iron (Supplementary Figure 1, Figures 4 and 5).
Significant enrichment of Idr1-immunoprecipitated DNA fragments compared to mock-precipitated input was detected in the presence of 100 µM iron at 71 sites (169 genes). By contrast, only three sites (10 genes) were enriched in the absence of added iron (Figures 3A and 4A, Table 1, Supplementary Table S4). Therefore, iron-replete conditions appear to enhance Idr1–DNA binding. In the Δidr1 mutant, 82 of the total 179 genes nearby Idr1-bound sites were differentially expressed (Figure 4A). A large fraction of these genes are underexpressed in the Δidr1 mutant background, suggesting that Idr1 is necessary for their activation in response to iron. These genes coded for proteins predicted to function in siroheme biosynthesis (hem3, hemL, etc.; Figure 3A) (GO enrichment P < 3.75 × 10⁻²), iron transport (e.g. hydroxamate siderophore uptake cluster (fhuG/YfmF)) and central metabolism (e.g. amino acid biosynthesis) (Figure 4A; Supplementary Figure 4).
Similar to Idr1, Idr2 appears to bind DNA preferentially in the presence of iron. Only 15 sites, corresponding to 38 genes, were bound in the absence of added iron. By contrast, Idr2 bound to 143 sites (266 genes) throughout the genome in the presence of iron (Figures 3B and 4B, Table 2, Supplementary Tables 2 and 4). In the Δidr2 mutant, 88 of the total 304 genes and operons within 500 bp of Idr2-bound sites were differentially expressed compared to the other three mutant strains (Figure 4B, Supplementary Figure 4). These genes encode proteins involved in several metal trafficking functions, including siderophore production and transport (e.g. iucABC; P < 1.90 × 10⁻³; Idr2-activated), transport of other metals (P < 2.43 × 10⁻³) and molybdenum binding functions (P < 4.45 × 10⁻²; Idr2-repressed). iucA deletion mutants were significantly impaired under iron replete conditions, confirming the predicted function of IucA in iron homeostasis (Supplementary Figure 3). Surprisingly, in the presence of iron, Idr2 also represses genes whose products are predicted to function in other central cellular processes, including transport of other nutrients (3.50 × 10⁻²) [e.g. matE, proX (Figures 4B and 3B)] and cell division functions (sojC1, Figures 4B and 3B). Binding of Idr2 to sites upstream of sojC1 and proX was validated by ChIP–qPCR (Figure 3C). In summary, although a subset of genes is Idr2-activated (e.g. iucABC and other metal trafficking genes), Idr2 represses a large fraction of its target genes in response to iron.
We propose two possible explanations for the observation that approximately half of the Idr1 and Idr2-bound sites in the genome did not show significant expression changes in the Δidr1 and Δidr2 mutants (Supplementary Table S4), a phenomenon frequently reported in ChIP–chip or ChIP–seq studies in other organisms from bacteria to humans (50–54). These are (i) regulatory events subsequent to DNA binding could be required for full transcriptional activity and (ii) other regulatory mechanisms such as regulated transcript degradation or antagonism of Idr1 and/or Idr2-dependent transcription by other TFs could be involved. Here, we have observed that Idr1 and Idr2 DNA binding is stimulated by iron, but because Idr1 and Idr2 metal selectivity has not been determined biochemically, it remains possible that Idr1- and Idr2-dependent transcriptional activity at other sites could require the addition of other metal co-factors.
Conversely, we observed that deletion of Idr1 or Idr2 also resulted in differential regulation of 275 genes that were not bound by either of the two TFs in the ChIP-chip experiments (Supplementary Table S3). For example, Idr1 indirectly repressed the fepC gene, whose product is predicted to be involved in uptake of enterobactin siderophores. Mutants deleted for fepC are impaired for growth under iron-replete conditions, confirming the role of FepC in iron homeostasis (Supplementary Figure 3). It is possible that Idr1 or Idr2 may bind to promoters of some indirectly regulated genes under other conditions or at other time points following iron addition. Alternatively, Idr1 and/or Idr2 may act indirectly through other TFs. In support of the latter hypothesis, our data suggest that Idr1 and Idr2 directly influence the expression of several genes coding for other TFs (e.g. sirR, tfbD, etc., Figure 4).
In addition, we found 72 genes that were differentially expressed in response to iron in the parent and mutant strains (Supplementary Table S3). One of these differentially expressed genes, dpsA, codes for an iron storage protein (55). The dpsA deletion mutant was impaired for growth under iron-replete conditions compared to the wild type, confirming the role of DpsA in iron homeostasis (Supplementary Figure 3). Together, these results suggest that other, unknown TFs besides Idr1 and Idr2 may be involved in regulating iron-responsive gene expression. In conclusion, the ChIP–chip and gene expression data thus far suggest that Idr1 and Idr2 independently regulate different genes coding for iron-trafficking proteins. Thus, when bound independently to different promoters, Idr1 and Idr2 appear to perform parallel but nonredundant functions (Figures 3 and 4).
Idr1 and Idr2 co-regulate a subset of genes
Consistent with this interplay between Idr1 and Idr2, we observed that both Idr1 and Idr2 bound to 23 loci in the genome in the presence of iron. These loci are associated with 35 genes (singlets or operons within 500 bp of ChIP–chip peaks; Supplementary Tables 2 and 4). Binding sites for Idr2 were located, on average, 104 bp away (ranging from 1 to 356 bp) from Idr1 binding sites, which is consistent with the hypothesis that the two TFs may bind in close proximity to each other at shared target loci (Supplementary Table S2, Table 3). Among these 35 genes, 19 were differentially expressed in the Δidr1, Δidr2 and/or Δidr1Δidr2 mutants relative to the parent strain (Figure 5, Supplementary Table S2).
To determine the regulatory relationship between Idr1 and Idr2 at these sites, we performed epistasis analysis on the expression data for co-bound genes as described earlier for the growth assays (Figure 2). Transcription profiles of the 19 genes in each knockout background cluster into two main groups. In the first cluster, transcriptional patterns in the Δidr1 background more closely resemble those of the double mutant (Euclidean distance (ED) = 0.98) than does Δidr2 (ED = 2.50) (Figure 5A). These expression patterns are consistent with results from the growth assays, with Idr1 epistatic to Idr2 (Figure 2). In addition, we observed that the idr1 gene was underexpressed in the Δidr2 deletion mutant compared to wild type (Supplementary Figure 4). However, because Idr2 does not bind to the idr1 promoter (Supplementary Table S2), Idr2 control of idr1 is most likely indirect (Supplementary Table S3). Nevertheless, because Idr1 and Idr2 both bind directly to these sites, these observations are consistent with a putative feed forward loop motif (Figures 5A and 6).
Figure 6.

Model for the interaction between Idr1 and Idr2 in the control of gene expression in response to iron. The model depicts a gene regulatory network under the control of Idr1 and Idr2 based on the data presented in this study. Arrows represent activation influences, whereas blunt-headed lines represent repression. The circles represent Idr1 and Idr2 (TFs). Hexagons depict the clusters of genes under shared control of Idr1 and Idr2. Numbers of the clusters correspond with those shown in Figure 5A. Rectangles depict genes involved in iron homeostasis that are independently controlled by either Idr1 (fhuG/yfmF, genes encoding the hydroxamate siderophore uptake system; hem, siroheme biosynthesis gene cluster) or Idr2 (iucABC, genes encoding a different siderophore uptake system; dmsDABCE, DMSO reductase-coding operon).
In the second cluster, transcription patterns in both Δidr1 and Δidr2 knockouts more closely resemble each other (ED = 2.27) than they do the double mutant (Idr1 ED = 4.84; Idr2 ED = 3.268) (Figure 5). These genes are overexpressed in the double mutant. We therefore hypothesize that Idr1 and Idr2 are both necessary to repress genes in this cluster (AND logic relationship). The function of the majority of genes in both clusters is currently unknown (Table 3). However, some genes in the AND-regulated cluster code for a putative molybdenum cofactor biosynthesis protein and other central cellular functions (Figure 5). Together, these data suggest that, in addition to the independent functions of Idr1 and Idr2 described above, both TFs are necessary for the repression of a subset of genes and for the activation of others.
Putative cis-regulatory binding motif sequences for Idr1 and Idr2 were detected
In order to identify cis-regulatory binding sequences for Idr1 and Idr2, we first searched 1-kb sequence regions surrounding all Idr1 and Idr2 ChIP–chip binding peaks for the consensus sequence previously identified for MDR1 (GTT-N8,9-AAC; P < 10−5), the DtxR homolog from the archaeon Archaeoglobus fulgidus (24). We detected 11 unique motif occurrences within 500 bp of eight Idr1 peaks, 20 occurrences nearby 18 Idr2 peaks and two occurrences nearby each of two co-bound peaks (Table 1–3; Supplementary Tables 2 and 4). Some regions contained more than one instance of this motif. We also searched for additional motifs using computational methods, detecting a putative inverted repeat palindrome, WCGAS[C/A]TCGW (P < 10−5). This motif was located within 500 bp of 13 Idr1 peaks (16 occurrences) and 15 Idr2 peaks (15 occurrences) (Tables 1 and 2, Supplementary Tables 2 and 4). One co-bound locus contained this motif (Table 3; Supplementary Table S2). In future biochemical experiments, it will be interesting to investigate the precise role of these motifs in binding of Idr1 and Idr2 to promoters in the presence of iron.
Data integration to infer Idr1- and Idr2-dependent regulons
In summary, we used three criteria to determine the regulons, or sets of genes, directly controlled by each of Idr1 and Idr2: (i) genes and operons within 500 bp of TF–DNA ChIP–chip binding peaks (37); (ii) genes that were differentially expressed in the Δidr1, Δidr2 and/or Δidr1Δidr2 mutants; and (iii) genes that possessed one or both of the cis-regulatory motifs within 500 bp of the Idr1 and/or Idr2 binding loci. Only genes meeting all three criteria were considered to be members of the Idr1, Idr2 or Idr1/Idr2 shared regulons (Tables 1–3). We detected 12 sites (31 genes) represented in all three data sets for Idr1 (Table 1), 15 sites (28 genes) for Idr2 (Table 2) and three sites (six genes) shared between Idr1 and Idr2 (Table 3). Genes with iron-uptake-related functions were members of each of the Idr1 and Idr2 regulons (Tables 1 and 2). Based on these regulons gleaned from the three integrated systems-level data sets combined with the growth data, we propose the following model (Figure 6).
Under low iron conditions (≤0.8 µM), Idr1 and Idr2 bind to only a few sites throughout the genome (Figure 4). By contrast, when iron levels are replete (100 µM), Idr1 binds to loci encoding iron siderophore uptake transport and siroheme biosynthesis functions and activates their transcription (Figures 3A and 4A, 6, Table 1). Independently, Idr2 binds and activates a separate set of siderophore uptake genes (Figures 3B and 4B, 6, Table 2). At the same time, Idr2 represses genes encoding proteins involved in cell division (sojC1) and metabolism (dmsEABCD) (Figure 4B, Table 2), possibly coordinating growth with iron status. The two TFs also bind at adjacent sites in the same loci to co-regulate a subset of genes in the presence of iron, some of which require both Idr1 and Idr2 for full repression (Figures 5 and 6). Other genes with Idr1–Idr2 co-bound promoters are activated in a putative feed-forward loop motif with Idr2 activating idr1. Considering these functions, we conclude that Idr1 and Idr2 work collaboratively to manage iron homeostasis in H. salinarum (Figure 6).
DISCUSSION
We have identified and characterized transcriptional regulation of the iron response in H. salinarum by two TFs, Idr1 and Idr2. Epistasis analysis of growth rates of single and double mutant strains initially suggested that the two TFs work in the same genetic pathway (Figure 2). TF binding occupancy, gene expression and computational motif identification further suggest that Idr1 and Idr2 work together to regulate genes involved in iron trafficking. For the majority of these genes, each TF binds DNA independently in the presence of iron to modulate transcription of different genes encoding similar functions in iron-trafficking and other central cellular processes (Figures 4 and 5, Tables 1 and 2). However, Idr1 and Idr2 bind together at a subset of targets, acting in concert to activate the transcription of some genes and to repress others. Thus, the systems-level data sets (Figures 3–5, Tables 1–3) confirm and extend the results from growth assays (Figure 2).
These results also confirm and extend the predictions from the EGRIN model for H. salinarum (30). For example, from the model, we predict that Idr2 represses genes in 22 clusters (30), several of which have been confirmed in the present study (Figures 3 and 4). By contrast, Idr1 was not predicted to influence transcription (30). Interestingly, we also detected Idr1- or Idr2-dependent genes involved in functions other than iron uptake in at least two of our data sets (e.g. cell division, membrane biogenesis and molybdenum trafficking; Tables 1–3; Supplementary Table S2), suggesting additional functions for the two TFs. The EGRIN model may have excluded Idr1 and these additional functions from its predictions because transcriptional changes under iron starvation conditions assayed here were not included in the model construction (30). This omission points to a clear need for iterative experimental validation and refinement of mathematical models to accurately decipher cause-and-effect relationships in biological systems.
Although the detailed mechanisms remain to be determined, the H. salinarum Idr1–Idr2 network exhibits features conserved with metalloregulatory pathways in other eukaryotic and bacterial microbial systems. In bacteria, regulatory cascades involving two TFs are common motifs for communication between oxidative stress, iron starvation, and/or heme cofactor biosynthesis pathways (3,6,56). In some cases, such as OxyR-mediated oxidative stress control of Fur in E. coli, the upstream factor activates a downstream repressor (57), with the opposite being true in other organisms (3). Despite frequent occurrence of this general motif, to our knowledge regulatory interplay between two DtxR family members has not yet been recorded; rather, interactions between different TF families appear to be more common (3,6,56,57). In contrast to this inverse relationship between two regulators in bacteria, yeast possesses two TFs, Aft1p and Aft2p, which co-bind the same DNA cis-regulatory motif in an AND logic relationship to coordinately activate genes associated with iron scavenging (58). Remarkably, the complex pattern of regulation exhibited by Idr1 and Idr2 also mirrors that of the relationship between TFs which regulate nutritional development in the slime mold, Dictyostelium (33).
Partnered TFs with similar functions are hypothesized to have several physiological benefits. By acting in pairs, fewer TFs can control an exponentially larger repertoire of target genes (59). In our study, the combined function of Idr1 and Idr2 also expands the number of genes regulated in response to iron (Tables 1–3). Such dual control also buffers against genetic rewiring or mutation to add robustness to the gene regulatory network (60).
SUPPLEMENTARY DATA
Supplementary Data are available at NAR Online.
FUNDING
The National Institutes of Health (P50GM076547, 1R01GM077398-01A2 to N.S.B., 5F32GM078980-02 to A.K.S.); US Department of Energy (ENIGMA: DE-FG02-07ER64327, DE-SC0004877to N.S.B.); National Science Foundation (EF-0313754, EIA-0220153, MCB-0425825, DBI-0640950 to N.S.B.); Duke University startup funds (to A.K.S.). Funding for open access charge: Duke University startup funds (to A.K.S.).
Conflict of interest statement. None declared.
ACKNOWLEDGEMENTS
We are grateful for the work of Aleksandar Cvetkovic and Michael W. W. Adams at University of Georgia in the Department of Biochemistry and Molecular Biology for the ICP-MS analysis of media preparations. We thank Alvin Crumbliss and his lab members for insightful discussions on iron chemistry. We would also like to thank Paul Magwene and Terri Long for discussions regarding transcriptional regulatory networks. All systems-level data sets are available for download at baliga.systemsbiology.net.
REFERENCES
- 1.Feese MD, Ingason BP, Goranson-Siekierke J, Holmes RK, Hol WG. Crystal structure of the iron-dependent regulator from Mycobacterium tuberculosis at 2.0-A resolution reveals the Src homology domain 3-like fold and metal binding function of the third domain. J. Biol. Chem. 2001;276:5959–5966. doi: 10.1074/jbc.M007531200. [DOI] [PubMed] [Google Scholar]
- 2.Boukhalfa H, Crumbliss AL. Chemical aspects of siderophore mediated iron transport. Biometals. 2002;15:325–339. doi: 10.1023/a:1020218608266. [DOI] [PubMed] [Google Scholar]
- 3.Hantke K. Iron and metal regulation in bacteria. Curr. Opin. Microbiol. 2001;4:172–177. doi: 10.1016/s1369-5274(00)00184-3. [DOI] [PubMed] [Google Scholar]
- 4.Goetz DH, Holmes MA, Borregaard N, Bluhm ME, Raymond KN, Strong RK. The neutrophil lipocalin NGAL is a bacteriostatic agent that interferes with siderophore-mediated iron acquisition. Mol. Cell. 2002;10:1033–1043. doi: 10.1016/s1097-2765(02)00708-6. [DOI] [PubMed] [Google Scholar]
- 5.Lesuisse E, Blaiseau PL, Dancis A, Camadro JM. Siderophore uptake and use by the yeast Saccharomyces cerevisiae. Microbiology. 2001;147:289–298. doi: 10.1099/00221287-147-2-289. [DOI] [PubMed] [Google Scholar]
- 6.Moore CM, Helmann JD. Metal ion homeostasis in Bacillus subtilis. Curr. Opin. Microbiol. 2005;8:188–195. doi: 10.1016/j.mib.2005.02.007. [DOI] [PubMed] [Google Scholar]
- 7.Park S, You X, Imlay JA. Substantial DNA damage from submicromolar intracellular hydrogen peroxide detected in Hpx- mutants of Escherichia coli. Proc. Natl Acad. Sci. USA. 2005;102:9317–9322. doi: 10.1073/pnas.0502051102. [DOI] [PMC free article] [PubMed] [Google Scholar]
- 8.Flint DH, Emptage MH, Finnegan MG, Fu W, Johnson MK. The role and properties of the iron-sulfur cluster in Escherichia coli dihydroxy-acid dehydratase. J. Biol. Chem. 1993;268:14732–14742. [PubMed] [Google Scholar]
- 9.Imlay JA. Pathways of oxidative damage. Annu. Rev. Microbiol. 2003;57:395–418. doi: 10.1146/annurev.micro.57.030502.090938. [DOI] [PubMed] [Google Scholar]
- 10.Imlay JA. Cellular defenses against superoxide and hydrogen peroxide. Annu. Rev. Biochem. 2008;77:755–776. doi: 10.1146/annurev.biochem.77.061606.161055. [DOI] [PMC free article] [PubMed] [Google Scholar]
- 11.Touati D. Iron and oxidative stress in bacteria. Arch. Biochem. Biophys. 2000;373:1–6. doi: 10.1006/abbi.1999.1518. [DOI] [PubMed] [Google Scholar]
- 12.Flint DH, Tuminello JF, Emptage MH. The inactivation of Fe-S cluster containing hydro-lyases by superoxide. J. Biol. Chem. 1993;268:22369–22376. [PubMed] [Google Scholar]
- 13.Yamaguchi-Iwai Y, Dancis A, Klausner RD. AFT1: a mediator of iron regulated transcriptional control in Saccharomyces cerevisiae. EMBO J. 1995;14:1231–1239. doi: 10.1002/j.1460-2075.1995.tb07106.x. [DOI] [PMC free article] [PubMed] [Google Scholar]
- 14.Jo WJ, Kim JH, Oh E, Jaramillo D, Holman P, Loguinov AV, Arkin AP, Nislow C, Giaever G, Vulpe CD. Novel insights into iron metabolism by integrating deletome and transcriptome analysis in an iron deficiency model of the yeast Saccharomyces cerevisiae. BMC Genomics. 2009;10:130. doi: 10.1186/1471-2164-10-130. [DOI] [PMC free article] [PubMed] [Google Scholar]
- 15.Blaiseau PL, Lesuisse E, Camadro JM. Aft2p, a novel iron-regulated transcription activator that modulates, with Aft1p, intracellular iron use and resistance to oxidative stress in yeast. J. Biol. Chem. 2001;276:34221–34226. doi: 10.1074/jbc.M104987200. [DOI] [PubMed] [Google Scholar]
- 16.Rutherford JC, Jaron S, Ray E, Brown PO, Winge DR. A second iron-regulatory system in yeast independent of Aft1p. Proc. Natl Acad. Sci. USA. 2001;98:14322–14327. doi: 10.1073/pnas.261381198. [DOI] [PMC free article] [PubMed] [Google Scholar]
- 17.Pennella MA, Giedroc DP. Structural determinants of metal selectivity in prokaryotic metal-responsive transcriptional regulators. Biometals. 2005;18:413–428. doi: 10.1007/s10534-005-3716-8. [DOI] [PubMed] [Google Scholar]
- 18.Tao X, Schiering N, Zeng HY, Ringe D, Murphy JR. Iron, DtxR, and the regulation of diphtheria toxin expression. Mol. Microbiol. 1994;14:191–197. doi: 10.1111/j.1365-2958.1994.tb01280.x. [DOI] [PubMed] [Google Scholar]
- 19.Lee JW, Helmann JD. Functional specialization within the Fur family of metalloregulators. Biometals. 2007;20:485–499. doi: 10.1007/s10534-006-9070-7. [DOI] [PubMed] [Google Scholar]
- 20.Ouhammouch M, Geiduschek EP. An expanding family of archaeal transcriptional activators. Proc. Natl Acad. Sci. USA. 2005;102:15423–15428. doi: 10.1073/pnas.0508043102. [DOI] [PMC free article] [PubMed] [Google Scholar]
- 21.Kaur A, Pan M, Meislin M, Facciotti MT, El-Gewely R, Baliga NS. A systems view of haloarchaeal strategies to withstand stress from transition metals. Genome Res. 2006;16:841–854. doi: 10.1101/gr.5189606. [DOI] [PMC free article] [PubMed] [Google Scholar]
- 22.Ettema TJ, Brinkman AB, Lamers PP, Kornet NG, de Vos WM, van der Oost J. Molecular characterization of a conserved archaeal copper resistance (cop) gene cluster and its copper-responsive regulator in Sulfolobus solfataricus P2. Microbiology. 2006;152:1969–1979. doi: 10.1099/mic.0.28724-0. [DOI] [PubMed] [Google Scholar]
- 23.Louvel H, Kanai T, Atomi H, Reeve JN. The Fur iron regulator-like protein is cryptic in the hyperthermophilic archaeon Thermococcus kodakaraensis. FEMS Microbiol. Lett. 2009;295:117–128. doi: 10.1111/j.1574-6968.2009.01594.x. [DOI] [PubMed] [Google Scholar]
- 24.Bell SD, Cairns SS, Robson RL, Jackson SP. Transcriptional regulation of an archaeal operon in vivo and in vitro. Mol. Cell. 1999;4:971–982. doi: 10.1016/s1097-2765(00)80226-9. [DOI] [PubMed] [Google Scholar]
- 25.Ng WV, Kennedy SP, Mahairas GG, Berquist B, Pan M, Shukla HD, Lasky SR, Baliga NS, Thorsson V, Sbrogna J, et al. Genome sequence of Halobacterium species NRC-1. Proc. Natl Acad. Sci. USA. 2000;97:12176–12181. doi: 10.1073/pnas.190337797. [DOI] [PMC free article] [PubMed] [Google Scholar]
- 26.Bonneau R, Baliga NS, Deutsch EW, Shannon P, Hood L. Comprehensive de novo structure prediction in a systems-biology context for the archaea Halobacterium sp. NRC-1. Genome Biol. 2004;5:R52. doi: 10.1186/gb-2004-5-8-r52. [DOI] [PMC free article] [PubMed] [Google Scholar]
- 27.Robb FT, Place AR, Sowers KR, Schreier HJ, DasSarma S, Fleischmann EM. Archaea: A Laboratory Manual. Cold Spring Harbor, NY: Cold Spring Harbor Laboratory Press; 1995. [Google Scholar]
- 28.Hubmacher D, Matzanke BF, Anemuller S. Iron-uptake in the Euryarchaeon Halobacterium salinarum. Biometals. 2007;20:539–547. doi: 10.1007/s10534-006-9064-5. [DOI] [PubMed] [Google Scholar]
- 29.Hubmacher D, Matzanke BF, Anemuller S. Effects of iron limitation on the respiratory chain and the membrane cytochrome pattern of the Euryarchaeon Halobacterium salinarum. Biol. Chem. 2003;384:1565–1573. doi: 10.1515/BC.2003.173. [DOI] [PubMed] [Google Scholar]
- 30.Bonneau R, Facciotti MT, Reiss DJ, Schmid AK, Pan M, Kaur A, Thorsson V, Shannon P, Johnson MH, Bare JC, et al. A predictive model for transcriptional control of physiology in a free living cell. Cell. 2007;131:1354–1365. doi: 10.1016/j.cell.2007.10.053. [DOI] [PubMed] [Google Scholar]
- 31.Peck RF, Dassarma S, Krebs MP. Homologous gene knockout in the archaeon Halobacterium salinarum with ura3 as a counterselectable marker. Mol. Microbiol. 2000;35:667–676. doi: 10.1046/j.1365-2958.2000.01739.x. [DOI] [PubMed] [Google Scholar]
- 32.Schmid AK, Reiss DJ, Pan M, Koide T, Baliga NS. A single transcription factor regulates evolutionarily diverse but functionally linked metabolic pathways in response to nutrient availability. Mol. Syst. Biol. 2009;5:282. doi: 10.1038/msb.2009.40. [DOI] [PMC free article] [PubMed] [Google Scholar]
- 33.Van Driessche N, Demsar J, Booth EO, Hill P, Juvan P, Zupan B, Kuspa A, Shaulsky G. Epistasis analysis with global transcriptional phenotypes. Nat. Genet. 2005;37:471–477. doi: 10.1038/ng1545. [DOI] [PubMed] [Google Scholar]
- 34.Facciotti MT, Reiss DJ, Pan M, Kaur A, Vuthoori M, Bonneau R, Shannon P, Srivastava A, Donohoe SM, Hood LE, et al. General transcription factor specified global gene regulation in archaea. Proc. Natl Acad. Sci. USA. 2007;104:4630–4635. doi: 10.1073/pnas.0611663104. [DOI] [PMC free article] [PubMed] [Google Scholar]
- 35.Ren B, Robert F, Wyrick JJ, Aparicio O, Jennings EG, Simon I, Zeitlinger J, Schreiber J, Hannett N, Kanin E, et al. Genome-wide location and function of DNA binding proteins. Science. 2000;290:2306–2309. doi: 10.1126/science.290.5500.2306. [DOI] [PubMed] [Google Scholar]
- 36.Reiss DJ, Facciotti MT, Baliga NS. Model-based deconvolution of genome-wide DNA binding. Bioinformatics. 2008;24:396–403. doi: 10.1093/bioinformatics/btm592. [DOI] [PubMed] [Google Scholar]
- 37.Koide T, Reiss DJ, Bare JC, Pang WL, Facciotti MT, Schmid AK, Pan M, Marzolf B, Van PT, Lo FY, et al. Prevalence of transcription promoters within archaeal operons and coding sequences. Mol. Syst. Biol. 2009;5:285. doi: 10.1038/msb.2009.42. [DOI] [PMC free article] [PubMed] [Google Scholar]
- 38.Bailey TL, Williams N, Misleh C, Li WW. MEME: discovering and analyzing DNA and protein sequence motifs. Nucleic Acids Res. 2006;34:W369–W373. doi: 10.1093/nar/gkl198. [DOI] [PMC free article] [PubMed] [Google Scholar]
- 39.Thomas-Chollier M, Sand O, Turatsinze JV, Janky R, Defrance M, Vervisch E, Brohee S, van Helden J. RSAT: regulatory sequence analysis tools. Nucleic Acids Res. 2008;36:W119–W127. doi: 10.1093/nar/gkn304. [DOI] [PMC free article] [PubMed] [Google Scholar]
- 40.Mukhopadhyay A, Deplancke B, Walhout AJ, Tissenbaum HA. Chromatin immunoprecipitation (ChIP) coupled to detection by quantitative real-time PCR to study transcription factor binding to DNA in Caenorhabditis elegans. Nat. Protoc. 2008;3:698–709. doi: 10.1038/nprot.2008.38. [DOI] [PMC free article] [PubMed] [Google Scholar]
- 41.Schmid AK, Reiss DJ, Kaur A, Pan M, King N, Van PT, Hohmann L, Martin DB, Baliga NS. The anatomy of microbial cell state transitions in response to oxygen. Genome Res. 2007;17:1399–1413. doi: 10.1101/gr.6728007. [DOI] [PMC free article] [PubMed] [Google Scholar]
- 42.Marzolf B, Deutsch EW, Moss P, Campbell D, Johnson MH, Galitski T. SBEAMS-Microarray: database software supporting genomic expression analyses for systems biology. BMC Bioinformatics. 2006;7:286. doi: 10.1186/1471-2105-7-286. [DOI] [PMC free article] [PubMed] [Google Scholar]
- 43.Ideker T, Thorsson V, Siegel AF, Hood LE. Testing for differentially-expressed genes by maximum-likelihood analysis of microarray data. J. Comput. Biol. 2000;7:805–817. doi: 10.1089/10665270050514945. [DOI] [PubMed] [Google Scholar]
- 44.Gentleman RC, Carey VJ, Bates DM, Bolstad B, Dettling M, Dudoit S, Ellis B, Gautier L, Ge Y, Gentry J, et al. Bioconductor: open software development for computational biology and bioinformatics. Genome Biol. 2004;5:R80. doi: 10.1186/gb-2004-5-10-r80. [DOI] [PMC free article] [PubMed] [Google Scholar]
- 45.Shannon PT, Reiss DJ, Bonneau R, Baliga NS. The Gaggle: an open-source software system for integrating bioinformatics software and data sources. BMC Bioinformatics. 2006;7:176. doi: 10.1186/1471-2105-7-176. [DOI] [PMC free article] [PubMed] [Google Scholar]
- 46.Hubmacher D, Matzanke BF, Anemuller S. Investigations of iron uptake in Halobacterium salinarum. Biochem. Soc. Trans. 2002;30:710–712. doi: 10.1042/bst0300710. [DOI] [PubMed] [Google Scholar]
- 47.Marchler-Bauer A, Anderson JB, Chitsaz F, Derbyshire MK, DeWeese-Scott C, Fong JH, Geer LY, Geer RC, Gonzales NR, Gwadz M, et al. CDD: specific functional annotation with the Conserved Domain Database. Nucleic Acids Res. 2009;37:D205–D210. doi: 10.1093/nar/gkn845. [DOI] [PMC free article] [PubMed] [Google Scholar]
- 48.D'Aquino JA, Tetenbaum-Novatt J, White A, Berkovitch F, Ringe D. Mechanism of metal ion activation of the diphtheria toxin repressor DtxR. Proc. Natl Acad. Sci. USA. 2005;102:18408–18413. doi: 10.1073/pnas.0500908102. [DOI] [PMC free article] [PubMed] [Google Scholar]
- 49.Muller JA, DasSarma S. Genomic analysis of anaerobic respiration in the archaeon Halobacterium sp. strain NRC-1: dimethyl sulfoxide and trimethylamine N-oxide as terminal electron acceptors. J. Bacteriol. 2005;187:1659–1667. doi: 10.1128/JB.187.5.1659-1667.2005. [DOI] [PMC free article] [PubMed] [Google Scholar]
- 50.Hu Z, Killion PJ, Iyer VR. Genetic reconstruction of a functional transcriptional regulatory network. Nat. Genet. 2007;39:683–687. doi: 10.1038/ng2012. [DOI] [PubMed] [Google Scholar]
- 51.Rahl PB, Lin CY, Seila AC, Flynn RA, McCuine S, Burge CB, Sharp PA, Young RA. c-Myc regulates transcriptional pause release. Cell. 2010;141:432–445. doi: 10.1016/j.cell.2010.03.030. [DOI] [PMC free article] [PubMed] [Google Scholar]
- 52.Cao Y, Yao Z, Sarkar D, Lawrence M, Sanchez GJ, Parker MH, MacQuarrie KL, Davison J, Morgan MT, Ruzzo WL, et al. Genome-wide MyoD binding in skeletal muscle cells: a potential for broad cellular reprogramming. Dev. Cell. 18:662–674. doi: 10.1016/j.devcel.2010.02.014. [DOI] [PMC free article] [PubMed] [Google Scholar]
- 53.Laub MT, Chen SL, Shapiro L, McAdams HH. Genes directly controlled by CtrA, a master regulator of the Caulobacter cell cycle. Proc. Natl Acad. Sci. USA. 2002;99:4632–4637. doi: 10.1073/pnas.062065699. [DOI] [PMC free article] [PubMed] [Google Scholar]
- 54.Shimada T, Ishihama A, Busby SJ, Grainger DC. The Escherichia coli RutR transcription factor binds at targets within genes as well as intergenic regions. Nucleic Acids Res. 2008;36:3950–3955. doi: 10.1093/nar/gkn339. [DOI] [PMC free article] [PubMed] [Google Scholar]
- 55.Zeth K, Offermann S, Essen LO, Oesterhelt D. Iron-oxo clusters biomineralizing on protein surfaces: structural analysis of Halobacterium salinarum DpsA in its low- and high-iron states. Proc. Natl Acad. Sci. USA. 2004;101:13780–13785. doi: 10.1073/pnas.0401821101. [DOI] [PMC free article] [PubMed] [Google Scholar]
- 56.Rudolph G, Hennecke H, Fischer HM. Beyond the Fur paradigm: iron-controlled gene expression in rhizobia. FEMS Microbiol. Rev. 2006;30:631–648. doi: 10.1111/j.1574-6976.2006.00030.x. [DOI] [PubMed] [Google Scholar]
- 57.Zheng M, Doan B, Schneider TD, Storz G. OxyR and SoxRS regulation of fur. J. Bacteriol. 1999;181:4639–4643. doi: 10.1128/jb.181.15.4639-4643.1999. [DOI] [PMC free article] [PubMed] [Google Scholar]
- 58.Rutherford JC, Jaron S, Winge DR. Aft1p and Aft2p mediate iron-responsive gene expression in yeast through related promoter elements. J. Biol. Chem. 2003;278:27636–27643. doi: 10.1074/jbc.M300076200. [DOI] [PubMed] [Google Scholar]
- 59.Bhardwaj N, Carson MB, Abyzov A, Yan KK, Lu H, Gerstein MB. Analysis of combinatorial regulation: scaling of partnerships between regulators with the number of governed targets. PLoS Comput. Biol. 2010;6:e1000755. doi: 10.1371/journal.pcbi.1000755. [DOI] [PMC free article] [PubMed] [Google Scholar]
- 60.Isalan M, Lemerle C, Michalodimitrakis K, Horn C, Beltrao P, Raineri E, Garriga-Canut M, Serrano L. Evolvability and hierarchy in rewired bacterial gene networks. Nature. 2008;452:840–845. doi: 10.1038/nature06847. [DOI] [PMC free article] [PubMed] [Google Scholar]
Associated Data
This section collects any data citations, data availability statements, or supplementary materials included in this article.