

Abstract
Polyamines are a ubiquitous class of polycationic small molecules that can influence gene expression by binding to nucleic acids. Reversible polyamine acetylation regulates nucleic acid binding and is required for normal cell cycle progression and proliferation. Here, we report the structures of Mycoplana ramosa acetylpolyamine amidohydrolase (APAH) complexed with a transition state analogue and a hydroxamate inhibitor, and an inactive mutant complexed with two acetylpolyamine substrates. The structure of APAH is the first of a histone deacetylase-like oligomer and reveals that an 18-residue insert in the L2 loop promotes dimerization and the formation of an 18-Å long “L”-shaped active site tunnel at the dimer interface, accessible only to narrow and flexible substrates. The importance of dimerization for polyamine deacetylase function leads to the suggestion that a comparable dimeric or double-domain histone deacetylase could catalyze polyamine deacetylation reactions in eukaryotes.
The polyamines putrescine, spermidine, and spermine are small, aliphatic polycations present at millimolar intracellular concentrations in all forms of life (1). Polyamines are vital for normal cell-cycle progression and polyamine concentrations increase in rapidly proliferating cells (2, 3). The majority of polyamines exist in the cell as polyamine-RNA complexes and it has been suggested that polyamines influence cell growth by binding to mRNA and altering gene expression (4). The sensitivity of cell-cycle progression to polyamine concentration requires that the enzymes of polyamine metabolism be highly regulated, e.g., by feedback loops that function at both transcriptional and translational levels (5). Dysregulation of polyamine metabolism is common in certain cancers such as prostate cancer, colon cancer, and neuroblastoma, and enzymes of polyamine metabolism can be successfully targeted in emerging chemotherapeutic strategies (6–8).
To date, reversible polyamine acetylation is the least understood aspect of polyamine metabolism. In eukaryotes, reversible polyamine acetylation is initiated in the nucleus, where spermidine is acetylated at the aminobutyl position to target it for export to the cytoplasm (9). A cytoplamsic deacetylase with specificity for N8-acetylspermidine can remove the acetyl group and free the polyamine for reentry into the nucleus or for further modification by the enzymes of polyamine metabolism (10) (Figure 1). While the exact role of reversible polyamine acetylation is unknown, the unique nuclear localization of spermidine N8-acetyltransferase may suggest that acetylation regulates polyamine interaction with nucleic acids, which in turn modulates cell growth. Increased proliferation in L1210 cells treated with an N8-acetylspermidine deacetylase inhibitor also implicates reversible polyamine acetylation in cell growth (11).
Figure 1.

Polyamine metabolism in prokaryotic and eukaryotic cells. Enzymes: 1, arginase; 2, ornithine decarboxylase; 3, spermidine synthase; 4, spermidine/spermine acetyltransferase; 5, polyamine oxidase; 6, acetylpolyamine amidohydrolase; 7, spermine synthetase; 8, spermidine N8-acetyltransferase; 9, N8-acetylspermidine deacetylase.
Although a eukaryotic enzyme responsible for the deacetylation of N8-acetylspermidine has yet to be identified, a prokaryotic polyamine deacetylase with broad substrate specificity has been reported (12). Acetylpolyamine amidohydrolase (APAH) from Mycoplana ramosa is unique among bacterial deacetylases due to its broad specificity toward small and large acetylated polyamines such as acetylputrescine, acetylcadaverine, N1- and N8-acetylspermidine, and acetylspermine (13). APAH shares 20–22% overall amino acid sequence identity with the class II human histone deacetylases (HDACs), and several important sequence motifs are conserved. This relationship suggests that prokaryotic APAH could be an ancient progenitor from which modern eukaryotic class II HDACs evolved (14, 15).
Here, we report the X-ray crystal structure of the Mycoplana ramosa APAH dimer complexed with several ligands, including the substrates acetylspermine and N8-acetylspermidine bound to the inactive H159A mutant. Additionally, we report enzyme activity measurements with various substrates. These structural and functional data illuminate important features of substrate specificity, catalysis, and evolutionary relationships between APAH and the histone deacetylases.
Materials and Methods
Cloning, expression, and purification
Although APAH from Mycoplana ramosa has been cloned and expressed (13), we opted to develop our own expression system. Mycoplana ramosa was obtained from the American Type Culture Collection (ATCC 49678). Cultures were grown according to published conditions (12, 13) using slightly modified growth media (2% peptone, 2% beef extract, 2% D-mannitol, 1.5% yeast extract, 0.3% sodium chloride, and 0.05% manganese chloride). After growing for 26 h at 28 °C, the cells were collected by centrifugation and genomic DNA was isolated according to standard protocols (16).
The gene for APAH was amplified from M. ramosa genomic DNA by using Pfu DNA polymerase (Stratagene, La Jolla, CA) and the primers 5′-CGCAGGGGAGCATATCCATATGCGCGTTATTTTTTCCG-3′ and 5′-GCGCGCAAGCTTACAGGGTCGGTGTCAGCCTGC-3′. The resulting fragment was flanked by NdeI and HindIII restriction sites (boldface) introduced by the forward and reverse primers, respectively. The amplified DNA was isolated from the PCR mix by using a QIAquick Purification Kit (Qiagen, Inc., Valencia, CA) and digested with NdeI and HindIII (New England Biolabs, Beverly, MA; Promega, Madison, WI) according to manufacturer instructions. The plasmid pET-21b (Novagen, Inc., Madison, WI) was digested with the same two restriction enzymes and then treated with calf intestinal alkaline phosphatase (New England Biolabs) to prevent recircularization during subsequent ligation reactions. The linearized plasmid was purified on a 1% agarose gel and then isolated from the gel matrix by using a QIAEX II Gel Extraction Kit (Qiagen, Inc.). The plasmid and insert were ligated together with T4 DNA ligase (Promega) and the resulting mixture was transformed into Novablue competent cells (Novagen, Inc.) that were plated on LB-ampicillin plates (50 μg/mL) and grown overnight at 37 °C. Several colonies with ampicillin resistance were used to inoculate overnight cultures from which plasmid DNA was isolated and tested for the presence of the desired APAH insert by restriction digest with NcoI (Promega). Positive isolates were then sequenced to confirm that the inserted genes contained no errors (DNA Sequencing Facility, University of Pennsylvania School of Medicine).
The pET-21b/APAH plasmid was transformed into E. coli BL21(DE3) cells (Novagen, Inc.) for expression. Cells were grown to saturation in two 5 mL overnight cultures of LB-ampicillin media (100 μg/mL) at 37 °C with 250 rpm shaking. Each 5 mL culture was used to inoculate a 1 L culture of rich induction media (20 g tryptone, 10 g yeast extract, 1 g M9 minimal salts (5X), and 4.7 g NaCl) containing 100 μg/mL ampicillin. Growth continued at 37 °C and 250 rpm until the cultures reached an OD600 ~ 0.5. APAH expression was induced by the addition of 1 mL 1.0 M IPTG and the cells were grown overnight (~16 hours) at 18 °C with 250 rpm shaking. The cells were harvested by centrifugation and resuspended in lysis buffer (20 mM Tris•HCl, pH 8.0, 2 mM DTT, 2 mM MgCl2) containing DNase I (0.6 U/mL) and a Complete, EDTA-free, Protease Inhibitor Cocktail Tablet (Roche). The cells were lysed by sonication with three 2 min pulses at 50% output, 50% duty cycle (Branson Sonifier, Model 450) and then centrifuged at 30,000 rpm for 45 min at 4 °C to separate the soluble and insoluble material.
Following centrifugation of the lysed cells, the soluble supernatant was passed through a 0.22-μm filter and then APAH was precipitated by the addition of solid ammonium sulfate to 40% saturation at 4 °C. The precipitate was collected by centrifugation (30,000 rpm, 30 min) and then redissolved in 12 mL buffer D (20 mM Tris•HCl, pH 8.0, 1 mM DTT). The protein was dialyzed against two 1.0 L volumes of buffer D at 4 °C and then loaded onto a DEAE Sepharose CL-6B column that had been equilibrated in buffer A (20 mM Tris•HCl, pH 8.0, 1 mM DTT, 20 mM NaCl). After washing with 70 mL buffer A, the protein was eluted by a 350 mL linear gradient of buffer A to buffer B (20 mM Tris•HCl, pH 8.0, 1 mM DTT, 500 mM NaCl). APAH eluted at approximately 280 mM NaCl. Fractions containing APAH were identified by SDS-PAGE analysis, pooled and concentrated by ultrafiltration over a YM10 membrane. The protein was then filtered through a 0.22-μm membrane and applied to a Superdex- 200 column (GE Healthcare) equilibrated in 20 mM Tris•HCl, pH 8.0, 50 mM NaCl, and 0.1% sodium azide. Fractions were pooled based on SDS-PAGE analysis and concentrated to 15 mg/mL by ultrafiltration over a YM10 membrane at 4 °C. A 6 μM protein sample run over a NativePAGE Novex 4–16 % Bis-Tris gel (Invitrogen) showed the dimer to be the dominant APAH quaternary structure (data not shown).
Crystallization, structure determination, and refinement
For crystallization, a hanging drop containing 5.0 μL enzyme solution [15 mg/mL APAH, 20 mM Tris (pH 8.0), 50 mM NaCl], 4 μL precipitant buffer [1.0 M sodium phosphate, 0.8 M potassium phosphate, 0.2 M Li2SO4, 0.1 M CAPS (final pH of solution = 6.2)], and 1 μL 30% (w/v) trimethylamine N-oxide (Hampton Research) was equilibrated over a 1.0 mL reservoir of precipitant buffer at 25 °C. Crystals with maximum dimensions 0.3 mm × 0.3 mm × 0.3 mm appeared within two weeks.
Initial diffraction images collected from APAH crystals at the Northeastern Collaborative Access Team (NE-CAT) beamline 24-ID-E at the Advanced Photon Source (APS) at Argonne National Laboratory (ANL) revealed the presence of several crystal lattices grown in different orientations. Using the 20 μm aperture and centering on the corner of the crystal, diffraction from a single lattice was collected and indexed using the program HKL2000 (17). Crystals belonged to space group P1 with unit cell parameters a = 118.3 Å, b = 119.9 Å, c = 119.8 Å, α= 98.3°, β= 95.0°, γ= 115.0° and 11–20 molecules in the unit cell based on the Matthew’s coefficient calculated by CCP4 (18). Self-rotation function calculations performed by the software package GLRF (19) indicated that the unit cell contained six two-fold noncrystallographic symmetry (NCS) axes every ~60°, perpendicular to a central six-fold NCS axis (Figure 2).
Figure 2.

Unit cell contents related by an apparent six-fold NCS axis. The self-rotation function calculated with 10 Å – 4 Å intensity data measured from crystals of the APAHCAPS complex exhibits peaks at κ= 180° and κ= 60°. These data could describe a unit cell containing a central six-fold NCS axis perpendicular to six two-fold NCS axes, but are instead the result of two three-fold axes offset by ~60°(Figure 3).
The initial electron density map was calculated with phases derived from single wavelength anomalous dispersion (SAD). Anomalous diffraction data collected from two crystals soaked overnight in 1.0 M sodium phosphate, 0.8 M potassium phosphate, 0.2 M Li2SO4, and 5 mM potassium tetrachloroplatinate(II) was merged together to create a 1,565-image dataset. Twenty-four platinum sites were located using the program SHLEXD (20) and initial phases were calculated by phenix.autosol (21); phasing statistics are recorded in Table 1. Twelve, NCS-related, polyalanine models of HDAH from Bordetella/Alcaligenes strain FB188 (PDB ID: 1ZZ0) (22) were fit into the initial density at 4 Å resolution by phased-molecular replacement using the program molrep (23). Following mutagenesis and model building using Coot (24), phase extension was performed by phenix.autobuild (21) using data from native crystals that improved the resolution of the structure to 2.6 Å. At this resolution, some differences in the main chains of the protomers were apparent and NCS restraints were not used in the subsequent refinement. Simulated annealing omit maps calculated using CNS (25), later revealed the presence of the buffer molecule CAPS in the active site. The atomic coordinates of water molecules and the CAPS molecule were added in the later stages of refinement. All refinement statistics for the structure of the APAH-CAPS complex determined at higher resolution (2.35 Å) are recorded in Table 1.
Table 1.
Data Collection and Refinement Statistics
| Pt Derivativea | APAH-CAPS | APAH-M344 | H159A APAH-N8-Acetylspermidine | H159A APAH-acetylspermine | |
|---|---|---|---|---|---|
| A. Data Collection | |||||
| Incident wavelength (Å) | 1.07197 | 0.97949 | 0.97949 | 0.97949 | 0.97950 |
| Resolution Range (Å) | 50–3.95 | 50.0–2.35 | 50.0–2.25 | 50.0–2.30 | 50–2.50 |
| No. of reflections (total/unique) | 761,867/101,559 | 759,655/235,850 | 978,958/270,384 | 536,321/221,353 | 732,096/190,942 |
| Completenessb (%) | 100 (99.9) | 98.3 (97.6) | 98.4 (97.2) | 98.1 (97.0) | 98.2 (97.2) |
| I/σ | 14.0 (5.31) | 14.5 (2.50) | 14.8 (2.85) | 7.26 (1.94) | 15.7 (2.32) |
| Rmergec | 0.195 (0.383) | 0.099 (0.600) | 0.096 (0.326) | 0.117 (0.382) | 0.093 (0.558) |
| Figure of merit | 0.311 | ||||
| B. Refinement | |||||
| No. of reflections, work/test sets | 209,132/11,007 | 246,244/12,854 | 197,638/21,958 | 162,244/17,918 | |
| Rwork/Rfreed | 0.189/0.225 | 0.171/0.202 | 0.186/0.227 | 0.190/0.230 | |
| Protein atoms | 30,808 | 30,812 | 30,816 | 30,816 | |
| Solvent atoms | 1,394 | 2,243 | 1,752 | 943 | |
| Ligand atoms | 168 | 264 | 156 | 204 | |
| R.m.s. deviations | |||||
| Bonds (Å) | 0.007 | 0.006 | 0.007 | 0.007 | |
| Angles (°) | 1.3 | 1.2 | 1.2 | 1.2 | |
| Dihedral angles (°) | 23.3 | 23.0 | 23.3 | 23.2 | |
| Improper dihedral angles (°) | 0.8 | 0.9 | 0.8 | 0.9 | |
| Average B factors (Å2) | |||||
| Main chain | 37 | 21 | 25 | 37 | |
| Side chain | 38 | 24 | 26 | 38 | |
| Ligand | 90e | 39f | 50g | 67h | |
| Solvent | 38 | 28 | 28 | 32 | |
| Zn2+ ions | 52i | 26 | 75j | 90k | |
| K+ ions (MVCl site 1) | 32 | 16 | 22 | 34 | |
| Na+ ions (MVCl site 2) | 19 | 19 | 21 | 32 | |
| K+ ions (MVCl site 3) | 87 | 42 | |||
| Ramachandran plot | |||||
| Allowed (%) | 88.4 | 89.9 | 88.7 | 87.9 | |
| Additionally allowed (%) | 11.0 | 9.5 | 10.6 | 11.5 | |
| Generously allowed (%) | 0.4 | 0.3 | 0.6 | 0.6 | |
| Disallowed (%) | 0.1 | 0.4 | 0.1 | 0.0 | |
Bijvoet pairs kept separate for these data.
Numbers in parentheses refer to the outer shell of data.
Rmerge = Σ|I-〈I〉|/ΣI, where I is the observed intensity and 〈I〉 is the average intensity calculated from replicate data.
Rwork = Σ| |Fo| -|Fo| |/Σ|Fo| for reflections contained in the working set, and Rfree = Σ| |Fo| -|Fo| |/Σ|Fo| for reflections contained in the test set held aside during refinement. |Fo| and |Fo| are the observed and calculated structure factor amplitudes, respectively.
Values range from 80 Å2 (chain G) to 99 Å2 (chain F).
Values range from 34 Å2 (chain D) to 47 Å2 (chain I).
Values range from 36 Å2 (chain I) to 64 Å2 (chain A).
Values range from 42 Å2 (chain I) to 82 Å2 (chain F).
Values range from 46 Å2 (chain D) to 59 Å2 (chain F).
Values range from 53 Å2 (chain A) to 106 Å2 (chain G).
Values range from 73 Å2 (chain L) to 115 Å2 (chain K).
MVC, monvalent cation site
Mutagenesis
The H158A, H159A, and Y323F mutants were prepared from the pET- 21b/APAH plasmid using standard protocols outlined in the QuikChange Site-Directed Mutagenesis Kit (Stratagene). The Y323F primers 5′-GTGATGGAAGGTGGCTTCGGCGTTCCGGAGATC-3′ and 5′-GATCTCCGGAACGCCGAAGCCACCTTCCATCAC-3′ contained a single point mutation that altered codon 323 from Tyr (TAC) to Phe (TTC). Primers for both H158A and H159A required silent mutations to lower the melting temperatures of their respective secondary structures. The H158A primers 5′-CTCTGCCGCCCGCCGGGAGCACACGCCGGCATCGACATG-3′ and 5′-CATGTCGATGCCGGCGTGTGCTCCCGGCGGGCGGCAGAG-3′ contained three point mutations within codon 158 (CAC to GCA) and a silent mutation within codon 157 (GGG to GGA). The H159A primers 5′-CCGCCGGGGCACGCAGCAGGCATCGACATGTTC-3′ and 5′-GAACATGTCGATGCCTGCTGCGTGCCCCGGCGG-3′ contained three point mutations within codon 159 (CAC to GCA) and one silent mutation within codon 160 (GCC to GCA). Following PCR mutagenesis and DpnI digestion, the resulting plasmids were transformed into the XL1-Blue supercompetent cells and plated on LB-agar plates containing 100 μg/mL ampicillin. Plasmid DNA isolated from single colonies of transformants was sequenced (DNA Sequencing Facility, University of Pennsylvania School of Medicine) to confirm the incorporation of mutations.
Expression, purification, and crystallization of mutant proteins
Plasmids containing the desired mutations were transformed into E. coli BL21(DE3) cells for overexpression and purification as described for wild-type APAH. H159A APAH was crystallized by the hanging drop vapor diffusion method using the same conditions utilized for the crystallization of wild-type APAH. Crystals were isomorphous with those of the wild-type enzyme (space group P1, unit cell parameters a = 117.5 Å, b = 120.2 Å, c = 118.4 Å, α= 98.5°, β= 94.4°, γ= 115.0°).
APAH-ligand complexes
Crystals of wild-type APAH were soaked overnight in a buffer solution containing 2 mM ZnCl2 and 3.4 M sodium malonate (pH 8.0) and then transferred to a solution containing 1 mM M344 (Sigma), 12 % DMSO, and 2.9 M sodium malonate (pH 8.0) to soak for an additional 24 hours. H159A APAH crystals were soaked overnight in a buffer solution containing 10 mM MnCl2 and 3.4 M sodium malonate (pH 8.0) before being transferred to a solution containing 50 mM acetylpolyamine (N8-acetylspermidine (Fluka) or acetylspermine (Fluka)) and 3.4 M sodium malonate (pH 8.0) to soak for an additional twenty-four hours. All crystals were flash cooled in liquid nitrogen directly from their final soaking solutions. X-ray diffraction data were indexed and scaled using HKL2000 (17). The structures were solved by the difference Fourier technique and refined with CNS (25). All data collection and refinement statistics are recorded in Table 1.
The stereochemical quality of the structures of the APAH-CAPS, APAH-M344, H159A APAH-N8-acetylspermidine, and H159A APAH-acetylspermine complexes was evaluated using PROCHECK (26) and MolProbity (27). Residue H227 was in a disallowed region of the Ramachandran plot for each monomer in the unit cell of the APAH-M344 complex, for monomers D and H of the H159A APAH-N8- acetylspermidine complex, for monomers G, H, and I of the APAH-CAPS complex, and for monomer L of the APAH-acetylspermine complex. However, the conformation of this residue is supported by unambiguous electron density in all cases.
Activity assays
Acetylpolyamine deacetylase activity was measured using a colorimetric assay that quantifies putrescine generation by converting it to γ-aminobutyraldehyde and hydrogen peroxide using diamine oxidase, and then utilizing the hydrogen peroxide product in reaction with vanillic acid and 4-aminoantipyrene to generate quinoneimine (absorbance at λ = 498 nm) (13, 28, 29). Specifically, equal volumes of APAH (1 μM diluted in assay buffer), acetylputrescine (Sigma) (dissolved in water), chromogenic solution (500 μM 4-aminoanitpyrene (Sigma), 1 mM vanillic acid (Aldrich), 4U/mL horseradish peroxidase (Sigma) and 1.32 U/mL diamine oxidase (Sigma) dissolved in assay buffer) and assay buffer (100 mM HEPES (pH 7.4), 10 mM KCl, 4 mM CaCl2, MgCl2 and 280 mM NaCl) were combined and incubated at 37 °C for 60 minutes. The absorbance at 498 nm was recorded using a Beckman DU 520 general purpose UV/Vis spectrophotometer. Relative activity measurements listed in Tables 2 and 3 are a direct comparison of the absorbance at 498 nm minus any background absorbance after 60 minutes of reaction time.
Table 2.
Relative activities of APAH and HDAC8 with various substrates
| AcPuta | L-Lys(ε-acetyl)-coumarin | Acetylated Tetrapeptideb | |
|---|---|---|---|
| APAH | 1.000 | 450 ± 20 | 0.06 ± 0.02 |
| HDAC8 | < 0.002c | 1.000 | 1.000 |
Deacetylase activity measured using the standard polyamine deacetylase assay with acetylputrescine.
Deacetylase activity measured using the HDAC8 substrate N-acetyl-L-Arg-L-His-L-Lys(ε-acetyl)-L-Lys(ε-acetyl)-coumarin.
Lower limit of detection. All measurements were made in triplicate.
Table 3.
Catalytic activities of APAH mutants
| Mutant | Relative activitya | Relative activityb |
|---|---|---|
| wild-type | 1.00 | 1.000 |
| H158A | 0.03 ± 0.02 | 0.0107 ± 0.0008 |
| H159A | < 0.002c | < 0.0013c |
| Y323F | 0.01 ± 0.02 | 0.0018 ± 0.0008 |
Deacetylase activity measured using the standard polyamine deacetylase assay with acetylputrescine.
Deacetylasei activity measured using the Fluor-de-Lys deacetylase substrate used for HDAC assays, L-Lys(ε-acetyl)-coumarin.
Lower limit of detection. All measurements were made in triplicate.
Lysine deacetylase activity was measured using the commercially available Fluor-de-Lys deacetylase substrate (L-Lys(ε-acetyl)-coumarin) and histone deacetylase activity using the Fluor-de-Lys-HDAC8 deacetylase substrate ((acetyl)-L-Arg-L-His-LLys(ε-acetyl)-L-Lys(ε-acetyl)-coumarin) (BIOMOL). Briefly, deacetylation of the substrate molecule allows a protease developer to cleave the peptide bond linking the C-terminal fluorophore, resulting in a shift in fluorescence. Except where noted, assays were run at 25 °C and contained 1 μM enzyme and 150 μM substrate in assay buffer (25 mM Tris (pH 8.2), 137 mM NaCl, 2.7 mM KCl and 1 mM MgCl2). After 30 minutes, reactions were quenched by the addition of 100 μM M344 and the appropriate Fluor-de- Lys developer. Fluorescence was measured using a Fluoroskan II plate reader (ex = 355 nm, em = 460 nm). Relative activity measurements listed in Tables 2 and 3 are a direct comparison of the fluorescence intensity at 460 nm minus any background fluorescence after 30 minutes of reaction time.
Results
Overall structure of APAH
The crystal structure of APAH complexed with the buffer molecule CAPS was solved by single wavelength anomalous dispersion and refined at 2.35 Å resolution (Table 1). The P1 unit cell contains two trimers of dimers (Figure 3), oriented in such a way that two nearly-coincident 3-fold noncrystallographic symmetry (NCS) axes are offset by ~60°, which gives rise to an apparent 6-fold axis in the self-rotation function (Figure 2). Electron density is observed for at least 340 of the 341 residues in all twelve monomers. Each dimer has an average buried surface area of 2,200 Å2. No other protein-protein interface has a buried surface area greater than 640 Å2, suggesting that the dimer is the biologically relevant quaternary structure in accord with size-exclusion HPLC (12) and native gel electrophoresis measurements (data not shown).
Figure 3.

The P1 unit cell in crystals of APAH contains two trimers of dimers. (A) View of APAH unit cell looking along a three-fold NCS axis and (B) a perpendicular two-fold NCS axis.
The isologous dimer interface is formed by extensive nonpolar and hydrogen bond interactions between the L2 loop of one monomer and the L1, L2, and L5 loops of the adjacent monomer (Figure 4A). The majority of L2 loop residues at the dimer interface are contained in a 25-residue insert (A81–I105) that is 18 residues longer than the corresponding 7-residue segments found in the monomeric deacetylases HDLP (30) and HDAC8 (31). The dimer interface forms a ~9 Å deep crevice approximately 15 Å × 12 Å wide, at the bottom of which a ~90° bend leads to a narrower, ~10 Å long tunnel to the catalytic Zn2+ ion (Figure 4B). Thus, the APAH active site is “L”-shaped and accommodates only narrow and flexible substrate molecules. This feature comprises the key structural basis of substrate specificity, since bulkier substrates such as the acetyl-L-lysine residues contained in larger polypeptide substrates are hydrolyzed much less efficiently than acetylpolyamines (Table 2).
Figure 4.

View of the isologous APAH dimer. (A) The L2 loop follows β-strand 2; residues A81-I105 (colored green and yellow in their respective monomers) make extensive hydrophobic and hydrophilic interactions with the adjacent protomer that stabilize the APAH dimer. For reference, the active site Zn2+ ion is shown as a green sphere. (B) Small red spheres trace the “L”-shaped path from the dimer surface to the catalytic Zn2+ ion (green sphere).
The structure of the APAH monomer reveals that despite insignificant amino acid sequence identity, the enzyme adopts the α/β fold first observed for the binuclear manganese metalloenzyme arginase (32), which is also shared by the HDACs (31, 33, 34) and HDAC-like proteins (22, 30). All twelve APAH monomers are very similar in structure, apart from their L8 loops, with pairwise r.m.s. deviations for 331 Cα atoms (excluding the L8 loop) ranging 0.13 – 0.30 Å. The L8 loop contains the catalytic residue Y323. In one monomer from each dimer, this residue is oriented toward the active site (“inward” conformation), and in the second monomer Y323 is oriented toward E34 from a neighboring trimer of dimers (“outward” conformation) (Figure 5). The outward conformation is reminiscent of that observed for H976 and H843 in the catalytic domains of HDAC4 and HDAC7, respectively (33, 34), and for H976Y in HDAC4 (34). It is also reminiscent of the classic outward conformation of Y248 observed in unliganded carboxypeptidase A (35). As for Y248 of carboxypeptidase A, it is possible that Y323 undergoes a conformational change as part of an induced-fit substrate recognition mechanism in APAH.
Figure 5.

Movement of Y323 suggests an induced-fit substrate recognition mechanism. The transition between the inward (green) and outward (yellow) conformations of Y323 involves a ~10 Å movement of the phenolic hydroxyl group and 1–3 Å movements of the polypeptide backbone. Atoms are color-coded as follows: C = green (inward conformation), yellow (outward conformation), or black (CAPS); N = blue; O = red; S = orange; Zn2+ = magenta sphere. In the outward conformation, Y323 donates a hydrogen bond to E34 from a neighboring molecule (gray carbon atoms). Metal coordination and hydrogen bond interactions are indicated by black and orange dashed lines, respectively.
Although both monovalent cation sites conserved in HDAC and HDAC-like enzymes are also present in APAH, the outward conformation of Y323 in APAH also results in a third, low-occupancy monovalent cation site. The L7 loop residues F286, D289, S292, and two water molecules form a K+-binding site located on the surface of the protein (Figure 6). Higher K+ occupancy is observed for this site in monomers where Y323 adopts the outward conformation. Additionally, occupancy of this metal site may contribute to the inhibition of APAH (Figure 7) and HDAC8 (36) observed at elevated K+ concentrations by rigidifying the L7 loop, which would inhibit Y323 movement.
Figure 6.

Third monovalent cation site. The binding of a third K+ ion to residues from the L7 loop (green) is facilitated by the outward conformation of Y323 (yellow) in the adjacent L8 loop. Atoms are color-coded as in Figure 5, except that the K+ ion is represented by a magenta sphere and the two K+-bound water molecules (W1 and W2) are represented by red spheres.
Figure 7.

APAH is inhibited by high concentrations of K+. APAH activity was measured at different KCl concentrations using the Fluor-de-Lys deacetylase assay.
CAPS binds as a transition state analogue
The tetrahedral sulfonate group of CAPS coordinates to the Zn2+ ion in asymmetric bidentate fashion (Zn2+ -O separations of 2.2 and 2.4 Å) to complete a distorted square pyramidal coordination polyhedron (Figure 8A). The zinc-bound sulfonate O1 atom accepts hydrogen bonds from H158 and H159, and the zinc-bound sulfonate O3 atom accepts a hydrogen bond from Y323 (Figure 8B) or a water molecule. Specifically, in monomers B, E, G, I, J, and K, Y323 exclusively adopts the inward conformation to accommodate this hydrogen bond interaction; in monomers A, C, D, F, H, and L, where Y323 remains in the outward conformation to stabilize crystal lattice interactions, a water molecule hydrogen bonded to the backbone NH group of G322 accommodates this hydrogen bond interaction. Notably, the zinc-bound tetrahedral sulfonate anion of CAPS mimics the proposed tetrahedral intermediate in the APAH mechanism (Figure 8C). Therefore, both Zn2+ and Y323 function to stabilize the oxyanion of the tetrahedral intermediate and its flanking transition states.
Figure 8.

The binding of CAPS to APAH mimics the binding of the tetrahedral intermediate. (A) Simulated annealing omit map of CAPS contoured at 4 σ. Metal coordination, hydrogen bond, and cation-π interactions are shown as black, orange, and green dashed lines, respectively. Atoms are color-coded as follows: C = yellow (APAH) or gray (CAPS); N = blue; O = red; S = orange; Zn2+ = magenta sphere. (B) The sulfonate group of CAPS mimics the tetrahedral intermediate that forms during APAH hydrolysis reaction (C).
The location of the sulfonate O1 atom is similar to that expected for the nucleophilic metal-bound solvent molecule. Accordingly, hydrogen bonds with both H158 and H159 suggest either of these residues could serve as a general base that, together with the zinc ion, could promote the nucleophilic attack of metal-bound solvent at the scissile amide carbonyl of the substrate. The sulfonate O2 atom is oriented away from the zinc ion and is located in the region that accommodates the acetyl methyl group of the acetylpolyamine substrate (vide infra).
The aliphatic amino chain of CAPS extends out of the active site tunnel into the crevice at the dimer interface. The positively charged amino group is positioned among the aromatic residues that form the active site entrance, allowing for a cation-π interaction with F225 and a hydrogen bond with the side chain of Y168.
Structure of the H159A-APAH-substrate complexes
The structures of the inactive mutant H159A APAH complexed with the substrates N8-acetylspermidine and acetylspermine were determined at 2.3 Å and 2.5 Å resolution, respectively. These structures provide a clear view of intermolecular interactions that likely occur in the precatalytic enzyme-substrate complex (Figure 9). The side chain of Y323 donates a hydrogen bond to the scissile carbonyl of each substrate in all monomers, which requires a conformational change of Y323 to the inward conformation in monomers A, C, D, F, H, and L. This conformational change is consistent with an induced-fit mechanism for enzyme-substrate recognition and is also facilitated by up to 3 Å movements of adjacent residues in the L8 loop, including G324, V325, and P326 (Figure 5). The scissile carbonyl of the substrate also coordinates to Zn2+ with a zinc-oxygen separation of 2.2 Å. This demonstrates that both Zn2+ and Y323 can function to polarize the scissile carbonyl, which would make it more reactive with a nucleophilic solvent molecule promoted by Zn2+ and a general base (either H158 or H159). However, electron density is not visible for a zinc-bound solvent molecule in this complex. Possibly, this is a consequence of the H159A substitution, since the loss of a hydrogen bond could affect the position and/or stability of a metal-bound solvent molecule.
Figure 9.

Acetylpolyamine binding in the active site of H159A APAH. Atoms are colorcoded as follows: C = yellow (H159A APAH-N8-acetylspermidine complex), green (adjacent monomer in H159A APAH-N8-acetylspermidine complex), or gray (APAHCAPS complex); N = blue; O = red; Zn2+ = magenta sphere; water molecules are shown as red spheres. (A) Simulated annealing omit map of N8-acetylspermidine contoured at 4.5 σ. Metal coordination, hydrogen bond, electrostatic, and cation-π interactions are shown as black, orange, pink, and green dashed lines, respectively. The side chain of E106 (green) is from the adjacent monomer. Conformational changes of Y323, E117, and E106 accommodate substrate binding as compared with the wild-type enzyme complexed with CAPS (gray). (B) Simulated annealing omit map of acetylspermine contoured at 5 σ.
Acetylpolyamine-APAH complexes reveal general features of substrate recognition in the APAH active site (Figure 9). The N4 secondary amino group of both substrate molecules makes a hydrogen bond or an electrostatic interaction with E117 (N---O separations range 3.1–3.9 Å for N8-acetylspermidine and 2.7–3.2 Å for acetylspermine) and a cation-π interaction with the aromatic side chain of F225. The N1 and N9 amino groups of N8-acetylspermidine and acetylspermine, respectively, donate hydrogen bonds to the carboxylate group of E106 from the adjacent monomer, and the primary amino group (N12) of acetylspermine donates a hydrogen bond to Y19. Both E106 and E117 undergo a conformational change to accommodate substrate binding (Figure 9A). These interactions are likely to confer substantial specificity for polyamine substrates.
Structure of the APAH-M344 complex
The structure of APAH in complex with the hydroxamate inhibitor M344 (Figure 10) was determined at 2.25 Å resolution. In each monomer, the hydroxamate moiety of the inhibitor makes a 5-membered ring chelate with the active site zinc ion. This characteristic binding mode was first observed for hydroxamate binding to the zinc protease thermolysin (37). In the APAH-M344 complex, the hydroxylamine oxygen also makes a hydrogen bond with H158, while the hydroxylamine nitrogen makes a hydrogen bond with H159. In monomers where Y323 is in the outward conformation, a water molecule donates a hydrogen bond to the carbonyl oxygen of M344. This water molecule also accepts a hydrogen bond from the backbone NH group of G322 and corresponds to a water molecule observed in the active sites of HDAC4 and HDAC7 (33, 34). In monomers where Y323 does not exclusively adopt an outward conformation, there is weak density for this residue in both the inward and outward conformations. The disorder of Y323 may be caused by a steric clash with the inhibitor.
Figure 10.
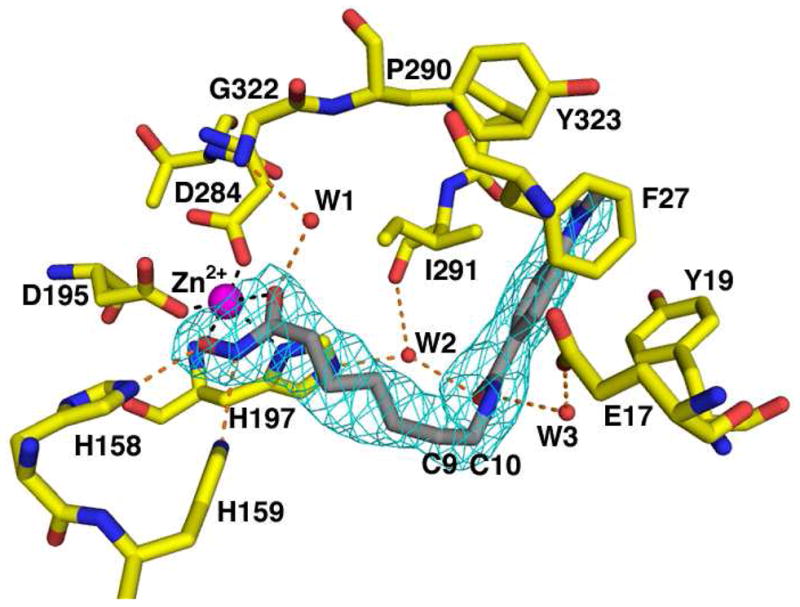
The binding of M344 to APAH illustrates the importance of flexibility in a simulated annealing omit map of M344 (contoured at 4 σ). Atoms are color-coded as in Figure 9. The side chain of Y323 adopts the outward conformation and water molecule W1 donates a hydrogen bond to the zinc-bound hydroxamate carbonyl. Metal coordination and hydrogen bond interactions are shown as black and orange dashed lines, respectively. The “L”-shaped bend of the inhibitor between carbon atoms 9 and 10 (C9 and C10, respectively) reflects the “L”-shaped bend in the active site contour.
The aliphatic linker segment of M344 resides in the active site tunnel between residues Y168 and F225 and turns abruptly at the C9 and C10 positions, which gives the benzamide portion of the inhibitor a roughly perpendicular orientation relative to its hydroxamate group and aliphatic chain. Both the nitrogen and oxygen of the benzamide moiety participate in water-mediated hydrogen bonds with the side chains of E17 and H197, and the backbone C=O of I291. The dimethylaniline moiety of M344 fits into a groove on the protein surface formed by Y19 and F27 on one side and P290 and I291 on the other.
Site-directed mutagenesis
Based on analysis of the crystal structures of the wild-type enzyme complexes, we prepared the H158A, H159A, and Y323F mutants of APAH. Relative activities for the hydrolysis of acetylputrescine are recorded (Table 3). We discovered that APAH exhibits significant catalytic activity against the HDAC assay substrate L-Lys(ε-acetyl)- coumarin, so we also include relative activities using this substrate (Table 3). In brief, all three mutations resulted in significant activity losses, consistent with the important catalytic functions hypothesized for these residues.
While it is clear that Y323 serves to polarize the scissile carbonyl of the substrate based on the crystal structure data, the specific functions of H158 and H159 are less clear. Both of these residues can interact with a zinc-bound solvent molecule in the native enzyme, and both of these residues interact with the corresponding oxygen atom of the tetrahedral intermediate as represented by the binding of CAPS. As for the corresponding histidine pair of HDAC8, computational simulations suggest that H143 (HDAC8 H143 corresponds to APAH H159) is both the general acid and general base (38), while enzymological and mutagenesis studies suggest that H143 is the general base and that H142 (HDAC8 H142 corresponds to APAH H158) is either the general acid or an electrostatic catalyst that stabilizes the developing negative charge of the tetrahedral intermediate (36). Given that APAH activity is more sensitive to mutation of H159 than H158 (Table 3), and given that H159 would be closer to the amide nitrogen of the acetylpolyamine substrate (Figure 9), it is possible that H159 could serve as both the general acid and the general base. Future enzymological studies will pinpoint the specific function of this histidine pair in general acid-general base catalysis by APAH.
Discussion
Structural inferences on the catalytic mechanism
The first step in APAH-substrate recognition involves the coordination of the scissile carbonyl to Zn2+ and hydrogen bonding with Y323. With 12 independent copies of the APAH monomer in the unit cell, our data show that Y323 can sample alternate conformations that place it up to 10 Å away from the active site. Only upon binding of the acetylpolyamine substrate does Y323 adopt an exclusive inward conformation. Similar conformations observed for H976Y of HDAC4 (34), along with the strict conservation of the flexible, glycine-rich segment GG(Y/H) preceding the catalytic Y/H in the L8 loop, suggest that this induced-fit substrate binding mechanism could be shared by all HDAC and HDAC-like enzymes.
The molecular recognition of acetylpolyamines in the APAH active site is illustrated by the structures of H159A APAH complexed with N8-acetylspermidine and acetylspermine. A key feature of polyamine recognition is the hydrogen bond or electrostatic interaction of the secondary amino group at N4 with E117 and its cation-π interaction with F225. Residue E117 is better positioned to accept a hydrogen bond from a polyamine aminopropyl group than an aminobutyl group, as evidenced by shorter hydrogen bond interactions with the aminopropyl group of acetylspermine (vide supra). This result is consistent with the lower KM value of 0.13 mM measured for acetylspermine (which contains an aminopropyl group) compared with that of 0.31 mM measured for N8-acetylspermidine (which contains an aminobutyl group) (13). The acetylpolyamine carbon chain can extend out into the crevice between dimers where potential hydrogen bonding partners are available, including Y19 and E106 of the adjacent monomer. These residues interact with the positively charged amino groups of polyamines and demonstrate that both enzyme subunits contribute to substrate recognition and discrimination.
Evolution of substrate specificity
The structure of M. ramosa APAH reveals important differences with arginase and arginase-related metalloenzymes such as the HDACs. The most distinguishing feature of M. ramosa APAH is the 18-residue insertion between helices B2 and B3 in the L2 loop. The elongated L2 loop of APAH makes extensive hydrophobic and hydrophilic interactions that stabilize dimer assembly (Figure 4A). Dimer formation appears to be critical for APAH substrate specificity, in that the “L”-shaped active site tunnel formed by the dimer interface confers specificity toward substrates that are sufficiently narrow and flexible to fit in this tunnel. Thus, the L2 loop insertion signals dimeric quaternary structure and can be used to distinguish putative polyamine deacetylases from other monomeric class II HDAC-like enzymes, such as HDAH, which could possibly deacetylate bulkier substrates.
The recently solved X-ray crystal structure of the Burkholderia pseudomallei APAH dimer (PDB ID: 3MEN; 34% sequence identity with M. ramosa APAH) contains a 16- residue L2 loop insertion (A79-R101) between helices B2 and B3. Although there is little sequence conservation between the L2 loop insertions of the M. ramosa and B. pseudomallei enzymes, the B. pseudomallei L2 loop makes extensive interactions with the adjacent monomer to stabilize dimer assembly and the formation of an “L”-shaped active site tunnel. Thus, while the L2 loop insertions of polyamine deacetylases may vary across species, their role in promoting dimerization is conserved. Interestingly, the substrate-binding residues E106 and E117 of M. ramosa APAH are not conserved in B. pseudomallei APAH. Therefore, it is possible that B. pseudomallei APAH is misannotated as a polyamine deacetylase and its in vivo function has yet to be determined.
The hypothesis that dimer formation confers substrate specificity in polyamine deacetylases is in accord with the results of APAH activity assays (Table 2). While APAH exhibits significant activity against the smaller HDAC assay substrate L-Lys(ε-acetyl)-coumarin, the significantly reduced APAH activity against the larger tetrapeptide HDAC substrate (acetyl)-L-Arg-L-His-L-Lys(ε-acetyl)-L-Lys(ε-acetyl)- coumarin is consistent with the constrained active site resulting from dimer assembly. Oligomerization is common for certain class I and II HDACs and HDAC-like enzymes (39) and the dimeric quaternary structure of APAH provides the first illustration of how oligomerization can regulate the substrate specificity of an HDAC-like enzyme.
Since homologues of bacterial APAH are conserved in mammals as class II HDACs, it is possible that one or more of these enzymes exhibit activity against acetylpolyamine substrates (39). Notably, the N8-acetylspermidine deacetylase activity first reported by Blankenship (10) was observed in cytoplasmic extracts from rat organs, but the enzyme responsible for this activity was never isolated. The observed N8- acetylspermidine deacetylase activity was highest in the liver, spleen, and kidney (10), and was resistant to inhibition by sodium butyrate (40). Given that genome database mining has yielded eleven HDAC enzymes, it is possible that the enzyme responsible for this cytoplasmic activity is currently annotated as an HDAC. Intriguingly, the class IIb enzymes HDAC6 and HDAC10 are cytosolic and each has two deacetylase domains; unlike the class I and IIa HDACs, both HDAC6 and HDAC10 are resistant to inhibition by sodium butyrate (41). Moreover, HDAC10 is most highly expressed in the liver, spleen, and kidney (42, 43). It is intriguing to speculate that one of these enzymes, or perhaps another cytoplasmic HDAC (a dimer or a two-domain enzyme), could be responsible for the N8-acetylspermidine deacetylation activity observed by Blankenship (10).
Acknowledgments
This work is based upon research conducted at the Advanced Photon Source on the Northeastern Collaborative Access Team beamlines, which are supported by award RR- 15301 from the National Center for Research Resources at the National Institutes of Health. Use of the Advanced Photon Source is supported by the U.S. Department of Energy, Office of Basic Energy Sciences, under Contract No. DE-AC02-06CH11357. Data for this study were also measured at the beamline X25 of the National Synchrotron Light Source. We thank Dr. Daniel Dowling for supplying us with HDAC8 and for helpful scientific discussions. We also thank Dr. Liang Tong for his help with locked-rotation function calculations.
Abbreviations and Textual Footnotes
- APAH
acetylpolyamine amidohydrolase
- CAPS
N-cyclohexyl-3-aminopropanesulfonic acid
- DMSO
dimethyl sulfoxide
- HDAC
histone deacetylase
- HDAH
histone deacetylase-like amidohydrolase
- HDLP
histone deacetylase-like protein
- HPLC
high-performance liquid chromatography
- M344
4-(dimethylamino)-N-[7-(hydroxyamino)-7-oxoheptyl]-benzamide
- NCS
noncrystallographic symmetry
- SAD
single wavelength anomalous dispersion
Footnotes
This work was supported by the National Institutes of Health (D.W.C. GM49758).
The atomic coordinates and structure factors of the APAH-M344, H159A APAH-N8-acetylspermidine, H159A APAH-acetylspermine, and APAH-CAPS complexes have been deposited in the Protein Data Bank (www.rcsb.org) with accession codes 3Q9B, 3Q9C, 3Q9E, and 3Q9F, respectively.
References
- 1.Cohen S. A Guide to the Polyamines. Oxford University Press; New York: 1998. [Google Scholar]
- 2.Oredsson SM. Polyamine dependence of normal cell-cycle progression. Biochem Soc Trans. 2003;31:366–370. doi: 10.1042/bst0310366. [DOI] [PubMed] [Google Scholar]
- 3.Igarashi K, Hara K, Watanabe Y, Hirose S, Takeda Y. Polyamine and magnesium contents and polypeptide synthesis as a function of cell growth. Biochem Biophys Res Commun. 1975;64:897–904. doi: 10.1016/0006-291x(75)90132-1. [DOI] [PubMed] [Google Scholar]
- 4.Igarashi K, Kashiwagi K. Polyamine Modulon in Escherichia coli: genes involved in the stimulation of cell growth by polyamines. J Biochem. 2006;139:11–16. doi: 10.1093/jb/mvj020. [DOI] [PubMed] [Google Scholar]
- 5.Ivanov IP, Atkins JF, Michael AJ. A profusion of upstream open reading frame mechanisms in polyamine-responsive translational regulation. Nucleic Acids Res. 2010;38:353–359. doi: 10.1093/nar/gkp1037. [DOI] [PMC free article] [PubMed] [Google Scholar]
- 6.Gerner EW, Meyskens FL., Jr Polyamines and cancer: old molecules, new understanding. Nat Rev Cancer. 2004;4:781–792. doi: 10.1038/nrc1454. [DOI] [PubMed] [Google Scholar]
- 7.Casero RA, Jr, Marton LJ. Targeting polyamine metabolism and function in cancer and other hyperproliferative diseases. Nat Rev Drug Discovery. 2007;6:373–390. doi: 10.1038/nrd2243. [DOI] [PubMed] [Google Scholar]
- 8.Evageliou NF, Hogarty MD. Disrupting polyamine homeostasis as a therapeutic strategy for neuroblastoma. Clin Cancer Res. 2009;15:5956–5961. doi: 10.1158/1078-0432.CCR-08-3213. [DOI] [PMC free article] [PubMed] [Google Scholar]
- 9.Libby PR. Rat liver nuclear N-acetyltransferases: separation of two enzymes with both histone and spermidine acetyltransferase activity. Arch Biochem Biophys. 1980;203:384–389. doi: 10.1016/0003-9861(80)90190-3. [DOI] [PubMed] [Google Scholar]
- 10.Blankenship J. Deacetylation of N8-acetylspermidine by subcellular fractions of rat tissue. Arch Biochem Biophys. 1978;189:20–27. doi: 10.1016/0003-9861(78)90109-1. [DOI] [PubMed] [Google Scholar]
- 11.Wang Z, Fries D, Blankenship J. Effect of N8-acetylspermidine deacetylase inhibition on the growth of L1210 cells. Biochem Pharmacol. 1999;57:1095–1103. doi: 10.1016/s0006-2952(99)00028-3. [DOI] [PubMed] [Google Scholar]
- 12.Fujishiro K, Ando M, Uwajima T. Crystallization and some properties of acetylpolyamine amidohydrolase from Mycoplana bullata. Biochem Biophys Res Commun. 1988;157:1169–1174. doi: 10.1016/s0006-291x(88)80997-5. [DOI] [PubMed] [Google Scholar]
- 13.Sakurada K, Ohta T, Fujishiro K, Hasegawa M, Aisaka K. Acetylpolyamine amidohydrolase from Mycoplana ramosa: gene cloning and characterization of the metal-substituted enzyme. J Bacteriol. 1996;178:5781–5786. doi: 10.1128/jb.178.19.5781-5786.1996. [DOI] [PMC free article] [PubMed] [Google Scholar]
- 14.Grozinger CM, Hassig CA, Schreiber SL. Three proteins define a class of human histone deacetylases related to yeast Hda1p. Proc Natl Acad Sci U S A. 1999;96:4868–4873. doi: 10.1073/pnas.96.9.4868. [DOI] [PMC free article] [PubMed] [Google Scholar]
- 15.Leipe DD, Landsman D. Histone deacetylases, acetoin utilization proteins and acetylpolyamine amidohydrolases are members of an ancient protein superfamily. Nucleic Acids Res. 1997;25:3693–3697. doi: 10.1093/nar/25.18.3693. [DOI] [PMC free article] [PubMed] [Google Scholar]
- 16.Wilson K. Preparation of genomic DNA from bacteria. Curr Protoc Mol Biol. 1994;1:2.4.1–2.4.5. doi: 10.1002/0471142727.mb0204s56. [DOI] [PubMed] [Google Scholar]
- 17.Otwinowski Z, Minor W. Processing of X-ray diffraction data collected in oscillation mode. Methods Enzymol. 1997;276:307–326. doi: 10.1016/S0076-6879(97)76066-X. [DOI] [PubMed] [Google Scholar]
- 18.Collaborative Computational Project Number 4. The CCP4 suite: programs for protein crystallography. Acta Crystallogr, Sect D: Biol Crystallogr. 1994;50:760–763. doi: 10.1107/S0907444994003112. [DOI] [PubMed] [Google Scholar]
- 19.Tong L, Rossmann MG. Rotation function calculations with GLRF program. Methods Enzymol. 1997;276:594–611. [PubMed] [Google Scholar]
- 20.Pape T, Schneider T. HKL2MAP: a graphical user interface for phasing with SHELX programs. J Appl Crystallogr. 2004;37:843–844. [Google Scholar]
- 21.Adams PD, Afonine PV, Bunkoczi G, Chen VB, Davis IW, Echols N, Headd JJ, Hung LW, Kapral GJ, Grosse-Kunstleve RW, McCoy AJ, Moriarty NW, Oeffner R, Read RJ, Richardson DC, Richardson JS, Terwilliger TC, Zwart PH. PHENIX: a comprehensive Python-based system for macromolecular structure solution. Acta Crystallogr, Sect D: Biol Crystallogr. 2010;66:213–221. doi: 10.1107/S0907444909052925. [DOI] [PMC free article] [PubMed] [Google Scholar]
- 22.Nielsen TK, Hildmann C, Dickmanns A, Schwienhorst A, Ficner R. Crystal structure of a bacterial class 2 histone deacetylase homologue. J Mol Biol. 2005;354:107–120. doi: 10.1016/j.jmb.2005.09.065. [DOI] [PubMed] [Google Scholar]
- 23.Vagin A, Teplyakov A. Molecular replacement with MOLREP. Acta Crystallogr, Sect D: Biol Crystallogr. 2010;66:22–25. doi: 10.1107/S0907444909042589. [DOI] [PubMed] [Google Scholar]
- 24.Emsley P, Lohkamp B, Scott WG, Cowtan K. Features and development of Coot. Acta Crystallogr, Sect D: Biol Crystallogr. 2010;66:486–501. doi: 10.1107/S0907444910007493. [DOI] [PMC free article] [PubMed] [Google Scholar]
- 25.Brunger AT. Version 1.2 of the Crystallography and NMR system. Nat Protoc. 2007;2:2728–2733. doi: 10.1038/nprot.2007.406. [DOI] [PubMed] [Google Scholar]
- 26.Laskowski RA, MacArthur MW, Moss DS, Thornton JM. PROCHECK: a program to check the stereochemical quality of protein structures. J Appl Crystallogr. 1993;26:283–291. [Google Scholar]
- 27.Chen VB, Arendall WB, 3rd, Headd JJ, Keedy DA, Immormino RM, Kapral GJ, Murray LW, Richardson JS, Richardson DC. MolProbity: all-atom structure validation for macromolecular crystallography. Acta Crystallogr, Sect D: Biol Crystallogr. 2010;66:12–21. doi: 10.1107/S0907444909042073. [DOI] [PMC free article] [PubMed] [Google Scholar]
- 28.Allain CC, Poon LS, Chan CS, Richmond W, Fu PC. Enzymatic determination of total serum cholesterol. Clin Chem. 1974;20:470–475. [PubMed] [Google Scholar]
- 29.Holt A, Palcic MM. A peroxidase-coupled continuous absorbance plate-reader assay for flavin monoamine oxidases, copper-containing amine oxidases and related enzymes. Nat Protoc. 2006;1:2498–2505. doi: 10.1038/nprot.2006.402. [DOI] [PubMed] [Google Scholar]
- 30.Finnin MS, Donigian JR, Cohen A, Richon VM, Rifkind RA, Marks PA, Breslow R, Pavletich NP. Structures of a histone deacetylase homologue bound to the TSA and SAHA inhibitors. Nature. 1999;401:188–193. doi: 10.1038/43710. [DOI] [PubMed] [Google Scholar]
- 31.Somoza JR, Skene RJ, Katz BA, Mol C, Ho JD, Jennings AJ, Luong C, Arvai A, Buggy JJ, Chi E, Tang J, Sang BC, Verner E, Wynands R, Leahy EM, Dougan DR, Snell G, Navre M, Knuth MW, Swanson RV, McRee DE, Tari LW. Structural snapshots of human HDAC8 provide insights into the class I histone deacetylases. Structure. 2004;12:1325–1334. doi: 10.1016/j.str.2004.04.012. [DOI] [PubMed] [Google Scholar]
- 32.Kanyo ZF, Scolnick LR, Ash DE, Christianson DW. Structure of a unique binuclear manganese cluster in arginase. Nature. 1996;383:554–557. doi: 10.1038/383554a0. [DOI] [PubMed] [Google Scholar]
- 33.Schuetz A, Min J, Allali-Hassani A, Schapira M, Shuen M, Loppnau P, Mazitschek R, Kwiatkowski NP, Lewis TA, Maglathin RL, McLean TH, Bochkarev A, Plotnikov AN, Vedadi M, Arrowsmith CH. Human HDAC7 harbors a class IIa histone deacetylase-specific zinc binding motif and cryptic deacetylase activity. J Biol Chem. 2008;283:11355–11363. doi: 10.1074/jbc.M707362200. [DOI] [PMC free article] [PubMed] [Google Scholar]
- 34.Bottomley MJ, Lo Surdo P, Di Giovine P, Cirillo A, Scarpelli R, Ferrigno F, Jones P, Neddermann P, De Francesco R, Steinkuhler C, Gallinari P, Carfi A. Structural and functional analysis of the human HDAC4 catalytic domain reveals a regulatory structural zinc-binding domain. J Biol Chem. 2008;283:26694–26704. doi: 10.1074/jbc.M803514200. [DOI] [PMC free article] [PubMed] [Google Scholar]
- 35.Christianson DW, Lipscomb WN. Carboxypeptidase A. Acc Chem Res. 1989;22:62–69. [Google Scholar]
- 36.Gantt SL, Joseph CG, Fierke CA. Activation and inhibition of histone deacetylase 8 by monovalent cations. J Biol Chem. 2010;285:6036–6043. doi: 10.1074/jbc.M109.033399. [DOI] [PMC free article] [PubMed] [Google Scholar]
- 37.Holmes MA, Matthews BW. Binding of hydroxamic acid inhibitors to crystalline thermolysin suggests a pentacoordinate zinc intermediate in catalysis. Biochemistry. 1981;20:6912–6920. doi: 10.1021/bi00527a026. [DOI] [PubMed] [Google Scholar]
- 38.Wu R, Wang S, Zhou N, Cao Z, Zhang Y. A proton-shuttle reaction mechanism for histone deacetylase 8 and the catalytic role of metal ions. J Am Chem Soc. 2010;132:9471–9479. doi: 10.1021/ja103932d. [DOI] [PMC free article] [PubMed] [Google Scholar]
- 39.Gregoretti IV, Lee YM, Goodson HV. Molecular evolution of the histone deacetylase family: functional implications of phylogenetic analysis. J Mol Biol. 2004;338:17–31. doi: 10.1016/j.jmb.2004.02.006. [DOI] [PubMed] [Google Scholar]
- 40.Marchant P, Dredar S, Manneh V, Alshabanah O, Matthews H, Fries D, Blankenship J. A selective inhibitor of N8-acetylspermidine deacetylation in mice and HeLa cells without effects on histone deacetylation. Arch Biochem Biophys. 1989;273:128–136. doi: 10.1016/0003-9861(89)90170-7. [DOI] [PubMed] [Google Scholar]
- 41.Guardiola AR, Yao TP. Molecular cloning and characterization of a novel histone deacetylase HDAC10. J Biol Chem. 2002;277:3350–3356. doi: 10.1074/jbc.M109861200. [DOI] [PubMed] [Google Scholar]
- 42.Kao HY, Lee CH, Komarov A, Han CC, Evans RM. Isolation and characterization of mammalian HDAC10, a novel histone deacetylase. J Biol Chem. 2002;277:187–193. doi: 10.1074/jbc.M108931200. [DOI] [PubMed] [Google Scholar]
- 43.Tong JJ, Liu J, Bertos NR, Yang XJ. Identification of HDAC10, a novel class II human histone deacetylase containing a leucine-rich domain. Nucleic Acids Res. 2002;30:1114–1123. doi: 10.1093/nar/30.5.1114. [DOI] [PMC free article] [PubMed] [Google Scholar]