Abstract
The effect of varying short-chain alkyl substitution of the indole nitrogens on the spectroscopic properties of cyanine dyes was examined. Molar absorptivities and fluorescence quantum yields were determined for a set of pentamethine dyes and a set of heptamethine dyes for which the substitution of the indole nitrogen was varied. For both sets of dyes, increasing alkyl chain length resulted in no significant change in quantum yield or molar absorptivity. These results may be useful in designing new cyanine dyes for analytical applications and predicting their spectroscopic properties.
Keywords: cyanine dyes, spectroscopy, quantum yield, molar absorptivity, substitution effects
Introduction
Cyanine dyes are a class of conjugated, fluorescent molecules with polymethine chromophores composed of an odd number of carbon atoms. These dyes exhibit unusually long-wavelength absorbance and fluorescence relative to the size of their chromophores, typically absorbing light in the visible to near infrared (NIR) region.1 These compounds were originally utilized as sensitizing additives to photographic emulsions, but their unique structural and photophysical characteristics have since proven useful for a wide variety of other applications requiring photosensitive materials, such as optical recording media and solar cells.2–4 Additionally, cyanine dyes can be used as fluorescent labels of both proteins and DNA, thereby greatly enhancing the sensitivity of fluorescence detection for these types of biomolecules.5–7 NIR-absorbing cyanine dyes are particularly well-suited for use as fluorescent labels of proteins and nucleic acids, as there is no interfering autofluorescence from biomolecules at these long wavelengths, and have been applied to both in vitro analytical studies and in vivo biomedical imaging.5–9 Due to the tremendous utility and versatility of this class of compounds, significant research efforts are being directed at developing new cyanine dyes functionalized for specific applications and optimizing the properties of these dyes.
In the process of developing new dyes, it is important to determine how varying the heteroaromatic ring nitrogen substituents influences spectroscopic behavior. Cyanine dye structures are commonly modified at these positions to enhance binding interactions, make the dyes pH sensitive, or improve their solubility in various solvents. Understanding how these modifications may influence the absorption characteristics and quantum efficiency is important for designing new compounds with specific functional and spectroscopic characteristics. Cyanine dyes in the excited singlet state can decay back to the ground state through four major pathways: fluorescence, intersystem crossing, internal conversion, and photoisomerization. Of the radiationless decay processes, it has been suggested that photoisomerization is the most significant, followed by internal conversion.10,11 The extent of photoisomerization has been shown to be dependent on dye rigidity,12 which may be influenced by both backbone structure and side chain substitution. By introducing rigidifying structures or rotation-hindering bulky substituents, photoisomerization would be expected to decrease with a corresponding increase in quantum yield.13,14
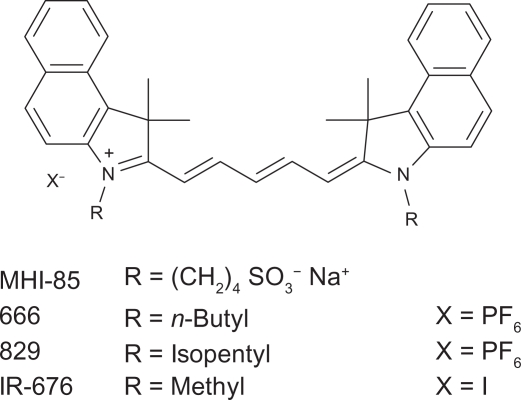
The purpose of this study was to investigate the effect of varying alkyl group length substitution of the indole ring nitrogen on the molar absorptivities and quantum yields of cyanine dyes. Molar absorptivities (ɛ) of each dye were calculated as per the Beer-Lambert law, and fluorescence quantum yields (φ) were determined by a relative method. Two classes of cyanine dyes were studied: pentamethine cyanine dyes and ring-stabilized heptamethine cyanine dyes. These two different dye “backbones”, which differ in terms of the substitution and length of the polymethine chain as well as the heterocyclic moieties at either end of the polymethine chain, were chosen as models to ensure that the observed results are widely applicable to a range of cyanine dyes, rather than peculiar to one subgroup of dyes. The pentamethine cyanine dyes studied all had a 4,5:4′,5′-Dibenzo-3,3,3′,3′-tetramethylindadicarbocyanine backbone, the structure of which is shown in Figure 1.
Figure 1.
Structure of pentamethine cyanine backbone and substituents in dyes studied.
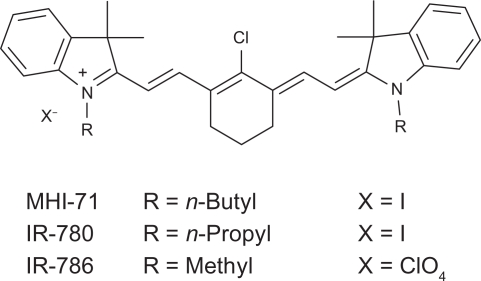
The heptamethine cyanine dyes studied all had a 2-[2-[2-Chloro-3-[(1,3-dihydro-3,3-dimethyl-1-propyl-2H-indol-2-ylidene)ethylidene]-1-cyclohexen-1-yl]ethenyl]-3,3-dimethyllindolium backbone, the structure of which is shown in Figure 2.
Figure 2.
Structure of heptamethine cyanine backbone and substituents in dyes studied.
Experimental
Instrumentation
Absorbance spectra were measured using a Perkin-Elmer Lambda 20 UV-Visible Spectrophotometer (Perkin-Elmer Incorporated, Waltham, MA) interfaced to a PC, with a spectral bandwidth of 2 nm. Fluorescence spectra for the pentamethine cyanine dyes were obtained using a Shimadzu RF-1501 Spectrofluorophotometer ( Shimadzu Scientific Instruments, Columbia, MD) interfaced to a PC, with the spectral bandwidths for both excitation and emission set to 10 nm and the sensitivity set to “high”. Fluorescence spectra for the heptamethine cyanine dyes were obtained using a ISS K2 Multifrequency Phase Fluorometer (ISS Inc., Champaign, IL) interfaced to a PC, with the spectral bandwidths set to 10 nm. The excitation source used for the ISS K2 Fluorometer was an external 690 nm class IIIB laser (≤100 mW, S/N 901290, Lasermax Inc., Rochester, NY). Disposable absorbance cuvettes and quartz fluorescence cuvettes with pathlengths of 1.00 cm were used for absorbance and fluorescence measurements, respectively. All calculations were carried out using Microsoft Excel (Microsoft Corporation, Redmond, WA).
Chemicals and reagents
Pentamethine dyes 666 (≥98.0%) and 829 (≥99.5%) were obtained from Organica Feinchemie GmbH (Wolfen, Germany). IR-676 iodide (97%) was obtained from Spectrum Info Limited (Kiev, Ukraine). Rhodamine 800 chloride (R800) (Fluorescence Reference Standard, Sigma-Aldrich, St. Louis, MO) was also obtained for use as a reference standard in the determination of the quantum yield of the pentamethine dyes. Heptamethine dyes IR-780 iodide (99%) and IR-786 perchlorate (98%) were obtained from Aldrich Chemical Co. (Milwaukee, WI) and Sigma-Aldrich, respectively. Indocyanine green (ICG) (lot GG01, 82.0% purity, TCI America, Portland, OR) was obtained for use as a standard in the determination of the quantum yield of the heptamethine dyes. The purchased dyes were used without further purification.
Pentamethine dye MHI-85 and heptamethine dye MHI-71 were synthesized in our lab following near infrared dye syntheses described in the literature.15
Dye synthesis
MHI-85 was synthesized as illustrated in Equation 1. The pentacarbocyanine dye MHI-85 was obtained by the condensation reaction between benz[e]indolium salt and malonaldehyde bis(phenylimine) monohydrochloride under basic conditions.
The purified product consisted of dark purple-blue crystals, mp 244–246 °C, yield 85%; 1HNMR (300 MHz, DMSO-d6): δ = 8.46 (t, J = 12.0 Hz, 2H),
 |
 |
8.25 (d, J = 8.4 Hz, 2H), 8.08 (d, J = 3.6 Hz, 2H), 8.05 (d, J = 3.6 Hz, 2H), 7.78 (d, J = 8.4 Hz, 2H), 7.68 (t, J = 7.5 Hz, 2H), 7.51 (t, J = 7.5 Hz, 2H), 6.67 (t, J = 12.0 Hz, 1H), 6.43 (d, J = 13.8 Hz, 2H), 4.25 (s, 4H), 2.60–2.50 (m, 4H), 1.97 (s, 12H), 1.85–1.75 (m, 8H). MS (ESI+): calcd. for C41H45N2S2O6+ [M–Na]+ 725.2719; found 725.2688.
MHI-71 was synthesized as illustrated in Equation 2. The heptacarbocyanine dye MHI-71 containing cyclohexene in the middle was synthesized by condensing the salt of Fischer base with Vilsmeier-Haack reagent under basic conditions to produce the dye.
The purified product consisted of iridescent golden-green crystals, mp 219–221 °C, yield 80%; 1HNMR (300 MHz, CDCl3): δ = 8.37 (d, J = 13.0 Hz, 2H), 7.45–7.37 (m, 4H), 7.30–7.20 (m, 4H), 6.24 (d, J = 13.0, 2H), 4.22 (t, J = 6.0 Hz, 4H), 2.75 (t, J = 6.0 Hz, 4H), 2.08–1.98 (m, 2H), 1.90–1.80 (m, 4H), 1.74 (s, 12H), 1.56–1.46 (m, 4H), 1.04 (t, J = 6 Hz, 6H). MS (ESI+): calcd. for C38H48N2Cl+ [M–I]+ 567.3521; found 567.3506.
Stock solutions
Stock solutions of the dyes were prepared by weighing the solid on a 5-digit analytical balance directly into a brown glass vial and adding methanol (MeOH) (LC-MS Chromasolv Grade, Sigma-Aldrich, St. Louis, MO) via a class A volumetric pipette (Kimble/Kontes, Vineland, NJ.). The contents of the vial were vortexed for 20 seconds, then sonicated for 5 minutes to ensure complete dissolution. The stock solutions were protected from light and stored in the freezer when not in use.
Method of determining molar absorptivity
Stock solutions were used to prepare five to six samples in methanol with concentrations ranging from 0.25–10 μM. Samples were prepared in 5.00 (±0.02) and 10.00 (±0.02) mL volumetric flasks using a 5–50 μL Micropipette 821 and a 200–1000 μL Pipetman (P1000) micropipette (Gilson, Inc., Middleton, WI.). The absorbance spectrum of each sample was measured using the Perkin Elmer Lambda 20 Spectrophotometer, and the absorbance at the wavelength of maximum absorbance (λMAXAB) was determined. The absorbance values (A) of each sample at λMAXAB were plotted as a function of dye concentration (C), and the linear regression equation was computed.
Method of determining quantum yield
Standards were chosen with wavelengths of maximum emission within 10 nm of those of the unknowns to prevent errors resulting from wavelength dependent variation in fluorimeter response. Samples of the dyes and their respective standards were prepared from stock solutions such that their absorbance at λMAXAB was less than 0.1 (to prevent the inner filter effect in fluorescence measurements). The absorbance and fluorescence spectra of each sample were obtained concurrently to minimize experimental error from photobleaching and potential solubility issues, and for all scans, the standard was run both prior to and following the unknowns (to ensure no change in instrumental response over the course of the runs). For both the pentamethine and heptamethine dyes, duplicate absorbance scans were obtained and the absorbance values at both the λMAXAB and λEXC were averaged. The emission spectra of the pentamethine dyes were measured in triplicate using the RF-1501 fluorimeter with the excitation wavelength set to 620 nm. The emission spectra of the heptamethine dyes were measured in triplicate using the ISS-K2 fluorimeter with a 690 nm excitation wavelength. For both sets of dyes, the area under each fluorescence curve was calculated and corrected for the Rayleigh peak area (if necessary). The average fluorescence peak areas were then calculated for each sample.
Results and Discussion
Molar absorptivities of each dye (in methanol) were computed from the slope of the linear regression plots of absorbance versus concentration. Absorbance values greater than or equal to 2.0 were excluded from these data sets. The molar absorptivities (ɛ) were then calculated at λMAXAB from the least squares slopes of the respective data sets, as per Beer’s law.
Provided in Table 1 is a summary of the found λMAXAB values and average calculated molar absorptivities (ɛ) for the pentamethine cyanine dyes and R800 as a reference sample. Also included in Table 1 are the standard deviations and percent relative standard deviations of the calculated molar absorptivities. The similarities in the λMAXAB values of the cyanine dyes indicate the similarity in substitution. For dyes 666, 829, and IR-676, the substituents are all electron-donating alkyl groups. MHI-85 exhibits virtually no shift in absorbance maximum relative to those found for the alkyl-substituted dyes 666 and 829, indicating that the sulfonate moiety is far enough removed from the chromophore that its electron-withdrawing effects have insignificant influence. The molar absorptivities of the dyes at λMAXAB do not vary greatly amongst themselves and do not follow any apparent trend based on substitution. Butyl-substituted dye 666 exhibited the greatest molar absorptivity, followed by methyl-substituted IR-676, followed by isopentyl-substituted dye 829. Butylsulfonato-substituted MHI-85 had the lowest observed molar absorptivity. The differences between dyes 666, 829, and IR-676 are not statistically significant, as the molar absorptivities of these dyes fall within the outer limits of each others ranges of standard deviation. However, the differences in molar absorptivity between MHI-85 and both dyes 666 and IR-676 are statistically significant, if relatively small. The lower molar absorptivity of butylsulfonato-substituted MHI-85 relative to the other dyes may be due to substituent chain length, effects of the sulfonate moiety, or the presence of minor impurities. The molar absorptivity values showed good precision, with reasonably low percent relative standard deviations (1.7%–7.4%) for all of the dyes.
Table 1.
Summary of wavelengths of maximum absorbance (λMAX) and averages, standard deviations, percent relative standard deviations, and number of replicate determinations (No.) of calculated molar absorptivities (ɛ) at λMAX for the pentamethine cyanine dyes and the standard (R800).
| Dye | λMAX(nm) | Avg.ɛɛ (λMAX) (M−1cm−1) | Std. Dev. ɛ (λMAX) (M−1cm−1) | % RSD ɛ (λMAX) | No. |
|---|---|---|---|---|---|
| IR-676 | 675 | 2.08E+05 | 3.5E+03 | 1.66 | 2 |
| 666 | 680 | 2.2E+05 | 1.2E+04 | 5.37 | 2 |
| 829 | 680 | 2.0E+05 | 1.5E+04 | 7.41 | 2 |
| MHI-85 | 680 | 1.88E+05 | 4.3E+03 | 2.31 | 4 |
| R800 | 679 | 7.1E+04 | 4.3E+03 | 6.14 | 3 |
Provided in Table 2 is a summary of the found λMAXAB values and average calculated ɛ values at the λMAXAB for the heptamethine cyanine dyes and ICG as a reference sample. Also included in Table 2 are the standard deviations and percent relative standard deviations of the calculated molar absorptivities. The similarities in the λMAXAB values amongst the cyanine dyes indicate the similarity in substitution; all are substituted with electron-donating alkyl groups. As with the pentamethine dyes, the molar absorptivities of the heptamethine dyes at λMAXAB do not vary greatly amongst themselves and do not follow any apparent trend based on substitution. Propyl-substituted IR-780 exhibited the greatest molar absorptivity, followed by methyl-substituted IR-786, followed by butyl-substituted MHI-71. Only the differences in molar absorptivity between MHI-71 and IR-786 and between MHI-71 and IR-780 are statistically significant (the ranges of molar absorptivity specified by the standard deviations are mutually exclusive). The molar absorptivity values showed good precision, with reasonably low percent relative standard deviations (0.88%–8.45%) for all of the dyes.
Table 2.
Summary of wavelengths of maximum absorbance (λMAX) and averages, standard deviations, percent relative standard deviations, and number of replicate determinations (No.) of calculated molar absorptivities (ɛ) at λMAX for the heptamethine cyanine dyes and the standard (ICG).
| Dye | λMAX(nm) | Avg.ɛɛ (λMAX) (M−1cm−1) | Std. Dev. ɛ (λMAX) (M−1cm−1) | % RSD ɛ (λMAX) | No. |
|---|---|---|---|---|---|
| IR-786 | 774 | 2.6E+05 | 2.2E+04 | 8.45 | 2 |
| IR-780 | 779 | 2.74E+05 | 2.4E+03 | 0.88 | 2 |
| MHI-71 | 779 | 1.64E+05 | 6.6E+03 | 4.01 | 2 |
| ICG | 783 | 1.25E+05 | 1.2E+03 | 0.98 | 2 |
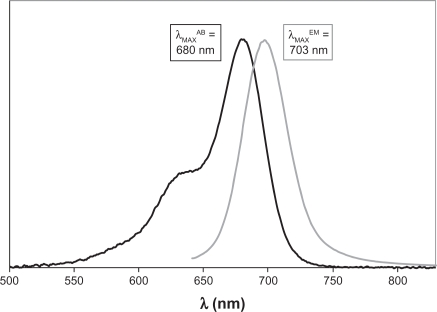
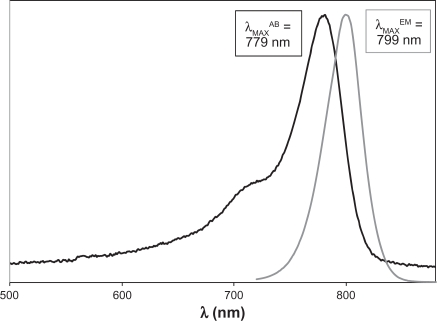
Provided in Figures 3 and 4 are representative comparisons of the absorbance and emission spectra of the pentamethine and heptamethine dyes, respectively. For both sets of dyes, the fluorescence and absorbance spectra are reasonably good mirror images of one another (with the exception of the Soret peak visible at lower wavelengths in the absorbance spectrum), and the Stokes’ shifts provided in Tables 3 and 4 are relatively small, ranging from 20–23 nm (321–348 cm−1). This indicates minor structural changes between the ground and excited singlet states of these dyes.
Figure 3.
Comparison of relative absorption and emission spectra of MHI-85 in methanol, with labeled wavelengths of maximum absorbance (λMAXAB) and emission (λMAXEM).
Figure 4.
Comparison of relative absorption and emission spectra of MHI-71 in methanol, with labeled wavelengths of maximum absorbance (λMAXAB) and emission (λMAXEM).
Table 3.
Average wavelengths of maximum absorbance (λMAXAB) and emission (λMAXEM) and Stokes’ shifts of pentamethine cyanine dyes.
| Dye | λMAXAB(nm) | λMAXEM(nm) | Stokes’ shift (cm−1) |
|---|---|---|---|
| IR-676 | 675 | 698 | 488 |
| 666 | 680 | 703 | 481 |
| 829 | 680 | 702 | 461 |
| MHI-85 | 680 | 703 | 481 |
Table 4.
Average wavelengths of maximum absorbance (λMAXAB) and emission (λMAXEM) and Stokes’ shifts of heptamethine cyanine dyes.
| Dye | λMAXAB(nm) | λMAXEM(nm) | Stokes’ shift (cm−1) |
|---|---|---|---|
| IR-786 | 774 | 796 | 357 |
| IR-780 | 779 | 799 | 321 |
| MHI-71 | 779 | 799 | 321 |
The fluorescence quantum yields of each of the cyanine dyes were calculated relative to the standard from their respective average fluorescence peak areas (F), average absorbances at λEXC (A), and the published quantum yield of the standard (φS), as per the following equation. In this equation, the indices S and U refer to the standards and the unknowns, respectively.
Methanol was used as the solvent for both the standards and the unknowns; therefore no correction for solvent refractive index was necessary in this equation. This calculation assumes negligible variation in instrument response within the range of emission wavelengths exhibited by the unknowns with respect to the standard emission wavelengths.
Provided in Table 5 are the average quantum yields of the pentamethine dyes calculated relative to R800 as determined from multiple studies, along with their standard deviations and percent relative standard deviations. Reproducibility of results following duplicate determinations of quantum yield was good for dyes MHI-85 and IR-676, with percent relative standard deviations of 5.6 and 5.1 percent, respectively; accordingly no further determinations were made. However, reproducibility was poor for dyes 666 and 829, accordingly the quantum yield of dye 666 was determined two additional times, and the quantum yield of dye 829 was determined one additional time in an attempt to improve reproducibility. Following these further studies, a significant improvement in reproducibility was observed for dye 666 but not dye 829. Nonetheless, even taking into account the high percent relative standard deviations, the average quantum yields of the pentamethine dyes did not vary significantly with increasing alkyl N-substitution. Additionally, it appears that the addition of solubility-enhancing anionic sulfonate groups to these alkyl N-substituents has no significant effect on the quantum yield.
Table 5.
Average quantum yields (φ) calculated for pentamethine dyes, standard deviations, percent relative standard deviations, and number of replicate determinations of each quantum yield (No.).
| Dye | Average φ | Std. Dev. φ | % RSD φ | No. |
|---|---|---|---|---|
| IR-676 | 0.164 | 0.0084 | 5.1 | 2 |
| 666 | 0.19 | 0.0260 | 13.9 | 4 |
| 829 | 0.17 | 0.0405 | 23.7 | 3 |
| MHI-85 | 0.175 | 0.0098 | 5.6 | 2 |
Provided in Table 6 are the average quantum yields of the heptamethine dyes calculated relative to ICG as determined from duplicate studies, along with their standard deviations and percent relative standard deviations. Reproducibility of results following duplicate determinations of quantum yield was good for all of the dyes, with IR-786, IR-780, and MHI-71 having percent relative standard deviations of 2.8, 4.5, and 6.8 percent, respectively; accordingly no further determinations of quantum yield were made. Overall, the quantum yields of the heptamethine dyes were much lower than those of the pentamethine dyes, as expected,16 and as with the pentamethine dyes, the average quantum yields of the heptamethine dyes did not vary significantly with increasing alkyl N-substitution.
Table 6.
Average quantum yields (φ) calculated for heptamethine dyes, standard deviations, percent relative standard deviations, and number of replicate determinations of each quantum yield (No.).
| Dye | Average φ | Std. Dev. φ | % RSD φ | No. |
|---|---|---|---|---|
| IR-786 | 0.076 | 0.0022 | 2.8 | 2 |
| IR-780 | 0.076 | 0.0035 | 4.5 | 2 |
| MHI-71 | 0.077 | 0.0053 | 6.8 | 2 |
Conclusions
Based on these results, it can be generalized that increasing the chain length of short-chain alkyl substituents on the heterocyclic indole nitrogens has little to no effect on the quantum yields and molar absorptivities of cyanine dyes, and the addition of sulfonate groups to the ends of these alkyl N-substituents also does not change the quantum yield. The lack of effect on quantum yield may be attributable to the fact that the N-substituents are not directly conjugated to the chromophore and therefore have little to no effect on internal conversion-type energy loss, and that additionally, these short chain substituents do not provide adequate steric hindrance to interfere sufficiently with photoisomerization to cis-cyanine. The implications of these results are significant to the design and synthesis of new cyanine dyes. As previously mentioned, cyanine dyes are frequently modified at these heterocyclic nitrogen positions to enhance binding interactions, make the dyes pH sensitive, or improve solubility. Accordingly, provided the functional group is not directly attached to the chromophore, but instead “bridged” by a short alkyl substituent, introducing this group should have little effect on the quantum yield of the dye relative to a structurally similar dye lacking this functionality. For example, if one wished to modify a dye with desirable spectroscopic properties to be more water soluble or to bind more strongly with DNA or protein by adding a charged or polar functionality, this modification could be carried out without concern for loss or change of the desired spectral characteristics. Additionally, these results suggest that quantum yields of new cyanine dyes can be roughly predicted prior to their synthesis and characterization based on quantum yields of structurally similar preexisting dyes, provided that such data exists.
Acknowledgments
We would like to thank Dr. Lifang Wang for providing the mass spectra of these compounds and Garfield Beckford for troubleshooting and fixing our occasionally uncooperative instruments.
Footnotes
Disclosure
This manuscript has been read and approved by all authors. This paper is unique and is not under consideration by any other publication and has not been published elsewhere. The authors and peer reviewers of this paper report no conflicts of interest. The authors confirm that they have permission to reproduce any copyrighted material.
References
- 1.Peters AT, Freeman HS. Modern Colorants: Synthesis and Structure. Springer Publishing Company; New York: 1995. p. 44. [Google Scholar]
- 2.Watanabe S, Tani T. Absorption spectra of J-aggregates of cyanine dyes adsorbed on AgBr. J Imag Sci Tech. 1995;39:81–5. [Google Scholar]
- 3.Serak S, Kovalev A, Agashkov A. Space charge-induced reorientation in polymethyne dye-doped nematics under excitation with nanosecond laser pulses. Opt Commun. 2000;181:391–9. [Google Scholar]
- 4.Yoshida T, Zhang J, Komatsu D, et al. Electrodeposition of inorganic/organic hybrid thin films. Adv Funct Mater. 2009;19:17–43. [Google Scholar]
- 5.Qiao X, Wang L, Maa J, et al. High sensitivity analysis of water-soluble, cyanine dye labeled proteins by high-performance liquid chromatography with fluorescence detection. Anal Chim Acta. 2009;640:114–20. doi: 10.1016/j.aca.2009.03.021. [DOI] [PubMed] [Google Scholar]
- 6.Williams RJ, Lipowska M, Patonay G, Strekowski L. Comparison of covalent and noncovalent labeling with near-infrared dyes for the high-performance liquid chromatographic determination of human serum albumin. Anal Chem. 1993;65:601–5. doi: 10.1021/ac00053a019. [DOI] [PubMed] [Google Scholar]
- 7.Yarmoluk SM, Losytskyy M Yu, Yashchuk VM. Nonradiative deactivation of the electronic excitation energy in cyanine dyes: influence of binding to DNA. J Photochem Photobiol B. 2002;67:57–63. doi: 10.1016/s1011-1344(02)00281-6. [DOI] [PubMed] [Google Scholar]
- 8.Colyer C. Noncovalent labeling of proteins in capillary electrophoresis with laser-induced fluorescence detection. Cell Biochem Biophys. 2000;33:323–37. doi: 10.1385/CBB:33:3:323. [DOI] [PubMed] [Google Scholar]
- 9.Frangioni JV. In vivo near-infrared fluorescence imaging. Curr Opin Chem Biol. 2003;7:626–34. doi: 10.1016/j.cbpa.2003.08.007. [DOI] [PubMed] [Google Scholar]
- 10.Murphy S, Schuster GB. Electronic Relaxation in a Series of Cyanine Dyes: Evidence for Electronic and Steric Control of the Rotational Rate. J Phys Chem. 1995;99:8516–8. [Google Scholar]
- 11.Soper SA, Mattingly QL. Steady-State and Picosecond Laser Fluorescence Studies of Nonradiative Pathways in Tricarbocyanine Dyes: Implications to the Design of Near-IR Fluorochromes with High Fluorescence Efficiencies. J Am Chem Soc. 1994;116:3744–52. [Google Scholar]
- 12.Ranjit S, Gurunathan K, Levitus M. Photophysics of Backbone Fluorescent DNA Modifications: Reducing Uncertainties in FRET. J Phys Chem B. 2009;113:7861–6. doi: 10.1021/jp810842u. [DOI] [PubMed] [Google Scholar]
- 13.Cooper M, Ebner A, Briggs M, et al. Cy3B: improving the performance of cyanine dyes. J Fluoresc. 2004;14:145–50. doi: 10.1023/b:jofl.0000016286.62641.59. [DOI] [PubMed] [Google Scholar]
- 14.Tyutyulkov N, Fabian J, Mehlhorn A, Dietz F, Tadjer A. Polymethine Dyes. St Kliment Ohridski University Press; Sofia: 1991. [Google Scholar]
- 15.Gragg J, Henary MA. Synthesis of Near-Infrared Heptamethine Cyanine Dyes. 2010. Thesis for the Masters Degree in the College of Arts and Sciences, Georgia State University, Atlanta, GA.
- 16.Haughland RP. Handbook of Fluorescent Probes and Research Chemicals. 9th ed. Molecular Probes Inc; Eugene: 1996. [Google Scholar]


