

Abstract
The distinctive red–green dimension of human and nonhuman primate color perception arose relatively recently in the primate lineage with the appearance of separate long (L) and middle (M) wavelength-sensitive cone photoreceptor types. “Midget” ganglion cells of the retina use center–surround receptive field structure to combine L and M cone signals antagonistically and thereby establish a “red–green, color-opponent” visual pathway. However, the synaptic origin of red–green opponency is unknown, and conflicting evidence for either random or L versus M cone-selective inhibitory circuits has divergent implications for the developmental and evolutionary origins of trichromatic color vision. Here we directly measure the synaptic conductances evoked by selective L or M cone stimulation in the midget ganglion cell dendritic tree and show that L versus M cone opponency arises presynaptic to the midget cell and is transmitted entirely by modulation of an excitatory conductance. L and M cone synaptic inhibition is feedforward and thus occurs in phase with excitation for both cone types. Block of GABAergic and glycinergic receptors does not attenuate or modify L versus M cone antagonism, discounting both presynaptic and postsynaptic inhibition as sources of cone opponency. In sharp contrast, enrichment of retinal pH-buffering capacity, to attenuate negative feedback from horizontal cells that sum L and M cone inputs linearly and without selectivity, completely abolished both the midget cell surround and all chromatic opponency. Thus, red–green opponency appears to arise via outer retinal horizontal cell feedback that is not cone type selective without recourse to any inner retinal L versus M cone inhibitory pathways.
Introduction
The “midget pathway” is perhaps the most specialized and intensively studied component of the human and nonhuman primate visual system. Yet there remains significant disagreement about the specific contributions of the midget circuit to vision (Calkins and Sterling, 1999; Reid and Shapley, 2002; Lennie and Movshon, 2005; Solomon and Lennie, 2007; Lee et al., 2010). In the central 10° of visual angle, each midget ganglion cell, with a dendritic tree barely 5 μm in diameter, receives virtually all excitatory synaptic input from an equally diminutive midget bipolar cell. Each midget bipolar cell establishes a synaptic link with a single L or M cone photoreceptor (Kolb and Dekorver, 1991; Calkins et al., 1994; Jusuf et al., 2006b). The midget pathway thus appears perfectly designed to preserve the high sampling density of the foveal cone mosaic and to set the limit on achromatic spatial resolution (Dacey, 1993).
However, in the trichromatic primates, midget ganglion cells also display “red–green” color opponency in which L and M cone signals are antagonistic. The earliest recordings from the retina (De Monasterio and Gouras, 1975) and LGN (De Valois, 1965; Wiesel and Hubel, 1966; Derrington et al., 1984; Lankheet et al., 1998) recognized that center–surround interaction was necessary to evoke a red–green opponent response. Subsequent studies have led to opposing hypotheses about the origin and circuitry for L versus M cone opponency. The random-wiring hypothesis predicts that given a single L or M cone input to the receptive field center, mixed L and M cone input to the surround will lead to opponency (Paulus and Kröger-Paulus, 1983; Lennie et al., 1991). This hypothesis fits with the lack of L or M cone selectivity from either horizontal cells (Dacey et al., 1996) or amacrine cells (Calkins and Sterling, 1996), the two negative feedback pathways that potentially contribute to the formation of the receptive field surround.
By contrast, the selective-connection hypothesis argues that midget circuitry has evolved explicitly for color vision (Lee, 1999; Reid and Shapley, 2002; Shapley, 2006). Evidence for this hypothesis comes from reports of receptive field surrounds that are cone type selective or biased (Reid and Shapley, 1992, 2002; Buzás et al., 2006) and that in the retinal periphery, where midget receptive field centers draw mixed input from multiple L and M cones, red–green opponency can still be measured (Martin et al., 2001), again presumably due to cone type-selective inhibitory pathways (Buzás et al., 2006). Thus, a major unanswered question that could distinguish between these distinct hypotheses is whether L or M cone type-selective inhibition has evolved in primates to establish red–green color vision. We therefore used voltage clamp and pharmacological approaches to directly evaluate the role of synaptic inhibition in red–green opponency. We found that opponency arises by horizontal cell feedback, acting via a nonsynaptic, pH-sensitive mechanism, without recourse to synaptic inhibition. Since horizontal cells receive nonselective input from both L and M cones (Dacey et al., 2000), we conclude that these indiscriminating connections can underlie red–green opponency.
Materials and Methods
In vitro preparation.
Eyes were removed from deeply anesthetized macaque monkeys (Macaca nemestrina, Macaca fascicularis, or Macaca mulatta) serving the Tissue Distribution Program of the National Primate Research Center at the University of Washington. The in vitro tissue preparation has been previously described (Crook et al., 2008). In brief, after enucleation, the anterior chamber of the eye was removed, the vitreous drained, and the remaining eyecup placed in oxygenated Ames' medium (Sigma; A1420). The retina, choroid, and pigment epithelium were then dissected away from the sclera with care not to cause retinal detachment from the supporting layers. Radial cuts were made in the retina to create a flat mount that was adhered, ganglion cell layer up, to the glass bottom of a steel superfusion chamber that had been coated with poly-l-lysine (Sigma; P1399, 0.1% w/v). The chamber was mounted on a heating element, and a perfusion inlet tube, outlet tube, agar bridge, and thermistor were inserted into the bath. Visual stimuli were delivered to the photoreceptors from the vitreal or ganglion cell side of the retina as in situ, via the microscope objective lens as described further below. The retina was continuously superfused with Ames' medium (pH 7.4; constant oxygenation with 95% O2/5% CO2); temperature was thermostatically maintained (TC-344B, Warner Instruments) at ∼36°C. Receptor agonists and antagonists (as described further below) were maintained in Ames' medium in separate oxygenated reservoirs and could be introduced to the bath quickly by switching a solenoid valve at a common input to the chamber.
In vitro electrophysiology.
Ganglion cells were observed using a 60× water-immersion objective under infrared illumination and midget ganglion cells were targeted by their relatively high density and small soma size (Dacey and Lee, 1994). Cell type identity was confirmed by stereotyped responses to cone-isolating stimuli, receptive field size, and distinctive dendritic morphology observed episcopically by fluorescent dye (Alexa Fluor 488, 50–100 μm, A10436, Invitrogen) fills of the dendritic tree during whole-cell recording. We found that maintained spike discharge recorded in vivo (Troy and Lee, 1994) was a reliable indicator of overall retinal sensitivity and adherence to the retinal pigment epithelium; we therefore characterized the cone inputs to ganglion cells that showed maintained activity in the range of 20–30 spikes · s−1. The eccentricity of each recorded midget cell was calculated from foveal and optic disc locations in vitro measured in the X–Y coordinates of the microscope stage.
Using the “loose-patch” method extracellular recordings were made with glass micropipettes (5–8 MΩ) filled with Ames' medium. Spikes were recorded as currents in voltage-clamp mode at 0 mV holding potential. For patch recordings, glass micropipettes (5–8 MΩ) were filled with a standard cesium-based solution to block voltage-gated potassium currents and included QX-314 to block sodium channels and eliminate spikes after establishing the whole-cell configuration. Cesium-based internal solution contained Alexa Fluor 488 or 555 (100 μm, A-20501, Invitrogen) and the following (in mm): 120 cesium-methanesulfonate, 5 tetraethylammonium (TEA)-Cl, 10 HEPES, 3 NaCl, 10 BAPTA, 2 QX-314-Cl, 2 ATP-Mg, and 0.3 GTP-Na, titrated to pH 7.3. In voltage clamp after breaking into a ganglion cell, the zero-current potential using the cesium-based solution was typically approximately −45 mV (∼15 mV positive to the normal resting potential). We monitored the zero-current potential and the 95% compensated series resistance (RS, 15.3 ± 5.2 MΩ; mean ± SD; n = 31) throughout a recording; if either value changed or was unstable, the recording was discontinued. Data acquisition and stimulus presentation were coordinated by custom software running on an Apple Macintosh computer. Current and spike waveforms were Bessel filtered at 2 kHz and sampled at 10 kHz.
Stimulus generation.
A digital projector (Christie Digital Systems) was used to project the visual stimuli (VSG, Cambridge Research Systems) through an optical relay to the microscope camera port and bring the image into focus at the photoreceptor layer. To quantify the effectiveness of the stimuli in modulating individual and multiple cones, the irradiances of the primary spectra were measured with a spectroradiometer (PR705, Photo Research). The dominant wavelengths and integrated photon fluxes of the red, green, and blue primaries of our digital light projector were 636, 550, and 465 nm and 2.7 × 10⁶, 6.9 × 10⁵, and 1.8 × 10⁵ photons · s−1 · μm−2, respectively, giving cone quantal catch rates of ∼105 to 106 photoisomerizations · cone−1 · s−1. These levels are at least 3 log units above the threshold for cone responses. This is a relatively high photopic level at which rods are in saturation, as we have shown in a previous study of color opponent primate ganglion cells [see Crook et al. (2009b), their Fig. 3]. To quantitatively predict the effectiveness of the light delivered by each primary to the cone aperture, we calculated the products of each primary irradiance spectrum and each cone spectral sensitivity function (Baylor et al., 1987), correcting for the spectrally broadening effects of self-screening by assuming a cone outer segment length of 5 μm and a pigment density of 0.016/μm. Each product was then summed across wavelength, giving units of “effective” photons · s−1 · μm−2 (irradiance corrected by cone spectral sensitivity). Effective photons · s−1 · μm−2 was then converted to photoisomerizations · s−1 · cone−1 by multiplying by the area of the cone aperture. In previous studies involving transverse illumination of the cone outer segment (Baylor et al., 1979), where funneling of the inner segments plays no role, the conversion factor commonly used is 0.37 μm2. The efficiency of photoisomerization (0.67) (Dartnall, 1972) is included in this value. In our macaque retina in vitro, as in vivo, light is incident upon the vitreal surface of the retina, and funneling by the inner segment would tend to increase the effective area of the cone aperture. We therefore consider the use of 0.37 μm2 as a very conservative estimate of cone aperture to make the conversion to photoisomerizations · s−1 · cone−1.
Figure 3.
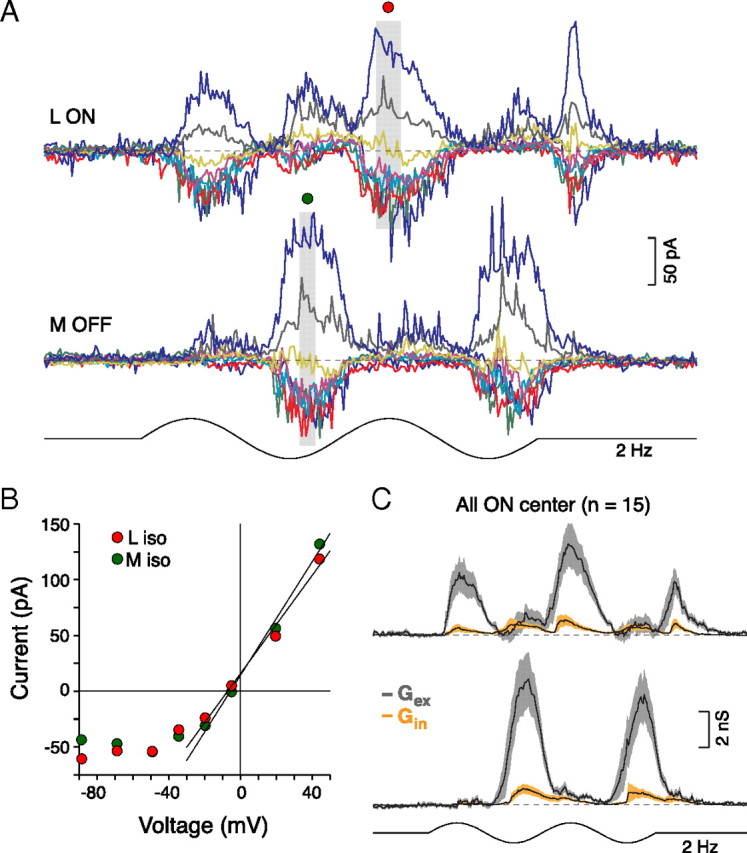
L versus M cone opponency is transmitted to the ON midget cell by modulation of an excitatory conductance. A, ON center midget cell's light-evoked L-ON versus M-OFF current responses to sinusoidally modulated L- (top) and M- (bottom) cone-isolating spots (diameter = 2 mm). B, Current–voltage relationships for the peak L versus M responses indicated in A (gray boxes). Fits to the data show that L and M currents reverse negative to Ecation (Erev, x-intercept; L vs M, Erev = −5 vs −5 mV) and have comparable conductances (Gt, y-intercept; L vs M, Gt = 2 vs 2 nS). C, Excitatory conductances (Gex, gray) drive L versus M cone responses with minimal feedforward inhibition (Gin, orange; shaded areas show SEM) for ON center midget cells as for OFF center midget cells (Fig. 2D).
Often, the intensity of stimuli used in human visual psychophysics or in physiological experiments in the intact primate eye is expressed in units of retinal illuminance, or trolands (Td). To aid comparison with our data, we calculated that for a peripheral cone with an inner segment aperture of 9 μm, 1 Td was equivalent to ∼30 photoisomerizations · s−1 · cone−1. For a rod with an inner segment aperture of 2.5 μm, 1 scotopic troland was equivalent to ∼4 photoisomerizations · s−1 · rod−1.
To achieve cone isolation, both modulation depth and irradiances of the primary lights were adjusted; cone isolation was confirmed by direct recordings from macaque cones and has been reported previously (Packer et al., 2010). Cone contrast was defined as the peak excursion from the mean light level, divided by the mean light level (expressed as a percentage). Cone output was modulated with amplitudes chosen to create equivalent modulation depths around an equivalent mean quantal catch for all cones (L:M:S = 35% contrast, amplitude/mean) or at unequal mean levels (45–75%). Comparable responses were measured to all stimuli, though responses to the highest cone contrast stimuli were preferable for analysis of light-evoked currents.
The L and M components of the midget cell receptive field were characterized using cone-isolating spots of different diameter (75%, 2 Hz), annuli of different inner diameters (75%, 2 Hz), and drifting sine-wave gratings as a function of spatial frequency (45%, 2 Hz). To center the stimulus on the cell's receptive field, the cell body was first placed in the middle of the stimulus field. Horizontal and vertical fine-diameter slits (10 or 25 μm width) were then systemically moved in the x and y planes to further locate the most sensitive point in the receptive field. The location of the peak response was defined to be the receptive field center; stimuli were positioned relative to this point.
Analysis.
Spike rate amplitude was calculated from the first Fourier harmonic at the stimulus frequency. L and M cone-specific spatial tuning curves derived from spots as a function of diameter or drifting sine-wave gratings as a function of spatial frequency were fit using a difference-of-Gaussians (DoG) model of the receptive field that incorporates both response amplitude and phase (Enroth-Cugell et al., 1983). From the fits, the weight (amplitude of Gaussian) and radius (1 SD of the Gaussian weighting functions) of the receptive field center and surround were calculated. Details and application of this model have been described previously (Dacey et al., 2000; McMahon et al., 2004).
In voltage clamp, we held each cell at eight different holding potentials between −85 and +50 mV and measured the light-evoked current responses at each potential. Offline, we corrected for the voltage drop across the pipette tip caused by any uncompensated series resistance. We calculated the corrected holding potential (Vh) using the following formula: Vh = Vhcommand − jp − (Ileak × RS × (1 − RScorrect), where Vhcommand is the command potential (in millivolts), jp is the 9.7 mV liquid junction potential, Ileak is the leak current (in nanoamperes), RS is the series resistance (in megaohms), and RScorrect is the series resistance compensation (∼0.95). In voltage clamp, the slope of the current–voltage relationship (I–V) is the conductance and the x-intercept is the reversal potential. We performed a conductance analysis using established techniques (Borg-Graham, 2001; Taylor and Vaney, 2002) with a slight modification. Previous techniques assumed that the I–V relationship was fit well with a straight line. We found, however, that the inhibitory conductances were more accurately modeled using Goldman rectification, which is caused by a large difference between the Cl− concentration inside and outside the cell (Johnston and Wu, 1995). We thus modeled the inhibitory (Cl−; GABA/glycine) currents using the Goldman–Hodgkin–Katz equation. We assumed that the excitatory currents had a linear I–V relationship; however, this is only true at Vh > −25 mV, where the NMDA receptor conductance becomes linear (Manookin et al., 2008). Thus, we analyzed current responses recorded at Vh > −25 mV. To calculate the putative inhibitory and excitatory conductances (in nanosiemens), we analyzed the I–V relationship at every point in time, modeling the total conductance as the sum of an inhibitory and an excitatory conductance. The magnitudes of these conductances were determined using a Vandermonde matrix and leftward matrix division in Matlab (Version 7.8; MathWorks).
Pharmacology.
The circuitry underlying the receptive field surround of the midget ganglion cell was investigated with pharmacological agents. The role of inner retinal inhibition was investigated with the glycine receptor antagonist strychnine (1 μm, S8753, Sigma), the GABAA receptor antagonist GABAzine (5 μm, S106, Sigma), and the GABAC receptor antagonist TPMPA (50 μm, T200, Sigma). The role of outer retinal inhibition was tested by adding the pH buffer HEPES (20 mm, H7523, Sigma) to Ames with the pH adjusted to 7.4. The metabotropic glutamate receptor agonist l-AP-4 (40 μm, 0103, Tocris Bioscience) was used to block the ON pathway at the photoreceptor–bipolar cell synapse. All pharmacological agents were dissolved in Ames medium and applied to the entire retina by continuous superfusion. We waited ∼4 min for full drug effect and typically recorded for ∼30 min before washout (Crook et al., 2008).
Results
Center–surround antagonism underlies midget cell L versus M cone opponent responses
To identify the origin of L versus M opponent responses and the spatial arrangement of L and M cones to the midget cell receptive field, we mapped L and M cone spatial tuning functions. We targeted ON and OFF midget ganglion cells at 10–20° eccentricity (2–4 mm from the foveal center) where receptive field centers derive from 1 to ∼6 cones (Fig. 1A). Red–green opponent midget cells showed responses to full field L and M cone-isolating stimuli (∼1000 μm in diameter) that were ∼180° out of phase (Table 1). For 69 midget cells, we measured spike discharges to L and M cone-specific stimuli presented as spots of increasing diameter (Fig. 1B) (n = 51) or as drifting sine-wave gratings of increasing spatial frequency (cpd) (Fig. 1C) (n = 18). All midget cells displayed clear center–surround receptive field structure. The receptive field center radius ranged from 11 to 70 μm and the surround from 100 to 300 μm depending on retinal eccentricity (Fig. 1B–F, Table 1). Either one or both cone types contributed to the center (Fig. 1B,C; D, top; E, middle; F); both cone types always contributed to the surround (Fig. 1B,C; D, bottom; E, bottom; F). To quantify the relative contribution of L and M cone inputs to the receptive field components, we used weight parameters from the fits (Table 1) and calculated the L percentage input [L/(L + M)] to the center and the surround. For a sample of 69 cells, inputs to the center ranged from pure M (Fig. 1D, 0 on the x-axis, top) and L (Fig. 1D, 1 on the x-axis, top) to mixed L and M cone inputs (Fig. 1D, between 0 and 1 on the x-axis, top). L and M cone inputs to the surround contributed on average ∼50% each (Fig. 1D, bottom) (mean ± STD = 49 ± 22%, median = 48%, n = 69).
Figure 1.
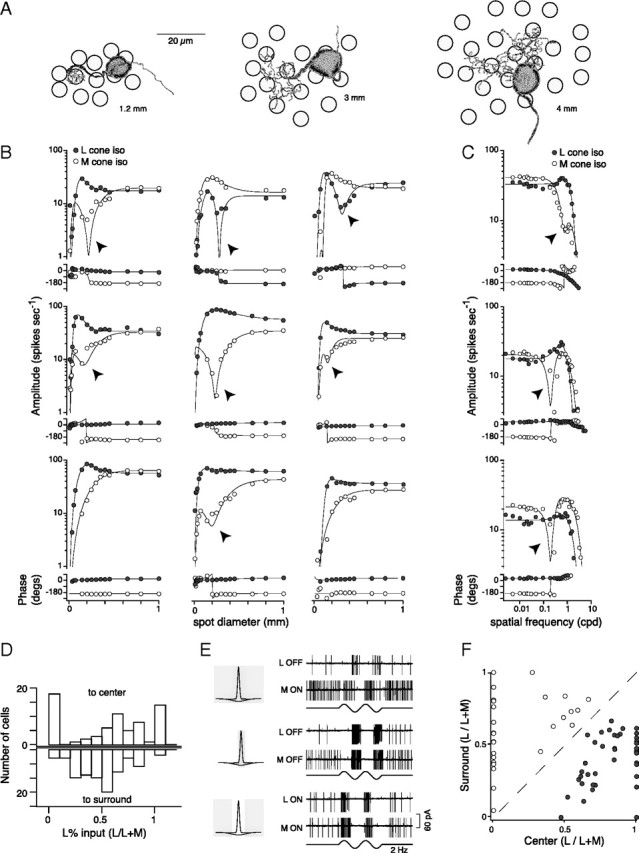
L versus M cone or “red–green” opponency in midget ganglion cells arises by center–surround receptive field antagonism. A, Tracings of 3 midget cells at the range of retinal eccentricities recorded in this study. Eccentricities from left to right are 1.2, 3, and 4 mm from the fovea. Each tracing is overlaid on a second tracing of the cone inner segment mosaic at the same retinal location, indicating the number of cones potentially linked to each midget ganglion cell. Scale bar, 20 μm. B, C, Amplitude and phase of spike responses to sinusoidally modulated spots of increasing diameter for 9 midget cells (B, 75% contrast, 2 Hz) or drifting sine-wave gratings as a function of spatial frequency for 3 midget cells (C, 45% contrast, 2 Hz) that modulate either L (solid circles) or M (open circles) cones in isolation. Responses were fit with a DoG function if L or M cones contributed to the center and surround, or a Gaussian function if the cone only contributed to the surround (solid lines; see Materials and Methods). Mixed or pure L and M cone inputs drive the receptive field center while mixed L and M cone inputs contribute to the surround. D, From the fits (B, C, Table 1), we calculated the L percentage input weight [L/(L + M)] to the center (top) and surround (bottom) for each cell. Cone inputs to the center were highly variable (mean ± STD = 55 ± 38%, n = 69; top) and ranged from pure M (center = 0, top) and L (center = 1, top) to mixed L and M cone inputs (between 0 and 1, top). To the surround, L and M cone inputs contributed on average ∼50% each (mean ± STD = 49 ± 22%, n = 69; bottom). E, Recording from one midget cell, stimulation of the receptive field center and surround with broad L and M cone-specific spots (≥1000 μm diameter) resulted in L OFF versus M ON responses (top). Stimulation of just the center with a small spot (≤200 μm diameter, middle) resulted in L-OFF and M-OFF responses, while stimulation of just the surround (≥200 μm inner diameter, bottom) resulted in L-ON and M-ON responses. The stimulus is shown in gray in relation to the Gaussian profiles. F, Plot of center versus surround cone input weights taken from the individual L and M cone spatial tuning fits (B, C, Table 1). L cone-centered midget cells (center > 0.5, solid circles) are on the right side of the unity line and M cone-centered cells (center < 0.5, open circles) on the left.
Table 1.
Summary of DoG and Gaussian model parameters for ON and OFF midget ganglion cells L and M cone spatial tuning functions (Fig. 1B,C)
| Center radius (μm) | Surround radius (μm) | Center phase (degrees) | Surround phase (degrees) | Center:surround weight | |
|---|---|---|---|---|---|
| ON midgets | |||||
| L ON center | 30 ± 15 (n = 29) | 146 ± 62 (n = 28) | 7 ± 23 (n = 29) | −186 ± 37 (n = 29) | 2.2 ± 1.4 (n = 29) |
| M OFF surround | 27 ± 15 (n = 17) | 194 ± 123 (n = 29) | 7 ± 51 (n = 17) | −178 ± 52 (n = 17) | 0.6 ± 0.5 (n = 17) |
| M ON center | 35 ± 11 (n = 15) | 221 ± 40 (n = 15) | 4 ± 59 (n = 15) | −141 ± 61 (n = 15) | 1.5 ± 0.3 (n = 15) |
| L OFF surround | 34 ± 15 (n = 9) | 220 ± 174 (n = 15) | 9 ± 24 (n = 9) | −167 ± 64 (n = 15) | 0.6 ± 0.5 (n = 9) |
| OFF midgets | |||||
| L OFF center | 30 ± 12 (n = 14) | 214 ± 92 (n = 14) | −176 ± 12 (n = 14) | 27 ± 30 (n = 14) | 3.0 ± 1.2 (n = 14) |
| M ON surround | 28 ± 10 (n = 10) | 144 ± 77 (n = 14) | −215 ± 26 (n = 10) | −21 ± 21 (n = 14) | 0.5 ± 0.1 (n = 10) |
| M OFF center | 33 ± 16 (n = 11) | 182 ± 95 (n = 11) | −183 ± 65 (n = 11) | −33 ± 64 (n = 11) | 2.3 ± 1.3 (n = 11) |
| L ON surround | 40 (n = 1) | 160 (n = 1) | −187 (n = 1) | 10 (n = 1) | 0.75 (n = 1) |
Center–surround antagonism was thus a key requirement for “red–green” opponent responses (Fig. 1E, top). Primary stimulation of the receptive field center (Fig. 1B,C; E, middle) or surround (Fig. 1E, bottom) resulted in L and M cone-specific responses occurring in phase while responses ∼180° out of phase only occurred to broad stimuli that fully engaged both the receptive center and the surround (Fig. 1B,C; E, top). At intermediate spot diameters and grating spatial frequencies, the balance of L and M cone inputs was graded depending on the degree to which the surround was engaged. The spatial dependence of chromatic responses was best illustrated for a midget cell that received mixed L and M cone inputs to the receptive field center and surround. In this case, the spatial frequency response showed a distinct dip at intermediate spot diameters or spatial frequencies for one of the cone inputs (Fig. 1B,C, arrowheads). At this “spatiochromatic notch,” the center cone input was cancelled by surround antagonism from cones of the same type, resulting in a sharp 180° reversal in response phase. On average the surround L:M cone input weight tends to be approximately 1:1 (Fig. 1D). Opponency thus arises when the center cone input weight for one cone is less than its contribution to the surround (Fig. 1F). The spike data thus demonstrate that single midget cells with mixed L and M cone inputs to both the receptive field center and surround display a dominant chromatic signal (response to L and M cone stimuli out of phase) to large spots and low stimulus spatial frequencies where center–surround antagonism is strong and an achromatic signal (response to L and M cone stimuli in phase) to center-dominated, small spots and high spatial frequencies.
Given the critical role for surround antagonism in generating the opponent midget cell “spatiochromatic notch” and L versus M opponent responses, our goal was to determine the locus of this “inhibitory” signal. Specifically, we wanted to identify whether it arises in the inner retina via amacrine cell inhibitory circuitry (Buzás et al., 2006) or the outer retina via horizontal cell negative feedback to L and M cones (Verweij et al., 2003) or by some combination of both pathways.
Direct inhibitory inputs to midget cells are not L or M cone specific
To test whether inner retinal inhibitory circuits play a role in cone opponency, we directly recorded from OFF (Fig. 2) and ON center midget cells (Fig. 3) in the whole-cell configuration in voltage clamp and measured the synaptic currents evoked by L or M cone-isolating stimuli. We used large-field stimuli, modulated at a low temporal frequency that elicited strong center–surround antagonism (Fig. 1E, top). At negative potentials near the resting potential (approximately −65 mV), currents evoked by L and M cone modulation were inward and in opposite phase. As holding potentials were stepped to positive values, both L and M cone-evoked currents reversed slightly negative to the cation reversal potential of 0 mV (Figs. 2A,B, 3A, yellow current trace), indicating that similarly weighted feedforward excitatory and inhibitory inputs must drive both the L and M cone opposing responses. From the leak-subtracted light-evoked responses, we plotted the current–voltage (I–V) relationships for the peak L and M responses (Figs. 2C, 3B).
Figure 2.
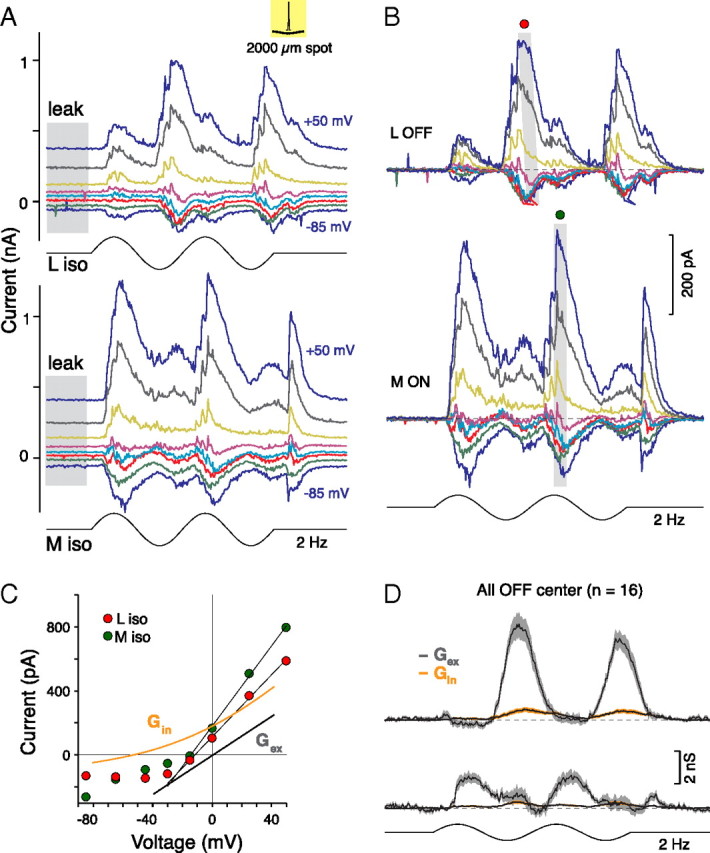
L versus M opponency is transmitted to the OFF midget ganglion cell by an excitatory conductance. A, OFF center midget cell's family of L-OFF versus M-ON current responses recorded at eight holding potentials (Vh, −85, −65, −45, −30, −15, 0, +25, and +50 mV) to sinusoidally modulated L- (top) and M- (bottom) cone-isolating spots (75% contrast, 2 Hz, diameter = 2 mm) that stimulate both the center and the surround. Leak current is indicated by the gray shaded area. B, The leak-subtracted light-evoked current responses from A. C, Current–voltage relationships for the peak L versus M responses indicated in B (gray boxes). Fits to the data (Vh > −25 mV; see Materials and Methods) show that L and M currents reverse negative to Ecation (Erev, x-intercept; L versus M, Erev = −14 vs −13 mV) and have comparable conductances (Gt, y-intercept; L vs M, Gt = 9 vs 12 nS). D, Calculated excitatory (Gex, gray) and inhibitory (Gin, orange) conductances (shaded areas show SEM) as a function of time showing that excitatory conductances drive L versus M cone responses with minimal feedforward inhibition for OFF center midget cells.
Both inputs showed a nonlinear, J-shaped I–V relationship indicative of a large NMDA receptor-mediated excitatory component (Jahr and Stevens, 1990). The NMDA receptor conductance is voltage dependent as a result of extracellular Mg2+ block at hyperpolarized membrane potentials (Dingledine et al., 1999; Erreger et al., 2004). Blocking the NMDA receptor response with the competitive antagonist d-AP5 (100 μm) significantly attenuated the response (Fig. 4, left). In addition the I–V relationship for the residual response was well fit by a straight line, as expected for a pure AMPA receptor-mediated response (Fig. 4, right). The role played by this large NMDA receptor contribution to the midget cell light response is currently under investigation.
Figure 4.

Significant NMDA receptor contribution accounts for nonlinearities observed in the midget cell current–voltage relation. A, B, Stimulus-evoked current responses (left) to a sinusoidally modulated spot (diameter = 200 μm) and the I–V relationship (right) for the peak response (gray shaded area) recorded before (A) and after (B) bath application of the competitive NMDA receptor antagonist d-AP5 (100 μm). Control responses show a J-shaped nonlinear I–V relationship typical of an NMDA receptor contribution (A, right). In the presence of d-AP5, the total conductance was strongly attenuated and the I–V relationship became linear (B, right).
In this study, we fit the linear portion of the data (Vh > −25 mV) with a straight line to derive the conductance (slope) and reversal potential (x-intercept). The peak L and M responses for both OFF and ON center midget cells have similar conductances and reversal potentials negative to 0 mV (Figs. 2C, 3B). The matching reversal potentials near 0 mV indicate that both L and M inputs were primarily driven by excitatory conductances and that feedforward inhibition was present equally for each cone type (Fig. 5F, left).
Figure 5.
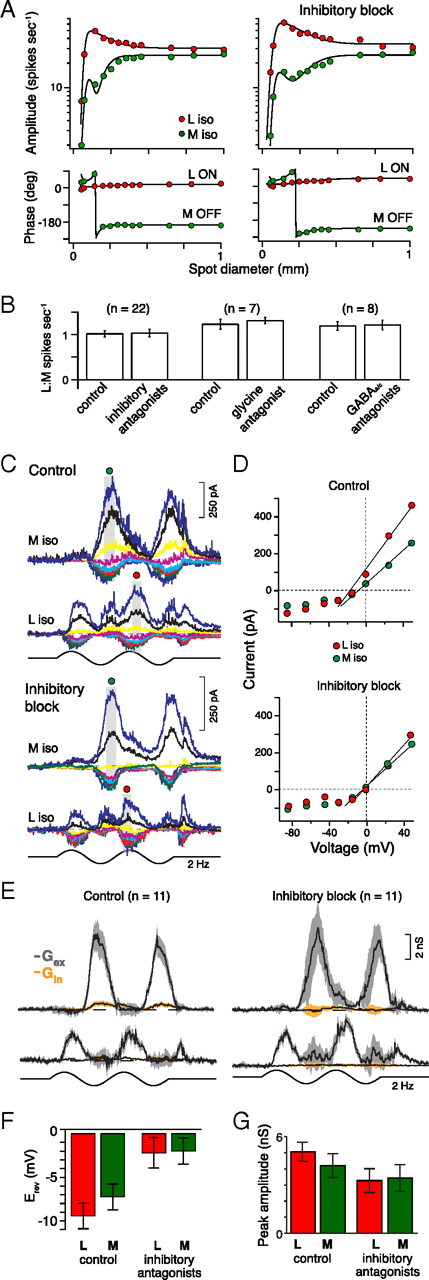
Block of inhibitory synaptic transmission does not alter L versus M cone opponency in midget cells. A, Spike responses to cone-isolating L (red) and M (green) spots (75% contrast, 2 Hz) as a function of increasing diameter before (left) and after (right) inhibitory block (bath application of glycine, GABAA, and GABAC receptor antagonists: strychnine, 1 μm; GABAzine, 5 μm; TPMPA, 50 μm, respectively). L versus M cone spike discharges to large spots (>150 μm diameter) remain opponent and balanced for both conditions. Responses were fit with DoG functions (solid lines). B, Pairwise comparison of average L:M response amplitudes to the largest spots (A) are compared across three conditions: the combination of glycine and GABA receptor antagonists (left; paired t test, p = 0.38, n = 22), the glycine receptor antagonist alone (middle; paired t test, p = 0.15, n = 7), and GABA receptor antagonists alone (right; paired t test, p = 0.40, n = 8). C, Excitatory L versus M cone current responses (Vh, between −85 and +50 mV) before (top) and after (bottom) inhibitory block (same stimuli as in Fig. 2A). D, Current–voltage relationships for the peak light-evoked L versus M cone responses indicated in C (gray boxes). After inhibitory block (bottom), reversal potentials shift toward 0 mV (L vs M control Erev, −19 vs −16 mV; after inhibitory block Erev, −3 vs −6 mV) and excitatory conductances persist (control L vs M Gt, 6.9 vs 5.6 nS; inhibitory block L vs M Gt, 4.1 vs 4.4 nS). E, Summary of OFF center midget cells' excitatory opponent conductances (gray) isolated after inhibitory block (right; n = 11; shaded areas show SEM). F, Bar plot of L versus M reversal potentials for all ON and OFF midget cells showing there was no significant difference between L versus M cone reversal potentials before (left; t test, p = 0.13, n = 18) or after inhibitory block (right; t test, p = 0.46, n = 18). G, Bar plot of L versus M response amplitudes (in nanosiemens) for all ON and OFF midget cells before (left) and after inhibitory block (right) show no significant difference for peak light-evoked L versus M cone excitatory conductances (as in B, t test, p = 0.44, n = 18).
To look at the relative excitatory versus inhibitory contributions as a function of the entire stimulus, we calculated separate excitatory and inhibitory conductances from the reversal potentials at all time points in the stimulus (see Materials and Methods). Across ON and OFF midget cells, the relative contribution of excitation to feedforward inhibition was comparable for both L and M cone inputs (Figs. 2D, 3C). L and M inhibitory conductances contributed 13.0 ± 1.4% versus 15.7 ± 3.0% (mean ± SEM; paired t test, p = 0.36, n = 31), respectively, of the total peak conductance. Thus, we find no evidence for direct or distinct cone-selective inhibitory inputs to be involved in generating “red–green” opponent responses.
Midget cell surround-dependent L versus M cone responses arise independently of glycinergic and GABAergic inhibition
Could L or M cone-selective inhibition act presynaptically by negative feedback at the bipolar cell or cone photoreceptor? We addressed this question by bath application of GABAA and GABAC, and glycine receptor antagonists (GABAzine, 5 μm; TPMPA, 50 μm; strychnine, 1 μm, respectively) either alone or in combination (Fig. 5A,B). We found no effect on the spatial tuning functions or response phase to L and M cone-isolating stimuli (Fig. 5A,B). Results were similar for the application of strychnine alone and the GABAA and GABAC receptor antagonists alone or in combination (Fig. 5B). Similarly, in voltage clamp inhibitory blockade isolated the L versus M excitatory conductances (Fig. 5C–F) and left opponency unaltered (Fig. 5C–E,G). The removal of feedforward inhibition was indicated by the parallel shift in the L and M reversal potentials toward 0 mV (Fig. 5D,F). We conclude that L versus M cone opponency in the midget cell circuit does not arise via GABAergic or glycinergic synaptic inhibition either presynaptically or postsynaptically. Therefore, we conclude that L versus M cone opponency must originate presynaptically in midget bipolar cells, which themselves display center–surround organization.
To eliminate the unlikely possibility that midget cells receive parallel cone-selective ON versus OFF excitatory bipolar cell input as shown for the “blue-yellow” small bistratified cell (Crook et al., 2009b), we bath applied the mGluR6 agonist l-AP4 (40 μm) to block the ON pathway. l-AP4 completely suppressed all light-evoked responses in ON midgets, but L versus M opponent responses in OFF midgets were not altered (Fig. 6), consistent with anatomical studies showing that only ON bipolar cells contact ON midget cells and OFF bipolar cells contact OFF midget cells.
Figure 6.
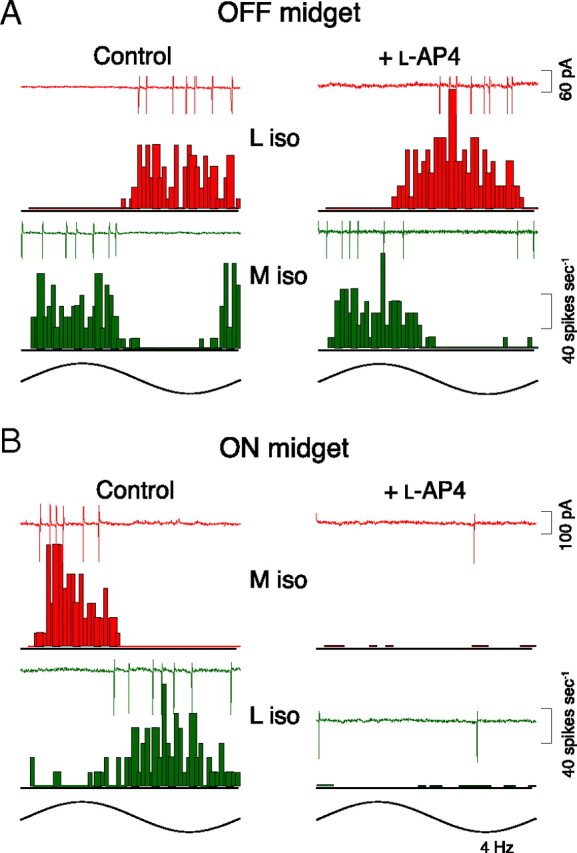
Parallel ON and OFF excitatory bipolar input does not relay L versus M cone opponent responses in midget cells. A, B, L versus M spike responses recorded before (left) and after (right) block of ON bipolar cell pathways with the mGluR6 agonist l-AP4 (40 μm) for OFF (A) and ON (B) center midget cells. ON midget cell opponent response is completely abolished by l-AP4; OFF pathway response persists with opponency unaltered.
With only ON or OFF bipolar cell input and no recourse to synaptic inhibition, how then does retinal circuitry generate the antagonistic surround critical for L versus M cone opponency in the midget pathway? As mentioned, midget bipolar cells display center–surround organization inherited from cones.
Nonsynaptic horizontal cell feedback mediates midget cell L versus M responses
L and M cones acquire surrounds via negative feedback from horizontal cells (Verweij et al., 2003). Recent evidence suggests that horizontal cells provide feedback to cones by a novel, nonsynaptic, pH-dependent mechanism that acts directly on the cone calcium current (Verweij et al., 1996). The precise nature of this mechanism remains controversial, though a critical role for protons serving a transmitter-like function is possible (Fahrenfort et al., 2009). In primate, enriching the pH-buffering capacity of the retina attenuates the surrounds of nonmidget ganglion cells, consistent with a proton-mediated feedback mechanism (Davenport et al., 2008; Crook et al., 2009b). We therefore tested the effect of adding HEPES buffer (20 mm; pH 7.4) to the Ames medium. We found that HEPES buffering completely and reversibly abolishes the midget ganglion cell surround and eliminates L versus M cone opponency (Fig. 7). In the presence of HEPES, L and M cone spatial tuning functions recorded to spike responses show no signs of surround antagonism, and to the broadest stimuli, L and M cone inputs remain in phase, reflecting the isolation of the receptive field center and absence of the surround (Fig. 7A, middle; B). With the washout of HEPES, surround antagonism and opponency were restored (Fig. 7A, right).
Figure 7.

Enrichment of retinal buffering eliminates the receptive field surround and abolishes red–green opponency in midget ganglion cells. A, L versus M spike responses (as in Fig. 6A) were abolished (middle; L and M inputs in phase) by enrichment of retinal buffering capacity with HEPES (20 mm; pH = 7.4). Opponent responses were recovered after washout of HEPES (right). Responses were fit with Gaussian functions in the presence of HEPES or DoG functions otherwise (solid lines). Top traces show 2 cycles of spike responses to a 1-mm-diameter spot for each condition shown below. B, L versus M spike response phase (degrees) to large spots (A) shifted from ∼180° out of phase (open circles) to in phase (solid circles) after the addition of HEPES (t test, p ≪ 0.001, n = 9). C, Family of L versus M light-evoked currents (Vh, between −85 and +50 mV) occur in phase after bath application of HEPES buffer (same stimuli as in Fig. 2A). D, Excitatory L versus M conductances occur in phase after bath application of HEPES buffer.
Correspondingly, in whole-cell voltage clamp, L versus M cone-evoked currents (Fig. 7C) and conductances (Fig. 7D) occurred in phase with the addition of HEPES. In summary, classic center and surround antagonism arising via horizontal cell feedback to cones drives L versus M opponent responses in ON and OFF center midget cells independent of synaptic inhibition.
Discussion
This study directly addresses the long-standing question of the role played by synaptic inhibition in L versus M cone or “red–green” opponency in midget ganglion cells (Wiesel and Hubel, 1966; Reid and Shapley, 1992, 2002; Lee, 1999; Buzás et al., 2006; Shapley, 2006; Solomon and Lennie, 2007). It has been suggested that inhibitory circuits establish cone type-selective surrounds to oppose the center cone type (Reid and Shapley, 1992; Lee et al., 1998; Benardete and Kaplan, 1999) or are recruited to bias the midget cell's receptive field center and surround toward opposing cone types (Buzás et al., 2006). However, when directly measured, we found that neither presynaptic nor postsynaptic inhibition played a role in generating L versus M cone opponency at the midget ganglion cell. The lack of cone type-specific inhibition was evident in the synaptic conductances derived from the current–voltage relations plotted in response to L or M cone-isolating stimuli (Figs. 2, 3) and was reinforced by the lack of effect of blocking GABAergic and glycinergic transmission on opponency (Fig. 5). Both direct measurement and block of synaptic inhibition are consistent with a previous electron microscopy study, which concluded that L or M cone-specific connectivity by amacrine cells to the midget circuit was not present (Calkins and Sterling, 1996).
The lack of a contribution from synaptic inhibition to midget L versus M cone opponency was unlikely to have been a consequence of artifactual physiological changes in vitro because prominent inhibitory conductances are a striking and consistent feature of the light-evoked response of a third major class of primate ganglion cell, the parasol cell (Crook et al., 2009a). Achromatic ON and OFF center parasol cells display a distinctive inhibitory conductance in opposite phase with excitation not observed in midget cells. This “crossover” inhibition was selectively attenuated in OFF center parasol cells by either strychnine or l-AP4 and thus appears to arise from the ON pathway via a bistratified, glycinergic amacrine cell (Manookin et al., 2008). Blocking inhibition in ON center parasols also revealed an unexpected OFF excitatory conductance that was masked by crossover inhibition. Thus, evidence is strong that the parasol cell light response is shaped by a prominent, easily measured, crossover inhibitory input—a synaptic mechanism distinctively absent in midget cells recorded under the same in vitro conditions.
Midget L versus M cone opponency was, however, completely abolished by enriching retinal buffering capacity with HEPES, effectively clamping retinal pH at 7.4. We have shown previously that bath application of HEPES attenuated the surrounds of parasol ganglion cells and altered the response dynamics of H1 horizontal cells, consistent with a block of horizontal cell feedback to cones (Davenport et al., 2008). A number of lines of evidence from experiments performed in nonmammalian retina also support the conclusion that HEPES blocks horizontal cell negative feedback (Hirasawa and Kaneko, 2003; Vessey et al., 2005; Cadetti and Thoreson, 2006). It is now well established that horizontal cell feedback to cones acts, via a nonsynaptic mechanism, to directly shift the activation range of the cone calcium current (Verweij et al., 1996), but the nature of the feedback mechanism and the precise role of protons remain controversial (Kreitzer et al., 2007; Fahrenfort et al., 2009). That nonsynaptic horizontal cell feedback can account for L versus M cone opponency without recourse to either presynaptic or postsynaptic inhibitory circuitry further constrains the possible source of any cone selectivity that could serve red–green opponency in the midget circuit. H1 horizontal cells, the origin of the surround in L and M cones (Verweij et al., 2003), show linear summation of nonselective L and M cone inputs (Dacheux and Raviola, 1990; Dacey et al., 1996, 2000; Goodchild et al., 1996; Deeb et al., 2000; Diller et al., 2004). Thus, the physiological weight of L and M cone inputs to the large H1 cell receptive field simply reflects the ratio of L and M cones at that retinal location (Dacey et al., 2000; Deeb et al., 2000) and therefore almost perfectly matches the cone ratios deduced from the spectral ERG of the macaque monkey (Jacobs and Deegan, 1997). Similarly, the ratio of L and M cones input strength in the receptive fields of spatially overlapping midget and parasol ganglion cells and H1 horizontal cells in the far retinal periphery is closely matched at any given retinal location (Diller et al., 2004).
For midget cells in the near periphery, we found mixed L and M cone inputs to both the surround and center of opponent midget cell receptive fields. By contrast, another recent study of parvocellular cells in the marmoset LGN using similar stimuli concluded that L versus M cone inputs were biased toward the center versus surround by “inhibitory mechanisms” (Buzás et al., 2006). Here we have shown that opponency persists essentially unaltered after blockade of synaptic inhibition. It is unclear why our results differ from those of Buzás et al. (2006), but different methods for determining cone input weights to the center and the surround may account for the disparity. Buzás et al. (2006) used responses to a single spot and annulus to determine L and M cone weights independent of any center–surround receptive field model. In the current study, we fit the data to a difference-of-Gaussian model that accounts for center and surround field overlap. We calculated cone weights from the best fits to L and M spatial tuning curves that included the response amplitude and phase for responses to at least 12 different-sized spots (n = 51), or for gratings presented at 19 different spatial frequencies (n = 18). From our dataset, the L percentage input weight to the broad surround was ∼50% (n = 69), as would be expected for a cone-mixed surround that reflects the L:M ratio in the cone mosaic (Roorda et al., 2001). By contrast, the percentage L cone input weight to the small receptive field center ranged from 0 to 100%, consistent with the patchy local variability in the proportion of L and M cones (Hofer et al., 2005) and the finding both anatomically (Jusuf et al., 2006a) and physiologically (Diller et al., 2004) that midget ganglion cells receive input nonselectively from all of the cones circumscribed by their dendritic trees.
Together, our results are consistent with the “random wiring” hypothesis and its corollary that the recent acquisition of L and M cone types in primate evolution gave rise to trichromatic color vision by simply using preexisting center–surround receptive field structure without the need to acquire L and M cone-specific circuitry (Mollon, 1989; Lennie et al., 1991; Wässle et al., 1993). Indeed, by eliminating synaptic inhibition as a possible locus of cone type-selective wiring (Fig. 5), the hypothesis of overall nonselective connectivity in the midget circuit appears to be greatly strengthened.
The key to the random-wiring hypothesis is that, for central single cone connecting midget cells, a “mixed surround” results in cone opponency with no further connectional specificity (Lennie et al., 1991). Here we have shown in addition that in the near retinal periphery, where the midget receptive field center receives mixed L and M cone input, the weaker cone input to the center is completely cancelled by surround inhibition, creating a sharp “spatiochromatic” notch in the spatial tuning function that separates chromatic responses to low-frequency, broad stimuli from achromatic responses to high-spatial-frequency or small-diameter stimuli (Fig. 1B,C). This distinctive chromatic-achromatic split appears to also be a simple consequence of the imbalance in L and M cone input weight to center versus surround (Fig. 1F, Table 1).
Gene therapy has recently been used to add a missing L-cone photopigment to the retinas of adult, color-deficient monkeys with the result that the missing dimension of red–green color vision appeared immediately upon the expression of the transgene, suggesting that beyond the presence of both L and M cone photopigments, no retinal rewiring was required to support red–green color vision behavior (Mancuso et al., 2009). While many speculations are possible for the underlying synaptic mechanism (Shapley, 2009; Mancuso et al., 2010), our demonstration of a lack of cone-selective inhibitory circuitry for midget cells and the critical role of the “mixed-surround” in cone opponency provides a parsimonious anatomical and physiological explanation for this unexpected result (Mollon, 1989; Mollon and Jordan, 1989; Lennie et al., 1991; Wässle et al., 1993). The abrupt acquisition of an L and M cone array via gene therapy simply capitalized on the preexisting midget center–surround receptive field structure, recapitulating a comparable event in primate evolution.
Footnotes
This work was supported by National Institutes of Health Grants RR00166 (Tissue Distribution Program of the National Primate Research Center at the University of Washington), EY06678 (D.M.D.), EY07031 (M.B.M.), and EY01730 (Vision Research Core). We thank Julian Vrieslander for programming assistance; John Troy and Jay Neitz for advice and discussion; and Beth Peterson and Toni Haun for technical assistance.
References
- Baylor DA, Lamb TD, Yau K-W. Responses of retinal rods to single photons. J Physiol. 1979;288:613–634. [PMC free article] [PubMed] [Google Scholar]
- Baylor DA, Nunn BJ, Schnapf JL. Spectral sensitivity of cones of the monkey Macaca fascicularis. J Physiol. 1987;390:145–160. doi: 10.1113/jphysiol.1987.sp016691. [DOI] [PMC free article] [PubMed] [Google Scholar]
- Benardete EA, Kaplan E. Dynamics of primate P retinal ganglion cells: responses to chromatic and achromatic stimuli. J Physiol. 1999;519:775–790. doi: 10.1111/j.1469-7793.1999.0775n.x. [DOI] [PMC free article] [PubMed] [Google Scholar]
- Borg-Graham LJ. The computation of directional selectivity in the retina occurs presynaptic to the ganglion cell. Nat Neurosci. 2001;4:176–183. doi: 10.1038/84007. [DOI] [PubMed] [Google Scholar]
- Buzás P, Blessing EM, Szmajda BA, Martin PR. Specificity of M and L cone inputs to receptive fields in the parvocellular pathway: random wiring with functional bias. J Neurosci. 2006;26:11148–11161. doi: 10.1523/JNEUROSCI.3237-06.2006. [DOI] [PMC free article] [PubMed] [Google Scholar]
- Cadetti L, Thoreson WB. Feedback effects of horizontal cell membrane potential on cone calcium currents studied with simultaneous recordings. J Neurophysiol. 2006;95:1992–1995. doi: 10.1152/jn.01042.2005. [DOI] [PMC free article] [PubMed] [Google Scholar]
- Calkins DJ, Sterling P. Absence of spectrally specific lateral inputs to midget ganglion cells in primate retina. Nature. 1996;381:613–615. doi: 10.1038/381613a0. [DOI] [PubMed] [Google Scholar]
- Calkins DJ, Sterling P. Evidence that circuits for spatial and color vision segregate at the first retinal synapse. Neuron. 1999;24:313–321. doi: 10.1016/s0896-6273(00)80846-6. [DOI] [PubMed] [Google Scholar]
- Calkins DJ, Schein SJ, Tsukamoto Y, Sterling P. M and L cones in macaque fovea connect to midget ganglion cells by different numbers of excitatory synapses. Nature. 1994;371:70–72. doi: 10.1038/371070a0. [DOI] [PubMed] [Google Scholar]
- Crook JD, Peterson BB, Packer OS, Robinson FR, Troy JB, Dacey DM. Y-cell receptive field and collicular projection of parasol ganglion cells in macaque monkey retina. J Neurosci. 2008;28:11277–11291. doi: 10.1523/JNEUROSCI.2982-08.2008. [DOI] [PMC free article] [PubMed] [Google Scholar]
- Crook JD, Troy JB, Packer OS, Vrieslander JD, Dacey DM. Contribution of excitatory and inhibitory conductances to receptive field structure in midget and parasol ganglion cells of macaque monkey retina. J Vis. 2009a;9:57. [Google Scholar]
- Crook JD, Davenport CM, Peterson BB, Packer OS, Detwiler PB, Dacey DM. Parallel ON and OFF cone bipolar inputs establish spatially-coextensive receptive field structure of blue-yellow ganglion cells in primate retina. J Neurosci. 2009b;29:8372–8387. doi: 10.1523/JNEUROSCI.1218-09.2009. [DOI] [PMC free article] [PubMed] [Google Scholar]
- Dacey DM. The mosaic of midget ganglion cells in the human retina. J Neurosci. 1993;13:5334–5355. doi: 10.1523/JNEUROSCI.13-12-05334.1993. [DOI] [PMC free article] [PubMed] [Google Scholar]
- Dacey DM, Lee BB. The blue-ON opponent pathway in primate retina originates from a distinct bistratified ganglion cell type. Nature. 1994;367:731–735. doi: 10.1038/367731a0. [DOI] [PubMed] [Google Scholar]
- Dacey DM, Lee BB, Stafford DK, Pokorny J, Smith VC. Horizontal cells of the primate retina: cone specificity without spectral opponency. Science. 1996;271:656–659. doi: 10.1126/science.271.5249.656. [DOI] [PubMed] [Google Scholar]
- Dacey DM, Diller LC, Verweij J, Williams DR. Physiology of L- and M-cone inputs to H1 horizontal cells in the primate retina. J Opt Soc Am A Opt Image Sci Vis. 2000;17:589–596. doi: 10.1364/josaa.17.000589. [DOI] [PubMed] [Google Scholar]
- Dacheux RF, Raviola E. Physiology of HI horizontal cells in the primate retina. Proc R Soc Lond B Biol Sci. 1990;239:213–230. doi: 10.1098/rspb.1990.0014. [DOI] [PubMed] [Google Scholar]
- Dartnall H. Photosensitivity. In: Dartnall H, editor. Photochemistry of vision. New York: Springer; 1972. pp. 122–145. [Google Scholar]
- Davenport CM, Detwiler PB, Dacey DM. Effects of pH buffering on horizontal and ganglion cell light responses in primate retina: evidence for the proton hypothesis of surround formation. J Neurosci. 2008;28:456–464. doi: 10.1523/JNEUROSCI.2735-07.2008. [DOI] [PMC free article] [PubMed] [Google Scholar]
- Deeb SS, Diller LC, Williams DR, Dacey DM. Interindividual and topographical variation of L:M cone ratios in monkey retinas. J Opt Soc Am A Opt Image Sci Vis. 2000;17:538–544. doi: 10.1364/josaa.17.000538. [DOI] [PubMed] [Google Scholar]
- De Monasterio FM, Gouras P. Functional properties of ganglion cells of the rhesus monkey retina. J Physiol. 1975;251:167–195. doi: 10.1113/jphysiol.1975.sp011086. [DOI] [PMC free article] [PubMed] [Google Scholar]
- Derrington AM, Krauskopf J, Lennie P. Chromatic mechanisms in lateral geniculate nucleus of macaque. J Physiol. 1984;357:241–265. doi: 10.1113/jphysiol.1984.sp015499. [DOI] [PMC free article] [PubMed] [Google Scholar]
- De Valois RL. Analysis and coding of color vision in the primate visual system. Cold Spring Harb Symp Quant Biol. 1965;30:567–579. doi: 10.1101/sqb.1965.030.01.055. [DOI] [PubMed] [Google Scholar]
- Diller L, Packer OS, Verweij J, McMahon MJ, Williams DR, Dacey DM. L and M cone contributions to the midget and parasol ganglion cell receptive fields of macaque monkey retina. J Neurosci. 2004;24:1079–1088. doi: 10.1523/JNEUROSCI.3828-03.2004. [DOI] [PMC free article] [PubMed] [Google Scholar]
- Dingledine R, Borges K, Bowie D, Traynelis SF. The glutamate receptor ion channels. Pharmacol Rev. 1999;51:7–61. [PubMed] [Google Scholar]
- Enroth-Cugell C, Robson JG, Schweitzer-Tong DE, Watson AB. Spatio-temporal interactions in cat retinal ganglion cells showing linear spatial summation. J Physiol. 1983;341:279–307. doi: 10.1113/jphysiol.1983.sp014806. [DOI] [PMC free article] [PubMed] [Google Scholar]
- Erreger K, Chen PE, Wyllie DJ, Traynelis SF. Glutamate receptor gating. Crit Rev Neurobiol. 2004;16:187–224. doi: 10.1615/critrevneurobiol.v16.i3.10. [DOI] [PubMed] [Google Scholar]
- Fahrenfort I, Steijaert M, Sjoerdsma T, Vickers E, Ripps H, van Asselt J, Endeman D, Klooster J, Numan R, ten Eikelder H, von Gersdorff H, Kamermans M. Hemichannel-mediated and pH-based feedback from horizontal cells to cones in the vertebrate retina. PloS One. 2009;4:e6090. doi: 10.1371/journal.pone.0006090. [DOI] [PMC free article] [PubMed] [Google Scholar]
- Goodchild AK, Chan TL, Grünert U. Horizontal cell connections with short-wavelength-sensitive cones in macaque monkey retina. Vis Neurosci. 1996;13:833–845. doi: 10.1017/s0952523800009093. [DOI] [PubMed] [Google Scholar]
- Hirasawa H, Kaneko A. pH changes in the invaginating synaptic cleft mediate feedback from horizontal cells to cone photoreceptors by modulating Ca2+ channels. J Gen Physiol. 2003;122:657–671. doi: 10.1085/jgp.200308863. [DOI] [PMC free article] [PubMed] [Google Scholar]
- Hofer H, Carroll J, Neitz J, Neitz M, Williams DR. Organization of the human trichromatic cone mosaic. J Neurosci. 2005;25:9669–9679. doi: 10.1523/JNEUROSCI.2414-05.2005. [DOI] [PMC free article] [PubMed] [Google Scholar]
- Jacobs GH, Deegan JF., 2nd Spectral sensitivity of macaque monkeys measured with ERG flicker photometry. Vis Neurosci. 1997;14:921–928. doi: 10.1017/s0952523800011639. [DOI] [PubMed] [Google Scholar]
- Jahr CE, Stevens CF. Voltage dependence of NMDA-activated macroscopic conductances predicted by single-channel kinetics. J Neurosci. 1990;10:3178–3182. doi: 10.1523/JNEUROSCI.10-09-03178.1990. [DOI] [PMC free article] [PubMed] [Google Scholar]
- Johnston D, Wu S-S. Cambridge, MA: MIT Press; 1995. Foundation of cellular neurophysiology. [Google Scholar]
- Jusuf PR, Martin PR, Grünert U. Random wiring in the midget pathway of primate retina. J Neurosci. 2006a;26:3908–3917. doi: 10.1523/JNEUROSCI.4891-05.2006. [DOI] [PMC free article] [PubMed] [Google Scholar]
- Jusuf PR, Martin PR, Grünert U. Synaptic connectivity in the midget-parvocellular pathway of primate central retina. J Comp Neurol. 2006b;494:260–274. doi: 10.1002/cne.20804. [DOI] [PubMed] [Google Scholar]
- Kolb H, Dekorver L. Midget ganglion cells of the parafovea of the human retina: a study by electron microscopy and serial section reconstructions. J Comp Neurol. 1991;303:617–636. doi: 10.1002/cne.903030408. [DOI] [PubMed] [Google Scholar]
- Kreitzer MA, Collis LP, Molina AJ, Smith PJ, Malchow RP. Modulation of extracellular proton fluxes from retinal horizontal cells of the catfish by depolarization and glutamate. J Gen Physiol. 2007;130:169–182. doi: 10.1085/jgp.200709737. [DOI] [PMC free article] [PubMed] [Google Scholar]
- Lankheet MJM, Lennie P, Krauskopf J. Temporal-chromatic interactions in LGN P-cells. Vis Neurosci. 1998;15:47–54. doi: 10.1017/s0952523898151015. [DOI] [PubMed] [Google Scholar]
- Lee BB. Receptor inputs to primate ganglion cells. In: Gegenfurtner KR, Sharpe LT, editors. Color vision: from genes to perception. New York: Cambridge UP; 1999. pp. 203–218. [Google Scholar]
- Lee BB, Kremers J, Yeh T. Receptive fields of primate retinal ganglion cells studied with a novel technique. Vis Neurosci. 1998;15:161–175. doi: 10.1017/s095252389815112x. [DOI] [PubMed] [Google Scholar]
- Lee BB, Martin PR, Grünert U. Retinal connectivity and primate vision. Prog Retin Eye Res. 2010;29:622–639. doi: 10.1016/j.preteyeres.2010.08.004. [DOI] [PMC free article] [PubMed] [Google Scholar]
- Lennie P, Movshon JA. Coding of color and form in the geniculostriate visual pathway (invited review) J Opt Soc Am A Opt Image Sci Vis. 2005;22:2013–2033. doi: 10.1364/josaa.22.002013. [DOI] [PubMed] [Google Scholar]
- Lennie P, Haake PW, Williams DR. The design of chromatically opponent receptive fields. In: Landy MS, Movshon JA, editors. Computational models of visual processing. Cambridge, MA: MIT Press; 1991. pp. 71–82. [Google Scholar]
- Mancuso K, Hauswirth WW, Li Q, Connor TB, Kuchenbecker JA, Mauck MC, Neitz J, Neitz M. Gene therapy for red-green colour blindness in adult primates. Nature. 2009;461:784–787. doi: 10.1038/nature08401. [DOI] [PMC free article] [PubMed] [Google Scholar]
- Mancuso K, Mauck MC, Kuchenbecker JA, Neitz M, Neitz J. A multistage color model revisited: implications for a gene therapy cure for red-green colorblindness. Adv Exp Med Biol. 2010;664:631–638. doi: 10.1007/978-1-4419-1399-9_72. [DOI] [PMC free article] [PubMed] [Google Scholar]
- Manookin MB, Beaudoin DL, Ernst ZR, Flagel LJ, Demb JB. Disinhibition combines with excitation to extend the operating range of the OFF visual pathway in daylight. J Neurosci. 2008;28:4136–4150. doi: 10.1523/JNEUROSCI.4274-07.2008. [DOI] [PMC free article] [PubMed] [Google Scholar]
- Martin PR, Lee BB, White AJ, Solomon SG, Rüttiger L. Chromatic sensitivity of ganglion cells in the peripheral primate retina. Nature. 2001;410:933–936. doi: 10.1038/35073587. [DOI] [PubMed] [Google Scholar]
- McMahon MJ, Packer OS, Dacey DM. The classical receptive field surround of primate parasol ganglion cells is mediated primarily by a non-GABAergic pathway. J Neurosci. 2004;24:3736–3745. doi: 10.1523/JNEUROSCI.5252-03.2004. [DOI] [PMC free article] [PubMed] [Google Scholar]
- Mollon JD. “Tho' she kneel'd in that place where they grew.” The uses and origins of primate colour vision. J Exp Biol. 1989;146:21–38. doi: 10.1242/jeb.146.1.21. [DOI] [PubMed] [Google Scholar]
- Mollon JD, Jordan G. Eine evolutionäre Interpretation des menschlichen Farbensehens. Die Farbe. 1989;35/36:139–170. [Google Scholar]
- Packer OS, Verweij J, Li PH, Schnapf JL, Dacey DM. Blue-yellow opponency in primate S cone photoreceptors. J Neurosci. 2010;30:568–572. doi: 10.1523/JNEUROSCI.4738-09.2010. [DOI] [PMC free article] [PubMed] [Google Scholar]
- Paulus W, Kröger-Paulus A. A new concept of retinal colour coding. Vision Res. 1983;23:529–540. doi: 10.1016/0042-6989(83)90128-1. [DOI] [PubMed] [Google Scholar]
- Reid RC, Shapley RM. Spatial structure of cone inputs to receptive fields in primate lateral geniculate nucleus. Nature. 1992;356:716–718. doi: 10.1038/356716a0. [DOI] [PubMed] [Google Scholar]
- Reid RC, Shapley RM. Space and time maps of cone photoreceptor signals in macaque lateral geniculate nucleus. J Neurosci. 2002;22:6158–6175. doi: 10.1523/JNEUROSCI.22-14-06158.2002. [DOI] [PMC free article] [PubMed] [Google Scholar]
- Roorda A, Metha AB, Lennie P, Williams DR. Packing arrangement of the three cone classes in primate retina. Vision Res. 2001;41:1291–1306. doi: 10.1016/s0042-6989(01)00043-8. [DOI] [PubMed] [Google Scholar]
- Shapley R. Specificity of cone connections in the retina and color vision. Focus on “specificity of cone inputs to macaque retinal ganglion cells.”. J Neurophysiol. 2006;95:587–588. doi: 10.1152/jn.01054.2005. [DOI] [PMC free article] [PubMed] [Google Scholar]
- Shapley R. Gene therapy in colour. Nature. 2009;461:737–739. doi: 10.1038/461737a. [DOI] [PubMed] [Google Scholar]
- Solomon SG, Lennie P. The machinery of colour vision. Nat Rev Neurosci. 2007;8:276–286. doi: 10.1038/nrn2094. [DOI] [PubMed] [Google Scholar]
- Taylor WR, Vaney DI. Diverse synaptic mechanisms generate direction selectivity in the rabbit retina. J Neurosci. 2002;22:7712–7720. doi: 10.1523/JNEUROSCI.22-17-07712.2002. [DOI] [PMC free article] [PubMed] [Google Scholar]
- Troy JB, Lee BB. Steady discharges of macaque retinal ganglion cells. Vis Neurosci. 1994;11:111–118. doi: 10.1017/s0952523800011159. [DOI] [PubMed] [Google Scholar]
- Verweij J, Kamermans M, Spekreijse H. Horizontal cells feed back to cones by shifting the cone calcium-current activation range. Vision Res. 1996;36:3943–3953. doi: 10.1016/s0042-6989(96)00142-3. [DOI] [PubMed] [Google Scholar]
- Verweij J, Hornstein EP, Schnapf JL. Surround antagonism in macaque cone photoreceptors. J Neurosci. 2003;23:10249–10257. doi: 10.1523/JNEUROSCI.23-32-10249.2003. [DOI] [PMC free article] [PubMed] [Google Scholar]
- Vessey JP, Stratis AK, Daniels BA, Da Silva N, Jonz MG, Lalonde MR, Baldridge WH, Barnes S. Proton-mediated feedback inhibition of presynaptic calcium channels at the cone photoreceptor synapse. J Neurosci. 2005;25:4108–4117. doi: 10.1523/JNEUROSCI.5253-04.2005. [DOI] [PMC free article] [PubMed] [Google Scholar]
- Wässle H, Grünert U, Martin PR, Boycott BB. Color coding in the primate retina: predictions and constraints from anatomy. In: Albowitz B, Albus K, Kuhnt U, Northdurft H-C, Wahle P, editors. Structural and functional organization of the neocortex (Experimental brain research series 24) Springer; 1993. pp. 94–104. [Google Scholar]
- Wiesel TN, Hubel DH. Spatial and chromatic interactions in the lateral geniculate body of the rhesus monkey. J Neurophysiol. 1966;29:1115–1156. doi: 10.1152/jn.1966.29.6.1115. [DOI] [PubMed] [Google Scholar]