

Abstract
(1) The role of the ubiquinone pool in the reactions of the cyclic electron-transfer chain has been investigated by observing the effects of reduction of the ubiquinone pool on the kinetics and extent of the cytochrome and electrochromic carotenoid absorbance changes following flash illumination. (2) In the presence of antimycin, flash-induced reduction of cytochrome b-561 is dependent on a coupled oxidation of ubiquinol. The ubiquinol oxidase site of the ubiquinol:cytochrome c2 oxidoreductase catalyses a concerted reaction in which one electron is transferred to a high-potential chain containing cytochromes c1 and c2, the Rieske-type iron-sulfur center, and the reaction center primary donor, and a second electron is transferred to a low-potential chain containing cytochromes b-566 and b-561. (3) The rate of reduction of cytochrome b-561 in the presence of antimycin has been shown to reflect the rate of turnover of the ubiquinol oxidase site. This diagnostic feature has been used to measure the dependence of the kinetics of the site on the ubiquinol concentration. Over a limited range of concentration (0–3 mol ubiquinol/mol cytochrome b-561), the kinetics showed a second-order process, first order with respect to ubiquinol from the pool. At higher ubiquinol concentrations, other processes became rate determining, so that above approx. 25 mol ubiquinol/mol cytochrome b-561, no further increase in rate was seen. (4) The kinetics and extents of cytochrome b-561 reduction following a flash in the presence of antimycin, and of the antimycin-sensitive reduction of cytochrome c1 and c2, and the slow phase of the carotenoid change, have been measured as a function of redox potential over a wide range. The initial rate for all these processes increased on reduction of the suspension over the range between 180 and 100 mV (pH 7). The increase in rate occurred as the concentration of ubiquinol in the pool increased on reduction, and could be accounted for in terms of the increased rate of ubiquinol oxidation. It is not necessary to postulate the presence of a tightly bound quinone at this site with altered redox properties, as has been previously assumed. (5) The antimycin-sensitive reactions reflect the turnover of a second catalytic site of the complex, at which cytochrome b-561 is oxidized in an electrogenic reaction. We propose that ubiquinone is reduced at this site with a mechanism similar to that of the two-electron gate of the reaction center. We suggest that antimycin binds at this site, and displaces the quinone species so that all reactions at the site are inhibited. (6) In coupled chromatophores, the turnover of the ubiquinone reductase site can be measured by the antimycin-sensitive slow phase of the electrochromic carotenoid change. At redox potentials higher than 180 mV, where the pool is completely oxidized, the maximal extent of the slow phase is half that at 140 mV, where the pool contains approx. 1 mol ubiquinone/mol cytochrome b-561 before the flash. At both potentials, cytochrome b-561 became completely reduced following one flash in the presence of antimycin. The results are interpreted as showing that at potentials higher than 180 mV, ubiquinol stoichiometric with cytochrome b-561 reaches the complex from the reaction center. The increased extent of the carotenoid change, when one extra ubiquinol is available in the pool, is interpreted as showing that the ubiquinol oxidase site turns over twice, and the ubiquinone reductase sites turns over once, for a complete turnover of the ubiquinol:cytochrome c2 oxidoreductase complex, and the net oxidation of one ubiquinol/complex. (7) The antimycin-sensitive reduction of cytochrome c1 and c2 is shown to reflect the second turnover of the ubiquinol oxidase site. (8) We suggest that, in the presence of antimycin, the ubiquinol oxidase site reaches a quasi equilibrium with ubiquinol from the pool and the high- and low-potential chains, and that the equilibrium constant of the reaction catalysed constrains the site to the single turnover under most conditions. (9) The results are discussed in the context of a detailed mechanism. The modified Q-cycle proposed is described by physicochemical parameters which account well for the results reported.
Keywords: Ubiquinone, Carotenoid, Cytochrome b, Bacterial photosynthesis, Electron transfer, (Rps. sphaeroides)
Introduction
The involvement of ubiquinone in the photosynthetic electron-transfer chain of Rhodopseudomonas sphaeroides and Rps. capsulata has previously been discussed in terms of a number of specialized quinones identified by the characteristics of particular reactions of the chain, and the behavior with respect to extraction, redox potential and kinetics of interaction with reaction partners [1-6].
The identification of these ‘special’ quinone species has left open the question of the role of the bulk of the ubiquinone, which forms a thermodynamically homogeneous pool, QP, accounting for approx. 80–90% of the ubiquinone in Rps. sphaeroides and Rps. capsulata [7–9]. A great deal of work on mitochondrial systems has established that the quinone pool can be oxidized and reduced at rates compatible with a direct role in electron transfer, and it has been shown that ubiquinone can be reduced by the substrate dehydrogenases, and ubiquinol oxidized by the ubiquinol:cytochrome c oxidoreductase [10–16]. These observations have led to the concept of a role for the bulk quinone as an H-transfer reagent between the low- and intermediate-potential complexes of the respiratory chain. In contrast, in chromatophores it has been shown that a substantial fraction of the total ubiquinone (approx. 80–90%) can be extracted without impairing the rapid electron transfer observed at ambient redox potentials around 90 mV at pH 7 on flash illumination [7,17]. More extensive extraction leads to loss of the phenomena associated with rapid turnover of the ubiquinol:cytochrome c2 oxidoreductase complex, and further extraction leads to loss of the secondary acceptor quinone, QB [8]. The primary acceptor, QA, is lost only after a more drastic extraction.
A number of mechanisms have been suggested to account for the involvement of the quinone species identified. For the ubiquinol:cytochrome c2 oxidoreductase, the mechanisms proposed have been either linear [18,19], or variants of the Q-cycle originally proposed by Mitchell [1–3,18,20–24].
In previous versions of the Q-cycle proposed to operate in Rps. sphaeroides, a central role has been assigned to a special quinone, QZ, assumed to be present at a specific binding site with a stoichiometry of 0.7 QZ/reaction center [4,5,7,20]. The redox midpoint potential of QZ (Em,7 for the couple QZ/QZH2 of approx. 150 mV, varying by −60 mV/pH unit, n value of 2), has not been measured directly, but has been estimated from the dependence on ambient redox potential (Eh), and pH, of the rate of the antimycin-sensitive reduction of cytochrome c (c1 and c2) [4,5,20,25]. At values of Eh above the supposed Em of QZ/QZH2, no rapid reduction was seen; below the Em, cytochrome c was reduced in a reaction of t1/2 ≈ 1–2 ms which was antimycin sensitive. A number of other phenomena were also associated with the antimycin-sensitive reaction which titrated in with an apparent Em,7 ≈ 150 mV. These were the slow phase (t1/2 ≈ 1–2 ms, Phase III) of the carotenoid electrochromic change [5,26,27], and the oxidation (t1/2 ≈ 1–2 ms) of cytochrome b-561 (Em,7 ≈ 50 mV, λmax of α-band at 561 nm) [18,28], both of which were also sensitive to antimycin; in addition, an increase in the rate of reduction of cytochrome b-561 titrated in with an apparent Em,7 similar to that of the antimycin-sensitive reactions above, but, in contrast, was most easily observed in the presence of antimycin [4,29,30]. The half-time for the rapid reduction (t1/2 ≈ 500–700 μs after a lag phase of 150–200 μs [29]) was faster than the antimycin-sensitive reduction of cytochrome c, which had been assumed to reflect oxidation of QZH2, and this fact had appeared to be incompatible with a simple Q-cycle [18,19,25].
Measurement of the stoichiometry of QZ has been more controversial. On the basis of the variation of t1/2 for reduction of cytochrome c with changes in the initial concentration of ferricytochrome c (achieved by varying the flash intensity), Dutton and colleagues [1,3,20] concluded that cytochrome c was reduced in a second-order process in which the reductant (assumed to be QZH2) had a maximal concentration of 0.8 ± 0.1 mol/mol reaction center. Crofts et al. [18,25,32] had noted the second-order character of the process leading to cytochrome c reduction in Rps. capsulata, but observed that the rate of reduction continued to increase after the amplitude of the antimycin-sensitive phase of reduction had become maximal. They suggested that the reductant must be present in about 4-fold excess over the cytochrome c at Eh values where the rate was maximal [18,25,32], and that the true Em value for the couple providing the reductant might therefore be more negative than that suggested by the titration curve. On the basis of this observation and other considerations, it had been speculated that the reaction between QH2 and its oxidant may reflect a second-order process in which the reductant was not a special bound quinol, but a quinol from the pool [18,25,32–34]. This suggestion, which had been discussed extensively by Rich [34], seemed to be contradicted by experiments in which the phenomena associated with reduction of QZ were measured in chromatophores from which the quinone was partially extracted [7,35]. The phenomena were still observed after extraction of about 80% of the bulk quinone.
In a new formulation of a Q-cycle mechanism [23,24], we were led to suggest that the quinol reacting to provide the reductant for cytochrome c (the QZH2 in previous formulations) must be in rapid equilibrium with the quinone pool. In the present paper, we show that the phenomena attributed to a special bound quinone (QZ) can be adequately explained in terms of a second-order reaction of QH2 from the pool with its reaction partner, the oxidized complex. Although we cannot exclude the possibility that a weak preferential binding of QH2 occurs at the QZ site, the phenomena which have previously been suggested to show such a binding can be accounted for by the redox properties of the bulk quinone and the components of ubiquinol:cytochrome c2 oxidoreductase system, the relative stoichiometries of the components with respect to the reaction center, and the measured rate constants for the reactions. These parameters are discussed in the context of a Q-cycle mechanism in which a ubiquinol oxidase site of the ubiquinol:cytochrome c2 oxidoreductase undergoes a double turnover, and a ubiquinone reductase site turns over once, to complete the oxidation of one equivalent of QH2 and the reduction of two equivalents of the oxidant, P+.
Materials and Methods
Chromatophores of Rps. sphaeroides strain Ga were prepared as described in Ref. 36. The cytochrome b kinetics were measured as described in the companion paper [38]. Cytochrome c (c1 + c2) changes were measured at 551 nm minus 542 nm and the carotenoid band shift was measured at 503 nm. Redox titrations were performed as described in Ref. 36. Samples were placed in either a stirred anaerobic redox cuvette or were provided by a flow system described in Ref. 38.
Flash kinetics were measured on two different kinetic single-beam spectrophotometers. One, which was interfaced with a Digital Equipment Corporation (DEC) PDP 11/34 instrument, has been described earlier (26, 31). The other was a home-built single-beam spectrophotometer interfaced with a DEC LSI 11/2 microcomputer. The measuring beam was shuttered and could be opened by the computer at variable times before the flash. The photomultiplier signal was fed to an amplifier decoder circuit similar to that described in Ref. 39, except that a rapid analogue divide circuit (Analogue Devices 429A, 10 MHz band-width) was added to the output stage (output = ΔI/I × 100 V). The output was then sent to a transient digitizer (Datalab Model DL 901) which was linked to the computer. In most experiments, the flashlamp used incorporated a custom-built discharge tube (T.W. Wingent Ltd., Cambridge, U.K.) which gave a flash width of approx. 25 μs at half-maximal amplitude [31]. In some experiments requiring double flashes, two units mounted on opposite sides of the cuvette housing were used. Each incorporated a flash bulb (EGG FX200) giving flashes of a duration of approx. 3.5 μs at half-maximal amplitude. In all experiments the concentration of chromatophores was adjusted so that a single flash induced turnover in greater than 90% of the reaction centers. The mediators and ionophores were as described in Ref. 38. In experiments in which the carotenoid change was measured, no ionophores were added.
Results
The pathway for reduction of cytochrome b-561
A common feature of all Q-cycle mechanisms is the oxidation of ubiquinol by two single-electron processes in which one electron is passed to an electron-transport chain containing the high-potential components and one to a low-potential chain containing the b-type cytochromes [3,21,22,37] (Scheme I). Scheme I shows a truncated Q-cycle with antimycin acting as an inhibitor of cytochrome b-561 oxidation, in a pathway with cytochrome b-566 (Em,7 ≈ −90 mV, double α-band with peaks at 559 and 566 nm [31,38]) as the immediate acceptor of electrons from the semiquinone. In the companion paper [38] we have discussed the involvement of cytochrome b-566 in greater detail.
SCHEME I. THE REACTIONS OF THE Q-CYCLE INVOLVED IN UBIQUINOL OXIDATION.
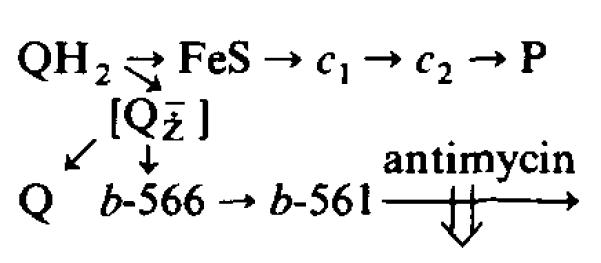
See text for explanation. [] is the semiquinone assumed to be formed transiently at the catalytic site.
It is apparent from the scheme that reduction of cytochrome b-561 and electron flow into the high-potential chain are expected to be linked processes dependent on the availability of QH2 as a reductant [18]. The reduction of cytochrome b-561 has previously been shown to occur over a wide range of redox potentials [4,29,36,40,41]. Several properties of the reduction kinetics have been observed over different redox ranges [4,29,36,38,42].
Bowyer et al. [36] showed that at high redox potential (Eh < 300 mV), a binary pattern of cytochrome b-561 reduction as a function of flash number from the dark-adapted state could be observed. They interpreted the pattern as showing that cytochrome b-561 reduction could occur only when QB had been reduced by two successive photochemical events to the quinol, through the mechanism of the two-electron gate [43-45].
Evans and Crofts [4] observed that in chromatophores from Rps. capsulata, the rate of reduction of cytochrome b-561 became more rapid as the redox potential was lowered through an apparent Em,7 of ≈ 120 mV. A similar acceleration was observed in Rps. sphaeroides by Bowyer and Crofts [29].
Evans [42] noted that at higher values of Eh (greater than 150 mV) the slow rate of reduction of cytochrome b-561 (t1/2 ≈ 6 ms), observed following a single-turnover flash from a laser, could be speeded up (t1/2 ≈ 3 ms) by using a longer flash (500 μs at half height).
In terms of previous Q-cycle mechanisms, these observations were not easily explained, and it had been suggested that alternative mechanisms for reduction of cytochrome b-561 must exist in which the pathway for reduction did not involve QZ [1,3,47]. We have previously pointed out that the experimental results could be easily reconciled with a Q-cycle mechanism if it was assumed that ubiquinol from the pool was able to react at the QZ site, and that ubiquinol produced at the QB site was also able to equilibrate rapidly with the pool [23,24]. We have therefore reinvestigated the kinetics of cytochrome b-561 reduction with a view to testing the hypothesis that the quinol donating reducing equivalents to the Q-cycle is indistinguishable from quinol of the pool.
Kinetics of cytochrome b-561 reduction
In Figs. 1 and 2 we show typical traces of cytochrome b-561 reduction kinetics, in the presence of antimycin, following one or two flashes variously spaced, given to chromatophores of Rps. sphaeroides poised at several values of Eh. In Fig. 1, traces A and B show the first two points of the binary pattern observable at high Eh (approx. 400 mV) [36], with flashes spaced several seconds apart to allow rereduction of P+ [36]. Also shown are the initial kinetics of rereduction of P+ (traces C and D). At this Eh, the extent of reduction of cytochrome b-561 on a second flash was maximal only if a long dark time (td > 4 s) was allowed between flashes; two closely spaced flashes (td < 20 ms) did not lead to a greater extent of reduction of cytochrome b-561 than one flash. The greater extent of reduction of cytochrome b-561 on the second flash spaced several seconds after the first was accompanied by a more extensive and rapid rereduction of P+. This latter effect was somewhat variable, and had not been observed in previous experiments [36]. It seems possible that some variable fraction of reducing equivalents can be lost to ferricyanide, present at relatively high concentration to act as a redox buffer, but this variability has not yet been investigated in detail.
Fig. 1.
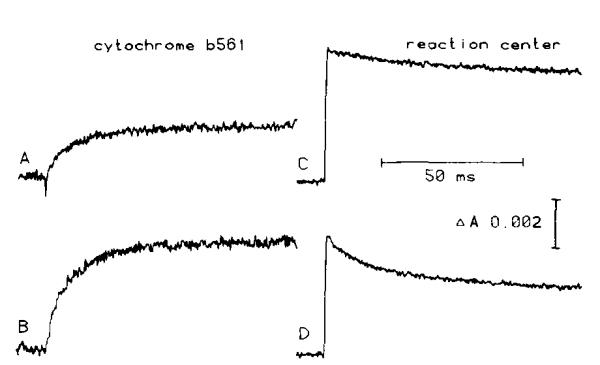
The extent and initial rate of cytochrome b-561 reduction, and reaction center rereduction, as a function of flash number. Traces A and B represent the reduction (upward deflection) of cytochrome b-561, measured at 561 nm minus 569 nm, after one or two flashes, respectively. Traces C and D, flash one and two respectively, show the effect of flash number on reaction center rereduction, measured at 542 nm. The redox potential was adjusted to 400±2 mV by addition of small amounts of ferricyanide. The redox mediators used were phenazine methosulfate, phenazine ethosulfate, pyocyanin and TMPD at 1 μM; and 1,2-naphthoquinone, 1,4-naphthoquinone and duroquinone at 10 μM. Traces (average of four, 200 μs instrument response time) were obtained from chromatophores (approx. 0.6 μM reaction center) suspended in buffer (50 mM Mops, 100 mM KCI, pH 7.0), and excited by two consecutive flashes 5 s apart.
Fig. 2.

Kinetic traces of cytochrome b-561 reduction at different values of Eh. Left column: traces showing the acceleration in rate of reduction after one short flash (sweep 10 ms full scale, time constant 10 μs, average of 16). The two traces on the right, top, show the full extent of cytochrome b-561 reduction after one flash, at 200 and 120 mV, respectively (sweep 100 ms full scale, time constant 100 μs, average of two). The two lower traces are the reduction rate after two flashes places 700 μs apart at two values of Eh (sweep 10 ms full scale, time constant 10 μs, average of 16). The mediators present were 1 μM each of phenazine methosulfate, phenazine ethosulfate and pyocyanin; 10 μM each of 1,2-naphthoquinone, 1,4-naphthoquinone, p-benzoquinone and duroquinone; and 2 μM DAD. Valinomycin and nigericin at 2 μM and antimycin at 10 μM were also added. The reaction center concentration was 0.42 μM for all traces. A dark period of 60 s was allowed between flashes or pairs of flashes.
At redox potentials below Eh ≈ 250 mV (Fig. 2), where the components of the high-potential chain were reduced before the flash, the rate of reduction of cytochrome b-561 was approximately doubled if a second flash was given shortly (300 μs–1 ms) after the first. As the ambient potential was lowered, the rate of reduction on the first flash increased as previously observed [4,29], and the accelerating effect of a second flash became less significant. At Eh < 120 mV no increase in rate or extent of reduction with a second flash was seen. The extent of cytochrome b-561 reduction on a single flash increased only slightly (less than 20%) over the Eh range in which the rate increased 6–8-fold [29].
Fig. 2 shows that at all values of Eh, there is a lag between the time of flash and the beginning of reduction of cytochrome b-561 [29]. The lag was greatest (approx. 1 ms) at high Eh, and became shorter (approx. 200 μs) as the Eh was lowered through the range about 160 mV, reaching a minimal value (approx. 200 μs) at Eh ≈ 120 mV. As previously noted [29], at values of Eh between 80 and 100 mV the kinetics of reduction of cytochrome b-561 in the presence of antimycin are similar (lag time approx. 200μs, t1/2 of reduction after the lag approx. 700 μs) to the kinetics of the electron transfer through the Rieske-type FeS center to ferricytochromes c1 and c2, and to P, which is sensitive to UHDBT but not to antimycin.
Fig. 3 summarizes the results of experiments similar to those of Fig. 2 in which the maximal rate of reduction of cytochrome b-561 (corresponding to the initial rate after the lag) after one flash, or two closely spaced flashes, is plotted as a function of Eh. Over the range of Eh between 250 and 180 mV, the curve for the two-flash experiments shows a rate about twice that observed following a single flash; the two-flash curve then converges with the one-flash curve over the range of Eh ≈ 180–120 mV, where the one-flash curve rises towards its maximal value. Also plotted are the duration of the lag, which reached a minimum over the Eh range 180–120 mV, with a midpoint at Em ≈ 160 mV, and the maximal extent of reduction following a single flash, which showed a small increase over the Eh range of approx. 160 mV.
Fig. 3.
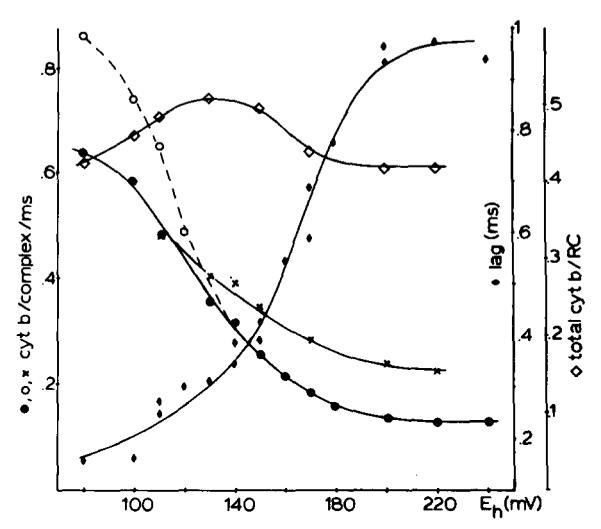
Titration of extent and kinetics of reduction of cytochrome b-561. The filled circles show initial rates for cytochrome b-561 reduction from traces such as those in Fig. 2, assuming a value of 20 mM−1·cm−1 at 561–569 nm for the extinction coefficient of cytochrome b-561 and 1 cytochrome b-561 per oxidoreductase complex. In these experiments a flash of duration of approx. 3.5 μs at half amplitude was used. The open circles show the rates at low Eh obtained by using a flash with longer duration (25 μs), for comparison with the results of Figs. 7 and 8 in which a similar flash was used. The differences between the two curves can be ascribed to double hits of the reaction center using the longer flash. The crosses show the titration when two short (3.5 μs) flashes were used with 700 μs between the flashes. The total extents of cytochrome b-561 reduction after one flash are plotted using open diamonds. The lag times between the flash and the start of cytochrome b-561 reduction are shown with full diamonds. RC, reaction center.
Fig. 4 shows the time course of cytochrome b-561 reduction at several values of Eh, plotted to test for second-order kinetics. The data are summarized in Table I. Estimation of the initial values of concentration of components was based on the stoichiometries and redox potentials shown in the legend to Table II, and on the assumption that the quinone pool resides in the lipid phase of the membrane composed of 40% lipid. The data have been plotted to test for conformity with the integrated second-order rate equation:
in which the subscripts t and 0 refer to concentrations at time t, and at zero time, respectively. This treatment assumes that the second-order process:
occurs with a rate:
which is determined solely by the concentration of the reactants and the forward rate constant over the period of measurement. This assumption will be valid if the equilibrium constant for the reaction is large, so that k2 >> k−2. The value can be obtained from
Fig. 4.

Second-order kinetics of cytochrome b-561 reduction. Kinetic traces of cytochrome b-561 reduction as in Fig. 2 were analyzed for second-order reaction. In this figure, ln([QH2]/[b-561(ox)]) is plotted against time for several values of Eh. The estimates of initial values for [QH2] were based on the postulates of the model (see text). The concentration of oxidized cytochrome b-561 was estimated on the assumption that all cytochrome b-561 available for reduction was initially oxidized at these values of Eh. The straight lines show good agreement with second order kinetics. (See text for further assumptions.)
TABLE I.
CALCULATED AND EXPERIMENTAL VALUES OF UBIQUINOL CONCENTRATION AND THE SECOND-ORDER RATE CONSTANTS, FROM THE DATA OF FIG. 8
|
Eh (mV) |
QH2a (mol/mol b-561) |
k2d (M−1·s−1) (× 10−5) |
QH2b (mol/mol b-561) |
differ- ence c |
|---|---|---|---|---|
| 200 | 0.01 | 2.2 | 0.92 | 0.91 |
| 180 | 0.05 | 2.4 | 0.95 | 0.90 |
| 170 | 0.11 | 2.4 | 1.01 | 0.90 |
| 160 | 0.25 | 2.2 | 1.15 | 0.90 |
| 150 | 0.55 | 2.3 | 1.61 | 1.06 |
| 140 | 1.19 | 2.4 | 2.12 | 0.93 |
| 180 e | 0.05 | 2.9 | 1.67 | 1.62 |
Ubiquinol concentration before the flash calculated assuming [Q + QH2] = 60 mol/mol complex, Em,7 = 90 mV.
Ubiquinol concentration immediately after the flash, calculated from the intercepts on Fig. 8.
Difference between a and b showing the ubiquinol (mol/mol cytochrome b-561) delivered to the pool by the reaction center.
Values for the second-order rate constants calculated on the following assumptions: vesicle diameter, 70 nm; membrane thickness, 10 nm; 25 reaction centers per vesicle; and 40% of the membrane volume was lipid.
Values after two flashes 1 ms apart.
TABLE II.
PHYSICOCHEMICAL PARAMETERS DESCRIBING SOME REACTIONS OF THE MODIFIED Q-CYCLE
| Reaction a | t1/2b | K’ (pH 7) c | kfd | kb |
|---|---|---|---|---|
| 1 | 5 μs | 78 | 1.7·108 M−1·s−1 | 2.1·106 M−1·s−1 |
| 2 | 150 μs | 23 | 8.3·106 M−1·s−1 | 3.5·105 M−1·s−1 |
| 3 | < 200 μs | 0.3 | > 3.5·103 s−1 | > 1.1·104 s−1 |
| 4 | 300 μs–7 ms e | 2.2 | 2 ·105 M−1·s−1 | 9.1·104 M−1·s−1 |
| 5 | < 300 μs | 370 | > 2.3·103 s−1 | > 6.2 s−1 |
| 6 f | 1.5–7 ms e | 4·103 | — — | — — |
Numbers refer to reactions shown in Scheme II.
Half-times for forward reaction, measured under conditions in which the reverse reaction was minimised [19,29,52,59].
Equilibrium constants are for reactants other than H+, at pH 7, 25°C, assuming Em,7 values (in mV) for components as follows: P-870, 450; cytochrome c2, 340; cytochrome c1, 260; FeS center, 290; Q pool, 90; cytochrome b-561, 60; b-566, −90 [1–3,38,59,60].
Order of reaction assumed is shown by units. Concentration of components was based on relative stoichiometrics as follows: P-870, 1; cytochrome c2, 0.6; cytochrome c1, cytochrome b-561, cytochrome b-566 and FeS center 0.5; Q pool, 30 [19,29,38,59–61]; and on the following parameters for a chromatophore: external diameter, 70 nm; membrane thickness, 10 nm; lipid content of membrane, 40%; 30 molecules of P-870 per chromatophore [62]; reactions of Q/QH2 and cytochrome c2 reflect concentration in the lipid and aqueous phases, respectively. Forward rate constants (kf) were calculated from half-times, reverse rate constants (kb) from kf/K’.
Depending on (QH2) or (Q).
Assuming reaction shown in the legend to Scheme II.
All values pertain to the operation of the system at isoprotonic potential. Values have been rounded to two significant figures.
The curves are plotted with a displacement of zero time from the time of flash illumination by an amount corresponding to the lag time. From the linearity it seems reasonable to conclude that by the end of the lag period QH2 was distributed randomly with respect to the oxidoreductase complex. Other assumptions are summarized and justified in the table and figure legends. Fig. 4 shows a set of second-order processes with rate constants between 2 and 3 • 105 M−1 • s−1 over the range of QH2 concentration of 1–3 QH2/complex. At a concentration of between 5 and 15 QH2/complex, calculations using the above rate constant show that the rate of the reaction would approach the maximal rate observed (t1/2 from 0.3 to 1 ms, depending on preparation and conditions), if the reactants were available at the initial concentrations at zero time. Above this concentration the rate must be determined by other processes of the complex (see below). Over a range of QH2 concentrations up to the limiting value, the rate would no longer be determined solely by the second-order process. In Table I, the concentrations of QH2 calculated from the intercepts of Fig. 4 and the QH2 concentration at different potentials are shown. The latter values were calculated assuming the appropriate Em value to be that of the quinone pool. The differences between the values are in agreement with the suggestion that 1 QH2/complex was introduced to the chain on reduction of . The fits to the predicted results are good over the range up to approx. 3 QH2/complex. Also included are values for an experiment such as that of Fig. 2 in which cytochrome b-561 reduction was measured following two closely spaced flashes. The fits with this simple hypothesis are not as good, and suggest that less than one extra QH2 was introduced on the seond flash.
Slow phase of the carotenoid change
The dependence on ambient redox potential of the slow phase of the carotenoid change has been discussed in detail elsewhere [1,2,5,25-27,41]. Previous studies have concentrated on the appearance of a phase (Phase III) with t1/2 ≈ 1–2 ms in the rise kinetics following a flash, on reductive titration over the range centered around 150 mV at pH 7.
The appearance of Phase III was attributed to reduction of a component, QZ, providing reducing equivalents to a reaction associated with the electrogenic event indicated by the slow phase of the carotenoid change. In the most extensive study [5] this phase was assayed by the extent of the antimycin-sensitive change which had occurred 5 ms after a saturating flash. However, earlier studies had indicated that a slower electrogenic event occurred over a higher redox range [27,40,41], and De Grooth et al. [45] had also noted that a slower phase of the carotenoid change, with t1/2 ≈ 10 ms, could be observed at redox potentials considerably higher than those at which the component QZ (Em,7 ≈ 150 mV) would have been completely oxidized before the flash. The extent of this phase showed a binary pattern as a function of flash number on illumination of dark-adapted chromatophores at high Eh, which was out of phase with the binary patterns of appearance and disappearance of a change attributed to the semiquinone anion of the two-electron gate. More recently, O’Keefe and Dutton [30] have also noted the presence of the 10 ms phase of the carotenoid change at Eh values in the range 200–400 mV, and the binary pattern in extent as a function of flash number.
The occurence of the 10 ms phase of the carotenoid change at Eh > 180 mV is not readily explained in terms of a requirement for prereduction of a component (QZ) of Em 150 mV, present in a fixed stoichiometry of 1 QZ/complex, and firmly bound at its reaction site. We have therefore reinvestigated the dependence on ambient potential of the slow phase of the carotenoid change, paying particular attention to the dependence on Eh of the kinetics and total extent when these were measured over a wider time scale. Typical traces of the changes induced in dark-adapted chromatophores by one flash measured at several values of Eh are shown in Fig. 5. The final extent of the antimycin-sensitive change following one flash, and the rate measured from the steepest slope of the kinetic trace reached after an initial delay, are plotted as a function of Eh in Fig. 6. After titrating in with the disappearance of the binary pattern at Em ≈ 350 mV (not shown), the amplitude of the change on the first flash showed a constant level over the Eh range 180–250 mV which was close to half the maximal extent reached over the range 80–120 mV. The increase in rate titrated in over a range similar to that seen for titration of the rate of cytochrome b-561 reduction in the presence of antimycin, and reached a similar maximal value when the rates were appropriately normalized (see figure legends). Over the Eh range 180–250 mV, the half-time and rate of the slow phase were similar to those for cytochrome b-561 reduction.
Fig. 5.
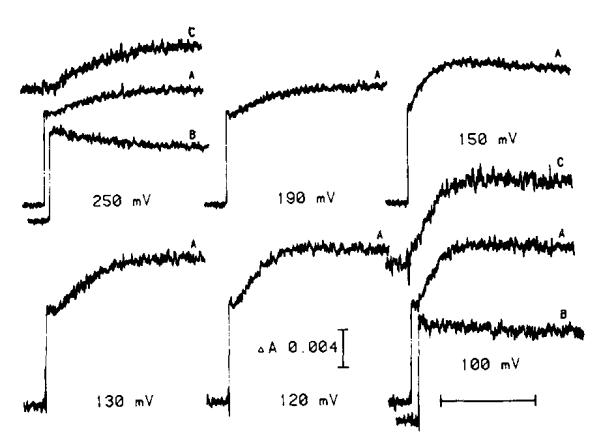
Kinetic traces of the carotenoid electrochromic change. Chromatophores were suspended in the same buffer and with the same mediators as in Fig. 1 with the exception that TMPD was omitted and 10 μM p-benzoquinone was added. The carotenoid band shift was measured at 503 nm. All traces labelled A were obtained in the absence of inhibitors. Traces labelled B were obtained in the presence of 2 μM antimycin A. Traces labelled C at 250 and 100 mV are the difference between the traces labelled A and B. The horizontal scale bar represents 25 ms (traces at 250, 190 and 150 mV) or 5 ms (130, 120 and 100 mV). The instrument response time was 100 μs for the former and 20 μs for the latter sets. Traces at 130, 120 and 100 mV are an average of two. A dark period of 60s was allowed between flashes.
Fig. 6.
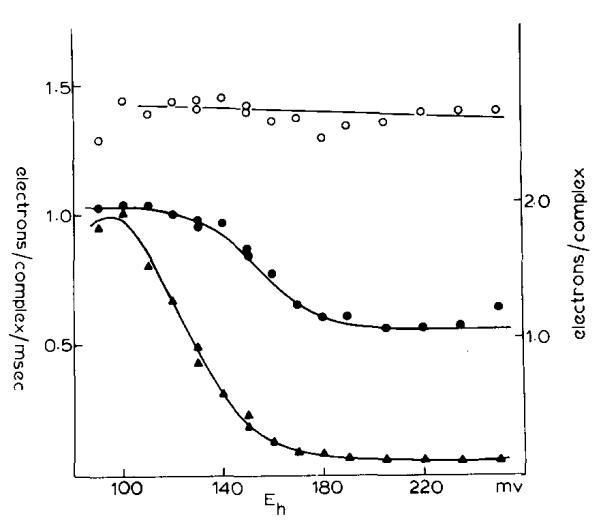
Titration of the extent and initial rate of carotenoid electrochromic change. Conditions were the same as described in Fig. 5. The open circles represent the extent of the fast phase (Phases I + II), the closed circles represent the maximal extent of the slow phase (Phase III), and the closed triangles represent the initial rate of the slow phase. The initial rate and maximal extent of the slow phase were measured from the difference between traces without and with antimycin (see traces C in Fig. 5). The scales were derived from the following assumptions. The amplitude of the electrochromic change was considered to the proportional to the change in voltage difference generated across the membrane (see Refs. 1–3 for reviews). At fixed capacitance this would be proportional to the quantity of charge displaced. The rate of change of absorbance with time therefore measures the current through the electrogenic process, expressed here in units of electrons/ms. It was further assumed (see text) that the full extent of the slow phase (ΔA = 9.6·10−3) represented a flux of two electrons per oxidoreductase complex through the electrogenic process.
Antimycin-sensitive rereduction of cytochrome (c1 + c2)
As with measurement of the carotenoid change, previous detailed studies of the antimycin-sensitive rereduction of cytochrome c have focused attention on the rapid phase (t1/2 ≈ 1–2 ms) which titrates in on reduction of the suspension over a range centered at Eh,7 ≈ 150 mV [1,2,5,20,25]. We have previously pointed out that the maximal rate of rereduction accelerated approx. 4-fold over that observed at values of Eh giving complete rereduction of cytochrome c when this was measured approx. 8 ms after a flash [25,32]. We have now extended our observations to a more detailed study of the rereduction kinetics at higher values of Eh, and at low concentrations of redox mediators. Fig. 7 shows traces of cytochrome c kinetics in the presence and absence of antimycin at Eh values of 100–250 mV, and the antimycin-sensitive change given by subtraction. An antimycin-sensitive phase of rereduction is observed at Eh 245 mV, showing t1/2 ≈ 10 ms, and a maximal amplitude of about half that seen at 100 mV. In general, over a wider range of values of Eh below 250 mV, the kinetics and amplitude of the antimycin-sensitive rereduction of cytochrome (c1 + c2) follow a pattern as a function of Eh similar to that observed for the antimycin-sensitive phase of the carotenoid change (Fig. 8). As with the slow phase of the carotenoid change, over the Eh range 180–250 mV, the antimycin-sensitive rereduction showed a t1/2 similar to that for the reduction of cytochrome b-561 observed in the presence of antimycin (cf. traces in Figs. 2, 5 and 7). We have previously demonstrated that in the presence of antimycin, about half of the total cytochrome c becomes rapidly reduced after a flash, in a reaction which is sensitive to UHDBT, and involves electron transfer from the Rieske-type FeS center [29,48,49]. We also noted that in the absence of UHDBT, the extent of rereduction of cytochrome (c1 + c2) following a flash approached a constant value as the FeS center was chemically reduced before the flash, but then increased as the Eh was further lowered through the range of 180–80 mV [19]. The extent of the extra rereduction (see Fig. 7) was always less (about 30%) than the extent of reduction of cytochrome b-561, and we had pointed out that this failure of stoichiometric matching appeared to be contrary to the predictions of current Q-cycle mechanisms [19]. With the recognition of the multiplicity of c-type cytochromes [19,31,50,51], our measurement of a relatively low value for Em,7 of cytochrome c1 (265 ± 10 mV in chromatophores) compared to that for the Rieske FeS center (Em,7 ≈ 285 mV) [19,52], and the indications that the ubiquinol oxidase complex is present in a stoichiometry of approx. 0.5 per reaction center [19], it has become possible to understand both the presence of the antimycin-insensitive extra rereduction of cytochrome (c1 + c2), and its low stoichiometry, in terms of a Q-cycle mechanism (Refs. 23 and 24; and below).
Fig. 7.

Kinetics of cytochrome c1 and c2 in the absence and presence of antimycin A. Traces (average of four; instrument response times were 20, 40 and 100 μs for traces at 105, 150 and 245 mV, respectively) were measured at 551–542 nm, which measures almost equal contributions from cytochrome c1 and cytochrome c2. Conditions were the same as in Fig. 5 except that gramicidin at 10 μg/ml was added, and a flow system was used to provide a fresh dark sample for each experiment [38]. The concentration of antimycin was 2μM where indicated. Traces were measured at the Eh shown ± 3 mV.
Fig. 8.

Redox titration of the initial rate and extent of the antimycin-sensitive cytochrome c rereduction. Conditions were the same as in Fig. 5. The initial rate and extent were measured from the difference traces, without minus with antimycin, obtained as in Fig. 7. The closed triangles correspond to the initial rate of the antimycin-sensitive rereduction, closed circles represent the maximal extent of rereduction, the open squares represents the extent 25 ms after the flash, and the closed squares the extent 4 ms after the flash.
Discussion
The mechanism of reduction of cytochrome b-561
The data of Figs. 1-4 and Table I point to the following conclusions:
The rate of reduction of cytochrome b-561 following a flash increases up to 10-fold over the Eh range 250–100 mV, but the maximal extent of reduction increased only slightly [4,29]. A reductant must be available in a stoichiometry approximately equal to that of cytochrome b-561 at all values of Eh below about 300 mV.
The kinetics of cytochrome b-561 reduction indicate a second-order process, which is first order in a reductant whose concentration changes on titration. The concentration of the reductant following a single flash is constant over the Eh range 180–300 mV, and increases below 180 mV in a manner consistent with the reduction of a two-electron component of Em ≈ 90–100 mV, present in a stoichiometry of approx. 60 equiv./complex. The component thus has the characteristics of the quinone pool.
-
These kinetic effects cannot be accounted for in terms of a reductant, QZ [1-5], of Em ≈ 150 mV, present at a fixed stoichiometry of 1/cytochrome b-561. It could be postulated that a reaction site for ubiquinol is present which favors the binding of QH2 compared with Q, and thus displaces the Em values to a higher value than that of the pool. If such a site exists, it must be in equilibrium with the quinone pool on a millisecond time scale, in order to explain the binary pattern of reduction at high Eh, and to account for the acceleration of the rate of reduction on lowering the Eh.
We have previously shown that in chromatophores extracted so as to lose all but approx. 2 ubiquinones/reaction center, the reactions attributed to QZ are lost (as previously shown by Dutton and colleagues [7,35,46]), but cytochrome b-561 reduction is readily observed at a rate similar to that seen at Eh ≈ 200 mV in native chromatophores [8,46]. In these extracted chromatophores the binary pattern of cytochrome b-561 reduction at Eh > 300 mV was still observed, but no acceleration of the rate of reduction was seen on lowering the Eh through the range 200–100 mV. In terms of a Q-cycle mechanism, the simplest explanation was that the ‘QZ site’ was accessible to QH2 diffusing from the reaction center, and that the ‘acceleration’ effect specifically required the presence of a pool of ubiquinone [8].
Our results do not exclude the possibility of a site at which QH2 from the pool can be preferentially bound. However, our calculations show that it is not necessary to postulate such a binding, since the results can be adequately explained by reaction of the complex with QH2 from the pool by a second-order process, as postulated above.
A modified Q-cycle model
In order to interpret our remaining results it is necessary to consider what modifications of the classical Q-cycle are required to take account of the pathway for cytochrome b-561 reduction demonstrated above, and the role of cytochrome b-566 considered in detail in the companion paper [38]. We have adopted a Q-cycle model similar to that briefly outlined previously [23,24], based on the following postulates.
(a) The reactive ubiquinol is assumed to have the redox characteristics of the quinone pool.
(b) Ubiquinol reacts with the ubiquinol:cytochrome c2 oxidoreductase in a second-order process described by the following equation:
| (1) |
The equilibrium constant for components other than H+ is given by:
| (2) |
| (3) |
Substituting the appropriate values, has a value of about 2 at pH 7 (Table I). Since we have used values of ΔG’°, the true Keq can be obtained from , and has a value of approx. 2 · 10−7 M over a limited pH range below the pK of FeSH+ and cytochrome b-566H.
(c) In half of the reaction centers, the secondary quinone QB is reduced to the semiquinone with an apparent Em,7 value for the couple of approx. 350 mV, as indicated by the disappearance of the binary patterns [36], and by the sensitivity of half the reaction centers to inhibition by ametryne in the Eh range 100–300 mV [29]. The mechanism of this effect is not yet understood.
(d) In the uncoupled chain following a flash in the presence of antimycin, the components of the high-potential pool (P, cytochrome c2, cytochrome c1 and FeS) come to redox equilibrium with each other, and cytochrome b-561 and cytochrome b-566 come to redox equilibrium with each other, but the high potential components do no: equilibrate with the b-type cytochromes, in the millisecond time range.
(e) The reaction of Eqn. 1 comes to a quasi equilibrium. Given postulate d above, the quasi equilibrium condition is given by:
and
Effectively, the latter inequality can only apply if the disproportionation reaction for the quinone species does not occur over the time scale of turnover of the chain, an assumption implicit in all formulations of a Q-cycle type mechanism. This failure of equilibration would require either that the lifetime of the semiquinone species was very short, or that the equilibrium concentration was very low, or that no interaction between neighbouring complexes could occur and the concentration of semiquinone in the pool was very low, or a combination of these.
(f) The only pathway of kinetic consequence for reduction of cytochrome b-561 in the presence of antimycin is that of the Q-cycle as summarized in Scheme I and the postulates above.
(g) The assumptions above pertain to the complex inhibited by antimycin, which prevents oxidation of cytochrome b-561 and cytochrome b-566.
Given these assumptions, the following series of events accounts for the reduction of cytochrome b-561.
On flash illumination P is oxidized and QA reduced in all reaction centers open before the flash. In reaction centers starting with , QBH2 is formed on oxidation of . The quinol is in rapid equilibrium with the pool. Over the Eh range 100–300 mV, QBH2 is formed in about half the centers, or with a stoichiometry of approx. 1 QH2/complex. In centers with QB, is formed on oxidation of . At values of Eh > 400 mV all centers in which P was reduced form on the first flash, and in all centers in which P was rereduced, QH2 is formed on the second flash.
At values of Eh > 180 mV, the QH2 formed on flash illumination is the only source of reductant for cytochrome b-561. The quinol reaches its site of oxidation after a delay due to: (a) the ‘leaving time’ for dissociation of QH2 from the QB site; (b) the diffusion time between the QB and QZ sites; and (c) translocation of the quinol head group across the membrane. The 1 ms lag observed before onset of cytochrome b-561 reduction at Eh > 180 mV is largely determined by these delays. An approximate apparent diffusion coefficient for QH2 can be calculated from the delay, or from the t1/2 for reduction, and from the diffusion distances involved. Assuming a chromatophore of radius 30 nm, containing 30 reaction centers, and 15 oxidoreductase complexes, uniformally distributed, the mean distance of lateral diffusion is 10–20 nm, giving a lateral diffusion coefficient of approx 10−9 cm2 · s−1 (from the delay) or approx. 2 · 10−10 cm2 · s−1 (from t1/2). These values are considerably smaller than previous estimates of the lateral diffusion coefficient for lipids (approx. 10−8 cm2 · s−1), and may indicate either that the other processes above contribute the major delay, or that diffusion of ubiquinol is hindered (possibly by the long side chain). The half-time for electron transfer from to is about 30 μs [36], the half-time of uptake is 150–200 μs [1], and that for recovery of the photochemical reactions over a wide range of Eh values is approx. 250 μs (Cogdell, R.J., Jones, K.R. and Crofts, A.R., unpublished results), which give possible minimal values for the half-time of QBH2 dissociations; however, no direct measurement of the leaving time is available, and either this, or diffusion, or translocation of the quinol head group could be the rate-determining step.
The P+ formed on flash illumination is reduced through the series of reactions shown in Scheme II, with the rate constants shown in Table II, which are derived in part from previously reported kinetic measurements [19,29,52,59]. Because of the relative redox potentials of cytochrome c1 and the FeS center, the cytochrome has to be partly oxidized before reduced FeS center can readily donate electrons. This gives rise to a delay of 50–150 μs in the oxidation of the FeS center.
When QH2 and FeS+ are both present, and since cytochrome b-566 is always oxidized before the flash, the second-order reaction of Eqn. 1 occurs with the rate constant shown in Table I. At values of Eh < 170 mV a significant fraction of the quinone pool is reduced before the flash. This increases the rate of the reaction through the second-order effect, and also reduces the lag. At Eh < 100 mV, the rate of the reaction is not longer determined by the concentration of QH2. Factors controlling the reduction of cytochrome b-566 are discussed at length in the companion paper [38].
The rate of reduction of cytochrome b-561 by cytochrome b-566H does not seem to be rate determining, since at values of Eh where cytochrome b-561 is oxidized before the flash, but the quinone pool is partially reduced (Eh range 60–120 mV), the reduction of cytochrome b-561 shows kinetics similar to those of the electron flow through the FeS center to ferricytochrome c1, and the lag observed appears to be determined at least in part by the lag in oxidation of the FeS center [29]. Because of the low value of (see b above), no large reduction of cytochrome b-566 is observed after the flash, unless cytochrome b-561 has been previously reduced [38].
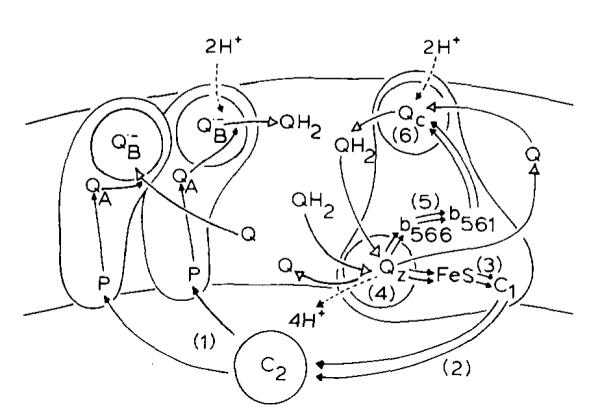
SCHEME II. A MODIFIED Q-CYCLE MECHANISM FOR THE CYCLIC ELECTRON TRANSFER CHAIN OF RPS. SPHAEROIDES.
| (1) |
| (2) |
| (3) |
| (4) |
| (5) |
| (6) |
In order to test the postulates of our model, and to facilitate analysis of the data, we have developed a computer program which calculates the concentrations of components of the chain to be expected shortly after one or two single turnover flashes, using the assumptions a–g above. In general, over the redox range Eh,7 from −10 to 250 mV (or equivalent ranges at pH 8 and 9), the calculated equilibrium concentrations match well with the extents of oxidation or reduction of cytochromes c1 + c2, b-566 and b-561 measured experimentally approx. 50 ms after one or two flashes spaced 67 ms apart. We discuss the use of this program more extensively in the companion paper on the role of cytochrome b-566 [38], and will present a more detailed analysis in a later paper. The good fit of the computed with the experimental results shows that the extents of redox changes observed can be adequately explained by our assumptions.
Turnover of the chain in the absence of antimycin
In order to interpret the changes seen in the absence of antimycin, and to account for the proton-pumping activity of the cycle, some additional postulates are required. We note first that, because of the relative stoichiometry of the oxidoreductase complex and the reaction center, following a saturating flash, each complex has to transfer two electrons to restore the starting state. We have proposed above that the oxidoreductase complex reacts in a second-order process with ubiquinol from the pool, through a Q-cycle mechanism. As was first pointed out by Garland et al. [53], and more recently noted by Malviya et al. [54], Van Ark et al. [55], Slater [56] and Velthuys [57], a consequence of this postulate is that the complex, in order to complete a turnover, must oxidize two equivalents of QH2 and reduce one equivalent of Q. In line with this suggestion we make the following postulates (continuing the lettering from the previous list).
(h) The reaction of Eqn. 1 occurs at a site (the QZ site, equivalent to the o-site of Mitchell [22]) in equilibrium with protons on the inside of the chromatophore (the cytochrome c2 side of the membrane, or the P side [58]).
(i) The complex contains a separate site which acts as a ferrocytochrome b-561:ubiquinone oxidoreductase. This site (the QC site (Scheme II), equivalent to the i-site of Mitchell [22]) is in equilibrium with protons on the outside of the chromatophore (the cytoplasmic side of the bacterial membrane, or N-side [58]). The site operates at maximal rate through a two-electron reduction of quinone, when two electrons are made available in the low-potential chain containing the two b-type cytochromes of the complex.
(j) Antimycin displaces quinone or quinol from the QC site, and prevents turnover of the reaction catalyzed by the site.
The mechanism defined by the postulates above is summarized in Scheme II, which shows the large membrane-spanning proteins (the photochemical reaction center and the ubiquinol:cytochrome c2 oxidoreductase complex) as reacting independently with cytochrome c2 from the aqueous phase, and with Q or QH2 from the quinone pool. The reactions of the enzymes with the mobile components are considered to be second-order processes, catalyzed by five reaction sites. Two of these, the ferrocytochrome c2 oxidase site of the reaction center, and the ferricytochrome c2 reductase site of the QH2:cytochrome c2 oxidoreductase, fall outside the scope of this paper, but in general probably act by mechanisms similar to those of the analogous mitochondrial sites. The remaining reaction sites are those labelled QB (the two-electron gate of the photochemical reaction center, also in protonic equilibrium with the N-phase), QZ (the ubiquinol-oxidizing site, catalyzing the reaction of Eqn. 1) and QC, the site at which ubiquinone is reduced by cytochrome b-561.
In the light of this scheme, we can account well for the kinetic observations on the uninhibited chain. As discussed above, in the presence of antimycin, the reaction at the QZ site comes to equilibrium. Because of the equilibrium constant of the reaction, when the medium is poised at Eh ≈ 120 mV, the site is able to oxidize about one equivalent of QH2, reducing cytochrome b-561, and leaving one oxidizing equivalent in the high-potential chain (Fig. 7), which resides mainly on cytochrome c1, the component with the lowest Em (see Table II). It is convenient to consider this process as the first turnover of the reaction of the complex in the absence of antimycin, a state reached about 500 μs after a flash given to chromatophores at Eh ≈ 120 mV. When the QC site is able to operate, the back-pressure on the QZ site due to reduction of cytochrome b-561 (and partial reduction of cytochrome b-566) is relieved as cytochrome b-561 passes an electron to the QC site. This permits the QZ site to turn over again, allowing a second electron through the high-potential chain, observed as the antimycin-sensitive reduction of cytochrome c, and a second electron to reach the QC site and complete the reduction of quinone.
The second turnover of the QZ site is necessarily tied kinetically to the turnover of the QC site, providing an explanation for previous observations [1,2,18,28,29] that the three antimycin-sensitive reactions (cytochrome c reduction, cytochrome b oxidation and Phase III of the carotenoid change) appeared to be kinetically linked. However, it should be noted that, in the context of the present model, the close similarity previously reported between the rates (or half-times) of Phase III of the carotenoid change, the antimycin-sensitive rereduction of cytochrome c, and the apparent rate of oxidation of cytochrome b-561 as assayed by the antimycin difference kinetics, must be considered fortuitous. In the presence of antimycin, reduction of cytochrome b-561 corresponds to a flux of one electron/complex through the ubiquinol oxidase site. In the absence of inhibitor, Phase III (and turnover of the b-type cytochromes) represents a flux of two electrons/complex through this site (see Figs. 2,3,5 and 6). When the maximal rates of these processes under similar flash regimes are normalized (as in Figs. 3 and 6), they are remarkably similar, even though the half-time of Phase III is about twice that of cytochrome b-561 reduction. It seems probable that the rate of oxidation of cytochrome b-561 is not limiting under these conditions (dark-adapted chromatophores with low initial proton gradient), and that it does match Phase III. However, the kinetics of cytochrome b-561 oxidation cannot be assayed by simple subtraction of the traces in the presence and absence of antimycin. Similarly, the antimycin-sensitive rereduction of cytochrome (c1 + c2) reflects only a fraction of the turnover of the ubiquinol oxidase site of the complex, and the kinetics would not be expected to match those of the normalized Phase III.
At Eh values above 180 mV, where only one QH2 is available per complex (from the photochemical reactions), the antimycin-sensitive rereduction of cytochrome c and the slow phase of the carotenoid change observed in the 40 ms range have an amplitude of only a half that observed at Eh 100 mV, where the complex can turn over completely. The increases in extent and rate of the these two processes titrate in as the concentration of QH2 available increases on reduction of the pool, and can be adequately explained in terms of the second-order reaction of the ubiquinol oxidase site discussed at length above.
Conclusions
The Q-cycle summarized in Scheme II provides a satisfactory explanation for the kinetic and thermodynamic behavior of the chain in the presence of antimycin, for the kinetics of the components of the uninhibited chain under uncoupled conditions, and for the sensitivity to inhibitors (antimycin and UHDBT) of the reactions observed under coupled or uncoupled conditions. The mechanism can be formally described by the set of physical constants contained in Table II, and a set of chemical equations representing the reactions shown in the scheme. The model provides for the first time a comprehensive physicochemical description of the operation of an electron-transport chain. The model is necessarily somewhat preliminary, and we recognize that for some of the reactions, and in particular that at the QC site, our description is far from complete; we also recognize that some of the physicochemical parameters will need revision in the light of refining experiments. However, the model accounts with a pleasing economy for patterns of kinetic and thermodynamic behavior which had seemed anomalous, and which we had previously considered to be incompatible with either simple linear schemes or classical Q-cycles.
Acknowledgements
We are grateful to Dr. Colin Wraight for extensive and useful discussions, and to Drs. P. Mitchell, E.C. Slater, J.R. Bowyer and M. Wikstrtöm for helpful correspondence. We thank Ms. Lee Ann Oimoen and Ms. Kally Webster for expert technical assistance, and Mr. Alex Lam for electronics assistance. This research was supported by a grant from the National Institue of Health PHS 5 RO1 GM26305. M.S. was supported in part by a grant from the Schweizerischer Nationalfonds, No. 83.897.0.81.
Abbreviations
- Mops
4-morpholineethanesulphonic acid
- TMPD
N,N,N’,N’-tetramethyl-p-phenylenediamine
- DAD
2,3,5,6-tetramethyl-p-phenylenediamine
- UHDBT
5-(n-undecyl)-6-hydroxy-4,7-dioxobenzothiazole
References
- 1.Prince RC, Dutton PL. Ch. 24. In: Clayton RK, Sistrom WR, editors. The Photosynthetic Bacteria. Plenum Press; New York: 1978. pp. 439–453. [Google Scholar]
- 2.Crofts AR, Wood P. Curr. Top. Bioenerg. 1978;1:175–244. [Google Scholar]
- 3.Prince RC, O’Keefe DP, Dutton PL. In: Electron Transport and Photophosphorylation. Barber J, editor. Elsevier; Amsterdam: 1982. pp. 197–248. [Google Scholar]
- 4.Evans EH, Crofts AR. Biochim. Biophys. Acta. 1974;357:89–102. doi: 10.1016/0005-2728(74)90115-7. [DOI] [PubMed] [Google Scholar]
- 5.Prince RC, Dutton PL. Biochim. Biophys. Acta. 1977;462:731–747. doi: 10.1016/0005-2728(77)90114-1. [DOI] [PubMed] [Google Scholar]
- 6.Wraight CA. Photochem. Photobiol. 1979;30:767–776. [Google Scholar]
- 7.Takamiya K, Dutton PL. Biochim. Biophys. Acta. 1979;546:1–16. doi: 10.1016/0005-2728(79)90166-x. [DOI] [PubMed] [Google Scholar]
- 8.Baccarini-Melandri A, Gabellini N, Melandri BA, Jones KR, Rutherford AW, Crofts AR, Hurt E. Arch. Biochem. Biophys. 1982;216:566–580. doi: 10.1016/0003-9861(82)90246-6. [DOI] [PubMed] [Google Scholar]
- 9.Baccarini-Melandri A, Gabellini N, Melandri BA, Hurt E, Hauska G. J. Bioenerg. Biomembranes. 1980;12:95–110. doi: 10.1007/BF00744677. [DOI] [PubMed] [Google Scholar]
- 10.Kroger A, Klingenberg M. Eur. J. Biochem. 1973;34:358–368. doi: 10.1111/j.1432-1033.1973.tb02767.x. [DOI] [PubMed] [Google Scholar]
- 11.Hackenbock CR, Schneider H, Lemasters JJ, Hockli M. First European Bioenergetics Conference; Bologna: Patron Editor; 1980. pp. 23–24. [Google Scholar]
- 12.Zhu QS, Berden JA, DeVries S, Slater EC. Biochim Biophys. Acta. 1982;680:69–79. doi: 10.1016/0005-2728(82)90317-6. [DOI] [PubMed] [Google Scholar]
- 13.Lawford HG, Garland PB. Biochem. J. 1973;136:711–720. doi: 10.1042/bj1360711. [DOI] [PMC free article] [PubMed] [Google Scholar]
- 14.Papa S, Larusso M, Guerrieri F. Biochim. Biophys. Acta. 1975;387:425–440. doi: 10.1016/0005-2728(75)90083-3. [DOI] [PubMed] [Google Scholar]
- 15.Ziegler DM, Doeg KA. Biochem. Biophys. Res. Commun. 1959;1:344–349. [Google Scholar]
- 16.Baginsky ML, Hatefi Y. J. Biol. Chem. 1969;244:5313–5319. [PubMed] [Google Scholar]
- 17.Bowyer JR, Baccarini-Melandri A, Melandri BA, Crofts AR. Z. Naturforsch. 1978;33:704–711. [Google Scholar]
- 18.Crofts AR, Crowther D, Tierney GV. In: Electron Transfer Chains and Oxidative Phosphorylation. Quagliariello E, Papa S, Palmieri F, Slater EC, Siliprandi N, editors. North-Holland; Amsterdam: 1975. pp. 233–241. [Google Scholar]
- 19.Crofts AR, Meinhard SW, Bowyer JR. In: The Function of Quinones in Energy Concerving Systems. Trumpower BL, editor. Academic Press; New York: 1982. pp. 477–498. [Google Scholar]
- 20.Dutton PL, Bashford CL, Van den Berg WH, Bonner HJ, Chance B, Jackson JB, Petty KM, Prince RC, Sorge JR, Takamiya K. In: Hall DD, Coombs J, Goodwin TW, editors. Proceedings of the 4th International Congress on Photosynthesis; London: The Biochemical Society; 1977. pp. 159–171. [Google Scholar]
- 21.Mitchell P. FEBS Lett. 1975;59:137–139. doi: 10.1016/0014-5793(75)80359-0. [DOI] [PubMed] [Google Scholar]
- 22.Mitchell P. J. Theor. Biol. 1976;62:327–367. doi: 10.1016/0022-5193(76)90124-7. [DOI] [PubMed] [Google Scholar]
- 23.Crofts AR, Meinhardt SW. Biochem. Soc. Trans. 1982;10:201–203. doi: 10.1042/bst0100201. [DOI] [PubMed] [Google Scholar]
- 24.Crofts AR, Meinhardt SW, Snozzi M, Jones KR. Short Reports of the 2nd European Bioenergetics Conference; Lyon: Université Claude Bernard; 1982. pp. 327–328. [Google Scholar]
- 25.Crofts AR, Crowther D, Bowyer JR, Tierney GV. In: Structure and Function of Energy-Transducing Membranes. Van Dam K, Van Gelder BF, editors. Elsevier/North-Holland; Amsterdam: 1977. pp. 139–155. [Google Scholar]
- 26.Jackson JB, Crofts AR. Eur. J. Biochem. 1971;18:120–130. doi: 10.1111/j.1432-1033.1971.tb01222.x. [DOI] [PubMed] [Google Scholar]
- 27.Evans EH, Cogdell RJ, Crofts AR. Biochem. Soc. Trans. 1974;2:538–540. [Google Scholar]
- 28.Prince RC, Dutton PL. Biochim. Biophys. Acta. 1975;387:609–613. doi: 10.1016/0005-2728(75)90101-2. [DOI] [PubMed] [Google Scholar]
- 29.Bowyer JR, Crofts AR. Biochim. Biophys. Acta. 1981;636:218–233. doi: 10.1016/0005-2728(81)90096-7. [DOI] [PubMed] [Google Scholar]
- 30.O’Keefe DP, Dutton PL. Biochim. Biophys. Acta. 1981;635:149–166. doi: 10.1016/0005-2728(81)90015-3. [DOI] [PubMed] [Google Scholar]
- 31.Bowyer JR, Meinhardt SW, Tierney GV, Crofts AR. Biochim. Biophys. Acta. 1981;635:167–186. doi: 10.1016/0005-2728(81)90016-5. [DOI] [PubMed] [Google Scholar]
- 32.Crofts AR, Bowyer JR. In: The Proton and Calcium Pumps. Azzone GF, Avron M, Metcalfe JC, Quagliariello E, Siliprandi N, editors. Elsevier; Amsterdam: 1978. pp. 55–64. [Google Scholar]
- 33.Rich PR, Bendall DS. Short Reports of First European Bioenergetics Conference; Bologna: Patron Editore; 1980. pp. 59–60. [Google Scholar]
- 34.Rich PR. FEBS Lett. 1981;130:173–178. doi: 10.1016/0014-5793(81)81113-1. [DOI] [PubMed] [Google Scholar]
- 35.Takamiya K, Prince RC, Dutton PL. In: Frontiers of Biological Energetics. Dutton PL, Leigh J, Scarpa A, editors. Vol. I. Academic Press; New York: 1978. pp. 183–190. [Google Scholar]
- 36.Bowyer JR, Tierney GV, Crofts AR. FEBS Lett. 1979;101:201–206. doi: 10.1016/0014-5793(79)81326-5. [DOI] [PubMed] [Google Scholar]
- 37.Wikstrom MKF, Berden JT. Biochim. Biophys. Acta. 1972;283:403–420. doi: 10.1016/0005-2728(72)90258-7. [DOI] [PubMed] [Google Scholar]
- 38.Meinhardt SW, Crofts AR. Biochim. Biophys. Acta. 1983;723:219–230. doi: 10.1016/0005-2728(83)90120-2. [DOI] [PMC free article] [PubMed] [Google Scholar]
- 39.Forster V, Hong Y, Junge W. Biochim. Biophys. Acta. 1981;638:141–152. [Google Scholar]
- 40.Dutton PL, Jackson JB. In: Forti G, Avron M, Melandri A, editors. Proceedings of the 2nd International Congress on Photosynthesis; The Hague: Dr. W. Junk; 1971. pp. 995–1007. [Google Scholar]
- 41.Dutton PL, Jackson JB. Eur. J. Biochem. 1972;30:495–510. doi: 10.1111/j.1432-1033.1972.tb02121.x. [DOI] [PubMed] [Google Scholar]
- 42.Evans EH. Ph.D. Thesis. Bristol University; Bristol: 1973. [Google Scholar]
- 43.Wraight CA. Biochim. Biophys. Acta. 1977;459:525–531. doi: 10.1016/0005-2728(77)90051-2. [DOI] [PubMed] [Google Scholar]
- 44.Vermeglio A. Biochim. Biophys. Acta. 1977;459:516–524. doi: 10.1016/0005-2728(77)90050-0. [DOI] [PubMed] [Google Scholar]
- 45.De Grooth BG, Van Grondelle R, Romijn JC, Pulles MPJ. Biochim. Biophys. Acta. 1978;503:480–490. doi: 10.1016/0005-2728(78)90147-0. [DOI] [PubMed] [Google Scholar]
- 46.Takamiya K, Prince RC, Dutton PJ. J. Biol. Chem. 1979;254:11301–11307. [PubMed] [Google Scholar]
- 47.Matsuura K, Dutton PL. In: Chemiosmotic Proton Circuits in Biological Membranes. Skulachev VP, Hinkle PC, editors. Addison-Wesley; Reading, MA: 1981. pp. 259–270. [Google Scholar]
- 48.Bowyer JR, Tierney GV, Crofts AR. FEBS Left. 1979;101:201–206. doi: 10.1016/0014-5793(79)81326-5. [DOI] [PubMed] [Google Scholar]
- 49.Bowyer JR, Dutton PL, Prince RC, Crofts AR. Biochim. Biophys. Acta. 1980;592:445–460. doi: 10.1016/0005-2728(80)90091-2. [DOI] [PubMed] [Google Scholar]
- 50.Wood P. Biochem. J. 1980;189:385–391. doi: 10.1042/bj1890385. [DOI] [PMC free article] [PubMed] [Google Scholar]
- 51.Wood P. Biochem. J. 1980;192:761–764. doi: 10.1042/bj1920761. [DOI] [PMC free article] [PubMed] [Google Scholar]
- 52.Meinhardt SW, Crofts AR. FEBS Lett. 1982;149:223–227. [Google Scholar]
- 53.Garland PB, Clegg RA, Boxer D, Douonic JA, Haddock BA. In: Electron Transfer Chains and Oxidative Phosphorylation. Quagliariello E, Papa S, Palmieri F, Slater EC, Siliprandi N, editors. Norh-Holland; Amsterdam: 1975. pp. 351–358. [Google Scholar]
- 54.Malviya AN, Nicholls P, Elliot WB. Biochim. Biophys. Acta. 1980;589:137–149. doi: 10.1016/0005-2728(80)90137-1. [DOI] [PubMed] [Google Scholar]
- 55.Van Ark G, Raap AK, Berden JA, Slater EC. Biochim. Biophys. Acta. 1981;637:54–42. doi: 10.1016/0005-2728(81)90207-3. [DOI] [PubMed] [Google Scholar]
- 56.Slater EC. In: Chemiosmotic Proton Circuits in Biological Membranes. Skulachev VP, Hinkle PC, editors. Addison-Wesley; Reading, MA: 1981. pp. 69–104. [Google Scholar]
- 57.Velthuys BR. Proc. Natl. Acad. Sci. U.S.A. 1979;76:2765–2769. doi: 10.1073/pnas.76.6.2765. [DOI] [PMC free article] [PubMed] [Google Scholar]
- 58.Mitchell P. Eur. J. Biochem. 1979;95:1–20. doi: 10.1111/j.1432-1033.1979.tb12934.x. [DOI] [PubMed] [Google Scholar]
- 59.Meinhardt SW, Crofts AR. FEBS Lett. 1982;149:217–222. [Google Scholar]
- 60.Crofts AR, Wraight CA. Biochim. Biophys. Acta. 1983;726 doi: 10.1016/j.bbabio.2005.11.006. in the press. [DOI] [PubMed] [Google Scholar]
- 61.Gabellini N, Bowyer JR, Hurt E, Melandri BA, Hauska G. Eur. J. Biochem. 1982;126:105–110. doi: 10.1111/j.1432-1033.1982.tb06753.x. [DOI] [PubMed] [Google Scholar]
- 62.Kaplan S, Arntzen CJ. In: Photosynthesis: Energy Conversion by Plants and Bacteria. Govindjee, editor. Vol. 2. Academic Press; New York: 1982. pp. 65–152. [Google Scholar]