

Abstract
BACKGROUND
The need to increase the number oncology clinical trials with sufficient enrollments is a well-known issue particularly for trials targeting therapeutic applications. It is critical to identify early predictors of eventual study accrual achievement.
METHODS
All non-pediatric, phase I, I/II, II, and III therapeutic studies supported by the National Cancer Institute-Cancer Therapy Evaluation Program between 2000–2007 (n=764) were analyzed for accrual performance. Accrual achievement is defined as those enrolling 100% or more of the stated minimum accrual goal at the time of trial closure. Two accrual milestones were analyzed per trial: time-to-first patient enrollment and expected-time-to-accrual. Multivariate-logistic regression analysis was used to calculate the odds ratio with respect to the likelihood of clinical trial accrual achievement.
RESULTS
A total of 81.5 percent (n=623) of the trials did not achieve projected accrual goals within the anticipated accruing period. Furthermore, 37.2 percent (n=284) of trials failed to achieve the minimum projected accrual at study closure regardless of time the trial was open. Trials that accrue the first enrollment beyond two months (n=379,49.6%) are significantly less likely to achieve accrual performance than those trials that enroll patients under two months (odds ratio:0. 637,95% CI:0.464–0.875, p=0.005). Of the studies that are open beyond the anticipated enrollment period (n=603), those do not achieve at least 60.0% of the projected minimum accrual (n=391,64.8%) have a significantly less likelihood of achieving final accruals by study closure (odds ratio; 0.190,95% CI:0.055–0.652, p=0.008).
CONCLUSIONS
The time-to-first-patient enrollment as well as expected-time-to-accrual is shown to be valid measures to evaluate likelihood of achieving minimum projected accrual.
Introduction
The recent report from Institute of Medicine (IOM) of the National Academies on the state of the Clinical Trials Cooperative Group Program highlighted the importance of reducing the number of low enrolling clinical trials while improving the number of high priority trials that successfully achieve the intended accrual goals (Institute of Medicine 2010). With approximately 3–5 percent of the adult cancer patients in the United States participating in clinical trials, individual clinical trials struggle to achieve the necessary accruals (Murthy, Krumholz et al. 2004). Unfortunately, approximately 38% of CTEP-supported oncology trials fail to attain the minimum accrual goal with phase III trials having a substantially greater number of trials that fall short of achieving the accrual goal (Cheng, Dietrich et al. 2010 (forthcoming). These clinical trials not only are unable to achieve the necessary patient enrollment necessary to evaluate the proposed scientific hypotheses, but they also cause trials to remain open longer than planned resulting in unanticipated costs from additional administrative and clinical resources (Wittes and Friedman 1988; Emanuel, Schnipper et al. 2003; Carter, Sonne et al. 2005; Waldinger 2008).
The ability to utilize predictors of accrual performance to a trial may allow for better utilization of resources and increase the likelihood that subjects enrolled to trials will contribute to the advancement of medical knowledge. Therefore, we pose the following question: are there early clinical trial predictors during the enrollment period that may be used to identify and assess the likelihood of a trial achieving its accrual goals?
Studies that are sponsored by National Cancer Institute (NCI) that involve collaborative efforts between Cancer Centers, Cooperative Groups, Consortiums, and industry sponsors must be evaluated through the Cancer Therapy Evaluation Program (CTEP). NCI-CTEP reviews and activates approximately 500 new clinical protocols annually and is the largest supporter of phase III clinical trials sponsored by NCI (Ansher and Scharf 2001; Abrams, Murgo et al. 2007). In an effort to understand the accrual patterns of oncology clinical trials, accrual patters were evaluated in a retrospective study of CTEP-sponsored therapeutic trials between 2000 and 2007. Specifically we assess the likelihood that a trial will attain the accrual goal at two accrual milestones: 1) time to enroll the first patient, and 2) time at the expected enrollment time period (i.e. the length of time that a trial should have remained open given the projected accrual rate)
METHODS
Sample
All therapeutic, non-pediatric, phase I, I/II, II, and III oncology trials requiring NCI-CTEP evaluation that were activated and subsequently closed to accruals between May 1, 2000 and December 31, 2007 with complete accrual monitoring data (n=764) were eligible for this study (figure 1).
Figure 1.

Identification of NCI-CTEP Supported Trials Used for the Analysis of Accrual Performance
The CTEP Protocol and Information Office (PIO) provided clinical trial characteristics as well as accrual data via the Clinical Data Update System (CDUS) and the Clinical Trials Monitoring Service (CTMS), which monitors on a monthly basis all patient registrations to publicly sponsored cancer clinical trials. Projected accrual rates, projected minimum accrual goal, and activation dates of each trial are defined within the trial protocol and collected in the PIO database.
Studies that did not have information related to the projected accrual rates were excluded (n=24). If minimum projected accrual goals were not available, the maximum projected accrual goal was used (n=2). Studies that closed with zero accruals at the time of study closure were not included in the analysis, as they had no accrual rate (n=42). To investigate if incidence or mortality rates of the disease impact accrual performance and to account for factors of rarity of the disease, data on the median age-adjusted cancer incidence and mortality rate was collected from the Surveillance Epidemiology and End Results (SEER) cancer registry.
Variables
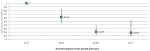
The accrual milestones of time to first patient enrollment and expected enrollment time period were used to evaluate accrual performance for this study. Figure 2 provides a description of the accrual milestones during the clinical trial enrollment period as well as a sample phase III trial. Calculation of accrual performance at these milestones were conducted on the entire sample of 764 clinical trials and analyzed collectively.
Figure 2. Definition for Observation Points and Timing Analysis.

Figure 1 illustrates an example of a phase III clinical trial contained in the sample. The date of activation was on September 2002 with the first patient enrolled on the study on January 2003. Therefore, the time-to-first enrollment was calculated from these two dates to be 4 months. The projected accrual rate for this study was 29 patients per month and the minimum projected accrual was 1058 patients. Using the time-to-first enrollment as a reference point for calculating the expected period to achieve the minimum accrual goal, the expected period was 37 months (rounded to the following month to ensure that all accruals were accounted for). Therefore the expected date that the study was to achieve the minimum accrual object was set at January 2006. On January 2006, the milestone at which the study was expected to achieve the minimum projected accrual; the number of accruals on the study was 195 patients. The actual accrual performance at the expected period to achieve the minimum projected accrual was calculated by dividing the accrual (195) by the accrual goal (1058), which resulted in accrual performance of 18.43% of the expected accrual performance. At study closure, the final accrual performance was calculated by dividing the final accrual of 357 patients by the minimum projected accrual of 1058 patients. This resulted in an accrual performance at study closure to be 33.74%. Because the final accrual performance is ≥100% of the minimum projected accrual, this study is identified to not attain the anticipated accrual goal. This calculation was conducted on the entire sample of 764 clinical trials and analyzed collectively.
The date of trial activation is the date that NCI-CTEP receives notification that the study is ready to begin accruing patients. The date of activation is recorded in months for the purpose of calculations in this research and is concatenated to the beginning of the month.
The minimum projected accrual of a study is defined within the protocol and is typically calculated from a combination of investigator consensus and statistical power requirements. The minimum projected accrual goal for each trial is defined within the study design of each trial and highly dependent upon the phase. Specifically, phase I minimum projected accrual goals assumes that the dose limiting toxicity (DLT) is observed at the first dose levels; Phase I/II trials establish minimum projected accruals based on the phase I accrual and updates the minimum accrual when the trial transitions to a phase II trial; Minimum accrual goals for phase II and III trials are based upon the number of accruals required to complete the first stage of the study design.
Final accrual performance is dichotomous with those trials achieving 100% or more of minimum projected accrual enrollment at the time of complete study closure being defined as attaining the accrual goal, and those trials not reaching this threshold as not attaining the accrual goal.† The accrual goal percentage was calculated by dividing the final accrual by the projected minimum accrual. Final accrual of a study is the number of accruals on a study at the time the study was completely closed to accrual.
Accrual Milestones
The accrual milestones are captured for each study based on the dates of patient enrollments recorded to the nearest month. It is assumed that the rate of accrual is linear. Two different accrual milestones were utilized: 1) time-to-first enrollment, and 2) accrual performance at expected enrollment time period.
First, time-to-first enrollment was recorded based on the number of months required from the month of study activation to the month of first enrollment. This point was evaluated in four groups depending upon the number of months to enroll the first patient (1–2 months, 2–6 months, 6–12 months, and >12 months). It was of interest to discover if “fast” enrolling trials (i.e., those within one or two months), could be used as an indicator of eventual achievement of the accrual goal. The other periods were selected based upon the often-utilized 6-month and 12-month review cycles that institutions use to evaluate trial accrual performance. Analysis at the time-to-first enrollment is conducted against the eventual attainment of the accrual goal at study closure.
Second, the accrual milestone was observed at the expected enrollment time period. The expected enrollment time period is calculated by dividing the minimum projected accrual by the expected rate of accrual. Both rates of accrual and minimum projected accrual are specified within the protocol and extracted from the study design. Studies were analyzed across six different groups depending upon the actual accrual performance, as a percent of expected performance, at the expected enrollment period (1–19%, 20–39%, 40–59%,60–79%,80–99%, and ≥100%). The accrual performance at the expected time to achieve the accrual goal is compared against the eventual attainment of the accrual goal.
Statistical Analysis
Descriptive statistics to summarize the accrual characteristics were conducted for the continuous variables of minimum projected accrual and expected period to achieve minimum projected accrual by calculating medians and interquartile ranges (IQR). A maximum 2-tailed alpha of 0.05 was maintained to determine statistical significance. Comparison among the trial types (i.e. phases I, I/II, II, and III) were conducted using the Kruskal-Wallis test with a post-hoc comparison of statistically significant overall tests using Mann-Whitney tests with a Bonferroni-adjusted alpha level of 0.008.
Categorical and ordinal groups were summarized using univariate and cross-tabulated frequency distributions. Unadjusted and adjusted odds ratios, along with their respective 95% confidence intervals, were obtained using multivariate logistic regression analysis. Unadjusted odds ratios were calculated with the addition of adjusting for both phase of the study and the size of the study measured by the minimum projected accrual to compensate for any interactive effects. Statistical analyses were performed in SPSS (version 16.0, descriptive and logistic regression).
RESULTS
Demographics of the Sample
A total of 764 oncology trials were identified as CTEP-evaluated, therapeutic, non-pediatric, phase I, I/II, II, III opened and completely closed to accrual between May 1, 2000 and December 30, 2007 (Table 1). Clinical trials were focused across 20 different disease sites, and the cohort of trials consisted of 62447 participants.
TABLE 1.
Summary Statistics for NCI-CTEP Sponsored Oncology Clinical Trials by Accrual Performance
| Phase I | Phase I/II | Phase II | Phase III | Total | |
|---|---|---|---|---|---|
| Accrual Performance of Trials Achieving Minimum Projected Accrual at Closure | |||||
| No. of Trials (% of Total) | 90 (64.3%) | 37 (58.7%) | 331 (65.7%) | 22 (38.6%) | 480 (62.8%) |
| Min Projected Accrual (median, IQR)c | 12 (6–20) | 18 (12–43) | 22 (18–50) | 535 (347–701) | 21 (15–49) |
| Projected Time to Achieve Minimum Projected Accrual, month (median, IQR)a,d | 4 (3–7) | 6 (3–12) | 7 (5–12) | 35 (24–45) | 7 (4–12) |
| Accrual Period (actual accrual period/planned accrual period, (%, median)b | 241.7% | 216.7% | 142.9% | 73.9% | 163.6% |
| No. of trials Achieving minimum project accrual within projected time (% of Total)b | 11 (7.9%) | 5 (7.9%) | 109 (21.6%) | 16 (28.1%) | 141 (18.5%) |
| Accrual Performance of Trials Not Achieving Minimum Projected Accrual | |||||
| No. of Trials (% of Total) | 50 (35.7%) | 26 (41.3%) | 173 (34.3%) | 35 (61.4%) | 284 (37.2%) |
| Min Projected Accrual (median, IQR)c | 18 (11–30) | 26 (20–51) | 36 (22–60) | 530 (370–1242) | 36 (20–80) |
| Projected Time to Achieve Minimum Projected Accrual, month (median, IQR)ad | 7 (5–11) | 10 (6–16) | 11 (7–18) | 48 (37–60) | 11 (7–20) |
| Accrual Period (period open to accrual/planned accrual period) (%, median)b | 213.3% | 150.0% | 130.8% | 47.2% | 127.9% |
| Total | |||||
| No. of Trials | 140 | 63 | 504 | 57 | 764 |
| Min Projected Accrual (median, IQR)e | 15 (6–25) | 22 (15–45) | 28 (19–53) | 530 (358–1054) | 25 (17–55) |
| Projected Time to Achieve Minimum Projected Accrual, month (median, IQR)af | 6 (3–9) | 7 (5–14) | 8 (5–14) | 40 (27–57) | 8 (5–15) |
Rounded to the following month
Based on time from first patient accrual to study closure
minimum projected accrual: Phase I: p=0.009, Phase II: p<0.001
projected time to achieve minimum projected accrual: Phase I: p<0.001, Phase I/II: p=0.017, Phase II: P<0.001, Phase II: P=0.003
Minimum projected accrual: Phase I<Phase I/II (p<0.001), Phase I<Phase II (P<0.001), Phase I<Phase III (p<0.001), Phase I/II<Phase II (p=0.049), Phase I/II<Phase III (p<0.001). Phase II<Phase III (p<0.001)
Projected Time to achieve minimum projected accrual: Phase I<Phase I/II (p=0.010), Phase I<Phase II(p<0.001), Phase I<Phase II (p<0.001), Phase I/II < Phase III (p<0.001), Phase II < Phase III (P<0.001)
Clinical Trials Accrual Performance
Overall, 62.8% (n=480) of trials achieved at least 100% of the minimum projected accrual goals by closure. The number of the phase III trials that achieved the accrual goals by study closure was statistically significantly lower than the other trials by phase (38.6%, n=22; p<0.001). No statistically significant differences were observed between the trials excluded (n=24) and the study sample with regard to final accrual performance (Spearman’s Correlation: p=0.389).
Only 18.5% (n=141) of the trials achieving minimum project accrual goals met this goal within the projected period of time. Phase III studies had the high proportion of studies that met the minimum goal within the expected period with 28.1% (n=16), followed by phase II studies with 21.6% (n=109), phase I/II trials with 7.9% (n=5) and phase I studies with 7.9% (n=11).
However, on average, trials reaching achieving minimum projected accruals (n=480) were 163.3% slower than planned to achieve this goal. Interestingly, Phase III studies that achieved the minimum projected accruals by study closure (38.6%, n=22) met the accrual goal quickly, that is, within 73.9% of the projected period of time. This is significantly faster (p<0.001) than the other trial phases - the enrollment period for phase I, I/II, and II trials necessary to achieve the minimum projected accrual was 241.7%, 216.7%, and 142.9% of the projected period respectively.
The trials that did not achieve the minimum projected accruals were open 127.9% longer than the expected period to achieve the minimum projected accrual. Phase III studies that did not achieve the minimum projected accrual on median closed prior to the expected period (47.2%). Phase I, I/II, and II trials opened beyond the expected period by 213.3%, 150.0%, and 130.8% respectively.
When comparing trials that achieved the accrual goal at closure to those that did not, trials that closed without achieving the minimum projected accrual had a larger accrual requirement for phase I (p=0.009) and phase II studies (p>0.001). Furthermore, studies that attained the accrual goal had a significantly shorter projected enrollment period compared to studies that did not attain the accrual goal (phase I, p>0.001; phase I/II, p=0.017, phase II, p>0.001, phase II, p=0.003).
Early Indicators of Accrual Performance
To investigate the relationship between time-to-first enrollment with the accrual performance at closure of a study, multivariate logistic regression analysis was conducted to calculate the likelihood of attaining the anticipated accrual goal. Clinical trials were stratified by the number of months required to accrue the first patient from study activation. The likelihood of achieving the accrual goal is highest for those studies that accrued the first patient with the first two months of enrollment (Table 2). All subsequent groups had a statistically significantly decreasing likelihood of achieving their goals compared to this referent group. Relative to trials that accrued the first participant within the first two months, trials taking between 2 and 6 months were statistically significant and less likely to achieve the enroll the minimum projected accrual (OR≤0.637; 95% CI, 0.464–0.875; p=0.005). Studies with a the first accrual between 6 and 12 months as well as studies that had the first accrual beyond 12 months had an decreased and statistically significant likelihood of obtaining the minimum projected accrual at the time of study closure compared to the referent (OR≤0.208, 95% CI, 0.056–0.459; p=0.001). The relationship between month-to-first patient and achieving accrual the accrual goal was consistent when adjusting for the minimum projected accrual of the trial, phase of the study, and cancer incidences by disease.
TABLE 2.
Unadjusted Odds Ratio for Achieving the Minimum Projected Accrual by Study Closure Stratified by the Time-to-first Enrollment (with Adjusted Values)
| Time to First Patient Enrollment (months) | n | Number of Studies Achieving Minimum Accrual Goal at Closure (%) | Unadjusted Odds | P Value | Adjusted Odds* | P Value |
|---|---|---|---|---|---|---|
| [1–2) (referent) | 385 | 272 (70.6) | REFERENT | REFERENT | REFERENT | REFERENT |
| [2–6) | 304 | 184 (60.5) | 0.637 (0.464–0.875) | 0.005 | 0.616 (0.447–0.851) | 0.003 |
| [6–12) | 57 | 19 (33.3) | 0.208 (0.115–0.376) | ≤0.001 | 0.209 (0.115–0.380) | ≤0.001 |
| [12, ) | 18 | 5 (27.8) | 0.160 (0.056–0.459) | 0.001 | 0.183 (0.063–0.531) | 0.002 |
 | ||||||
Adjusted for Study Size, Phase, Cancer Incidence, and Cancer Mortality
The impact of disease type as classified by the cancer incidences collected from the SEER cancer registry was analyzed with respect to the time to first patient (Table 3). No statistical difference between the cancer incidences or mortality and the time to enroll the first patient was observed (p=0.749 and p=0.152 respectively).
TABLE 3.
Disease Type by Sample Size, Time-to-First Patient, Incidence, and Mortality
| Disease Site | # of Trials in Sample | Time to First Patient (months) | IRQ (months) | Min-Max (months) | Incidences (per 100,000) | Mortality (per 100,000 cases) |
|---|---|---|---|---|---|---|
| Gastrointestinal (including colon and pancreas) | 119 | 2 | 1–4 | 1–12 | 84.4 | 43.5 |
| Lung, Mediastinal and Pleural | 86 | 3 | 2–4 | 1–8 | 63.9 | 54.1 |
| Miscellaneous Neoplasm | 75 | 2 | 1–4 | 1–19 | 19.7 | 13.4 |
| Leukemia | 64 | 2 | 2–2 | 1–13 | 12.3 | 7.4 |
| Breast | 58 | 2 | 1–3.25 | 1–22 | 126.1 | 25 |
| Female Reproductive | 57 | 3 | 1–4 | 1–16 | 47.3 | 15.9 |
| Skin | 46 | 2 | 1–3 | 1–10 | 21.1 | 3.5 |
| Lymphoma | 44 | 4 | 2.25–5.75 | 1–18 | 22.2 | 7.8 |
| Central Nervous System | 41 | 3 | 1.5–4 | 1–14 | 6.5 | 4.4 |
| Male Reproductive (including prostate) | 36 | 3.5 | 1.25–6 | 1–16 | 168.4 | 27 |
| Kidney | 36 | 2 | 1–3 | 1–22 | 13.2 | 4.2 |
| Head and Neck | 35 | 3 | 2–5 | 1–14 | 14 | 3.9 |
| Urothelial Tract | 18 | 4 | 2–5.25 | 1–11 | 21.2 | 4.3 |
| Soft Tissue | 17 | 3 | 2–5.5 | 1–12 | 3.1 | 1.3 |
| Myeloma | 13 | 3 | 1.5–3.5 | 1–7 | 5.6 | 3.7 |
| Endocrine | 7 | 2 | 1–2 | 1–2 | 9.8 | 0.8 |
| AIDS-related | 5 | 5 | 1–10.5 | 1–12 | 1.2 | n/a |
| Bone | 2 | 2.5 | 2–3 | 2–3 | 0.9 | 0.9 |
| Immune Disorder | 2 | 4.5 | 4–5 | 4–5 | 0.7 | 0.8 |
| Germ Cell | 2 | 1.5 | 1–2 | 1–2 | 0.4 | 0.2 |
Of the studies that are open beyond the expected period to achieve the minimum projected accrual (n=603), the analysis of the accrual milestone at the time of expected enrollment time period resulted in the observation that studies that have not achieved at least 60% of their minimum projected accrual goal within the stated projected period of accrual result is a statistically significant decrease in likelihood of achieving the desired accrual by study closure (Table 4). Relative to studies that have achieved at least 80% of the minimum projected accrual within the projected period, trials with <60% of the minimum projected accrual have a statistically significant less likelihood of achieving the minimum accrual goals (OR 40%-60% of minimum projected accrual: 0.190,95% CI, 0.055–0.652, p=0.008, OR 20%-40% of minimum projected accrual: 0.121, 95% CI, 0.036–0.409, p=0.002; OR 0% - 20% of minimum projected accrual: 0.065, 95% CI, 0.019–0.227, p>0.001). A total of 391 trials (64.8%) fall within the category of studies with >60% of the minimum projected accrual with a decreased likelihood of achieving the minimum accrual goal at study closure.
TABLE 4.
Unadjusted Odds Ratio for Achieving the Minimum Projected Accruals by Study Closure Stratified Accrual Performance at the Expected Period (with Adjusted Values)
| Percent of minimum projected accrual achieved at Expected Time of Achievement** | n | Number of Studies Achieving Minimum Accrual Goal at Closure (%) | Unadjusted Odds | P Value | Adjusted Odds* | P Value |
|---|---|---|---|---|---|---|
| 0–19% | 97 | 42 (43.3%) | 0.065 (0.019–0.227) | P < 0.001 | 0.060 (0.017–0.213) | p≤0.001 |
| 20–39% | 159 | 93 (58.5%) | 0.121 (0.036–0.409) | p = 0.001 | 0.103 (0.030–0.335) | p≤0.001 |
| 40–59% | 135 | 93 (68.9%) | 0.190 (0.055–0.652) | p = 0.008 | 0.169 (0.049–0.586) | p = 0.005 |
| 60–79% | 89 | 76 (85.4%) | 0.501 (0.134–1.871) | p = 0.304 | 0.476 (0.127–1.792) | p = 0.273 |
| 80–99% (referent) | 38 | 35 (92.1%) | REFERENT | REFERENT | REFERENT | REFERENT |
| ≥ 100% | 85 | 85 (100%) | N/A | N/A | N/A | N/A |
Adjusted for Study Size, Phase, Cancer Incidence, and Cancer Mortality
Trials closed prior to the expected time to achieve minimum accrual (n=151, 21.1%) were excluded
Given the previously established differences among phase, minimum projected accruals, and time-to-first enrollment on a study, the likelihood values were adjusted for these three variables are also summarized. No differences in the relationship between the percent of accrual achieved at the accrual milestones were observed when adjusting for the additional factors.
CONCLUSION
This study investigates the accrual performance of oncology clinical trials and highlights the opportunities to utilize early enrollment indicators as a predictor of eventual attainment of accrual goals. The analysis of National Cancer Institute Cancer Therapy Evaluation Program oncology trials reveals that a small number of trials (11.1%, n=85) are able to achieve the minimum projected accrual within their planned enrollment period. Almost two out of five trials in the sample did not achieve the minimum projected accrual by study closure. For phase I, I/II, and II studies did that achieve the minimum projected accrual goal, the project accrual time period is often under-estimated when compared to the actual time required; these trials are opened to patient accrual 213.8%, 150%, and 130.8% longer than the expected to achieve the minimum projected accruals respectively. Phase III studies are unique because a higher percentage (61.4%, n=35) of trials closed without achieving the minimum projected accruals; however, trials that either close without achieving the minimum accrual goals or do achieve the minimum accrual goals do so before their expected time period.
We provide multiple accrual milestones of a clinical trial that can be utilized to access the likelihood of a trial achieving minimum projected accrual. The findings demonstrate that the accrual performance of a clinical trial can be predicted as early as the time-to-first enrollment on a trial. Almost half of the studies (n= 379, 49.6%) enroll the first patient outside the first two months of the study enrollment, which translates into those studies having a statistically significantly lower odds of achieving the minimum projected accruals at study closure (odds ratio:≤0.637) when compared to the referent.
Furthermore, trial accrual performance can also be predicted at the expected period to achieve the minimum projected accrual goal. Even with the use of a more liberal definition for projected period to achieve the minimum projected accrual, a large percentage of studies (64.8%, n=391) fall into the category of not achieving at least 60% of the minimum projected accruals by the projected period and thus have a decreased likelihood of achieving the minimum projected accrual by study closure.
Adequate accrual to clinical trials is the most fundamental and easily quantifiable measure of performance for a clinical trial (Wittes and Friedman 1988). The ability to monitor clinical trial accrual performance allows for greater support for earlier decisions to be made regarding the management of clinical trials. Identifying studies with a decreased likelihood of achieving the minimum projected accrual may lead to trial decisions. Decisions can be made to add additional resources and/or funding to implement actions that may improve accruals, such as opening a study to multiple institutions, or closing studies early to release resources to support other trials with a greater likelihood of achieving their accrual goals.
We do not advocate making decisions solely on accrual performance during these two accrual milestones; rather, we advise utilizing accrual-monitoring metrics to complement the scientific judgment of competing accruals to each individual clinical trial when making decisions regarding the management of trials. Specifically, we advocate applying the findings in this research into a stages-gates model through the enrollment period utilizing these milestones as critical evaluation points (Cooper 1990). This is a commonly used process control technique used in the development of products, processes, and systems whereby continuous decision-making is integrated to optimize the utilization of resources throughout the lifecycle. Enrollment periods would be stratified based upon predetermined milestones that would define each stage. The gates would be set at each milestone where decision-making regarding the continuation of the trial and/or allocation of resources to the trial could be made. These decisions should be made relative to the overall portfolio of trials and coupled with the dimensions of scientific relevancy, operational feasibility, and strategy importance to better optimize the number and types of trials that achieve the intended objectives.
This study utilizes accrual estimations set forth by the investigators and the study team in order to extract the accrual milestones for evaluation. Observations from this research find that both accrual rates and accrual requirements are being underestimated. There is a need find methods to reasonably estimate the accrual performance and operational feasibility of clinical trials early on in the design and development of the trial. Achieving accrual goals is the fundamental requirement that must be satisfied – without the necessary enrollments, the ultimate scientific question cannot be answered. Furthermore, investigators should be held accountable to the accrual estimations in order to proactively manage the trials throughout the enrollment period.
Closing studies due to poor accruals is not ideal in any circumstances. Large amounts of time and effort are consumed on the development of a clinical trial with poor accrual and the ultimately do not allow the intended scientific endeavor to come to fruition (Dilts and Sandler 2006; Dilts, Sandler et al. 2006; Dilts, Sandler et al. 2008). Patients may be volunteering to participate on a study enroll on studies that do not help advance the state of medicine. Sunk cost bias ingrained from the efforts committed towards the development of the clinical trial can often jeopardize current resources to be allocated to poor accruing trials trial even beyond the likelihood of attaining the accrual requirements.
The results presented in this paper are limited by the fact that findings are applicable for only NCI-CTEP studies – specific accrual milestones may be unique dependent upon various institutional and study characteristics. Furthermore, there are numerous reasons why studies have low accrual or why studies close to accrual prior to achieving the minimum projected accrual. Continued research should be conducted to identify characteristics that are attributed to studies with low accrual in order to reduce the occurrence of studies being closed without any sufficient accrual needed to gain the intended scientific objective.
Acknowledgments
Supported by Grant No. 3U10 CA 21115-32 from the National Cancer Institute to Comis, RL and by subcontract to Dilts, DM and Sandler, AB
Footnotes
The authors indicate no potential conflicts of interest
We acknowledge that studies can close due to a host of reasons, including adverse events, regulatory requirements, or other unforeseen situations. The specific reason for study closure was not available.
References
- Surveillance Epidemiology and End Results. Retrieved August 30, 2008, 2008, from http://seer.cancer.gov/
- Abrams JS, Murgo A, et al. NCI’s cancer therapy evaluation program: a commitment to treatment trials. Cancer Treat Res. 2007;132:31–50. doi: 10.1007/978-0-387-33225-3_3. [DOI] [PubMed] [Google Scholar]
- Ansher SS, Scharf R. The Cancer Therapy Evaluation Program (CTEP) at the National Cancer Institute: industry collaborations in new agent development. Ann N Y Acad Sci. 2001;949:333–40. doi: 10.1111/j.1749-6632.2001.tb04041.x. [DOI] [PubMed] [Google Scholar]
- Carter RE, Sonne SC, et al. Practical considerations for estimating clinical trial accrual periods: application to a multi-center effectiveness study. BMC Med Res Methodol. 2005;5(1):11. doi: 10.1186/1471-2288-5-11. [DOI] [PMC free article] [PubMed] [Google Scholar]
- Cheng S, Dietrich M, et al. A sense of urgency: Evaluating the link between clinical trial development time and the accrual performance of CTEP-sponsored studies. Clinical Cancer Research. 2010 doi: 10.1158/1078-0432.CCR-10-0133. (forthcoming) [DOI] [PMC free article] [PubMed] [Google Scholar]
- Cooper R. Winning at new products. Addison-Wesley; Reading, MA: 1990. [Google Scholar]
- Dilts DM, Sandler A, et al. Development of clinical trials in a cooperative group setting: the eastern cooperative oncology group. Clin Cancer Res. 2008;14(11):3427–33. doi: 10.1158/1078-0432.CCR-07-5060. [DOI] [PMC free article] [PubMed] [Google Scholar]
- Dilts DM, Sandler AB. Invisible barriers to clinical trials: the impact of structural, infrastructural, and procedural barriers to opening oncology clinical trials. J Clin Oncol. 2006;24(28):4545–52. doi: 10.1200/JCO.2005.05.0104. [DOI] [PubMed] [Google Scholar]
- Dilts DM, Sandler AB, et al. Processes to activate phase III clinical trials in a Cooperative Oncology Group: the Case of Cancer and Leukemia Group B. J Clin Oncol. 2006;24(28):4553–7. doi: 10.1200/JCO.2006.06.7819. [DOI] [PubMed] [Google Scholar]
- Emanuel EJ, Schnipper LE, et al. The costs of conducting clinical research. J Clin Oncol. 2003;21(22):4145–50. doi: 10.1200/JCO.2003.08.156. [DOI] [PubMed] [Google Scholar]
- Institute of Medicine. A National Cancer Clinical Trials System for the 21st Century: Reinvigorating the NCI Cooperative Group Program. Washington DC: Institute of Medicine of the National Academies; 2010. [DOI] [PMC free article] [PubMed] [Google Scholar]
- Murthy VH, Krumholz HM, et al. Participation in cancer clinical trials: race-, sex-, and age-based disparities. Jama. 2004;291(22):2720–6. doi: 10.1001/jama.291.22.2720. [DOI] [PubMed] [Google Scholar]
- Waldinger M. Institute of Medicine: Multi-site Clinical Trials and NCI Cooperative Groups. Washington DC: Institute of Medicine; 2008. Cost-out. [Google Scholar]
- Wittes RE, Friedman MA. Accrual to clinical trials. J Natl Cancer Inst. 1988;80(12):884–5. doi: 10.1093/jnci/80.12.884. [DOI] [PubMed] [Google Scholar]