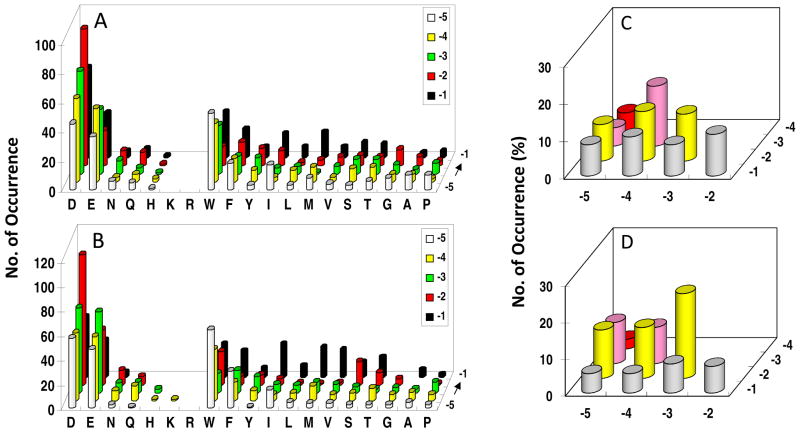
Figure 4.
Histograms showing a comparison of the sequence specificity of SHP-1 (A and C) and SHP-2 (B and D) on the N-terminal side of pY. In (A) and (B), the y axis represents the number of selected peptides that contained a particular amino acid (x axis) at a given position within the peptide (pY−5 to pY−1, on the z axis). M, Nle; Y, F2Y. In (C) and (D), the y axis represents the percentage of selected peptides that contained acidic residues at a particular combination of positions within the peptides (pY−1 to pY−4 on the z axis and pY−2 to pY−5 on the x axis). Only peptides containing two acidic residues (143 sequences for SHP-1 and 151 sequences for SHP-2) were used for the analysis in (C) and (D).

