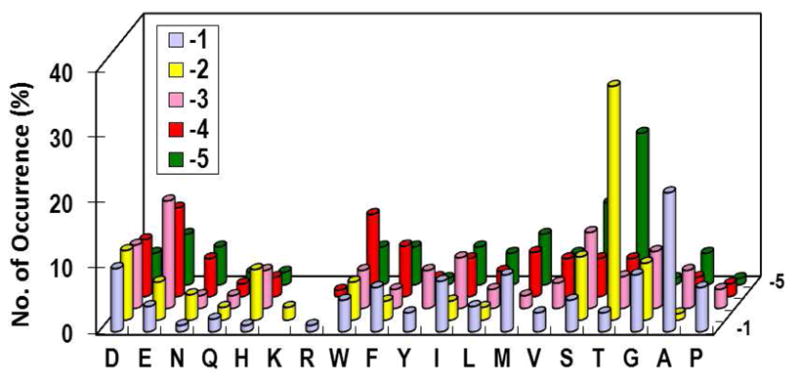
Figure 6.

Substrate specificity of RPTPα on the N-terminal side of pY. The y axis represents the percentage of selected peptides that contained a particular amino acid (x axis) at a given position within the peptide (pY−1 to pY−4, on the z axis). M, Nle; Y, F2Y.
