Abstract
Uncovering how motoneurons utilize their voltage-sensitive conductances to systematically respond to a variety of inputs is paramount to understanding synaptic integration. In this study, we examine the input dynamics and frequency-dependent characteristics of active conductances in motoneurons as viewed from the soma in the decerebrate cat. We evaluated the somatic response of the motoneuron by superimposing a voltage sinus sweep (a sine wave in which frequency increases with time, which is often referred to as a zap or chirp) at a subset of membrane holding potentials during discontinuous, single-electrode, somatic voltage-clamp. Results from both experimental and modeling data indicate that ionic conductances can respond to a wide variety of input dynamics. Notably, it appears that there is a divergence between low input conductance type S and high input conductance type FF motoneurons in their response to input frequency. Type S motoneurons generate a larger response to lower frequency input dynamics (compared with their response to higher frequencies), whereas type FF generate a larger response to higher input frequency dynamics. Functionally, these results may indicate that motoneurons on the lower end of the motor pool (i.e., recruited first) may favor steady inputs, whereas motoneurons at the higher end (i.e., recruited later) may favor input transients in producing action potentials.
Keywords: synaptic processing
motoneurons, like all neurons, are equipped with a wide range of voltage-sensitive conductances that presumably govern cell excitability and regulate synaptic integration (Barrett and Crill 1980; Harris-Warrick 2002; Hounsgaard and Kiehn 1985; Li and Bennett 2007; Powers and Binder 2003; Umemiya and Berger 1994). Although these currents have been explored individually and in relation to specific motoneuron properties such as plateau potentials (Alaburda et al. 2002), their en masse ability to sculpt synaptic input and thereby dynamically alter the cell's response is not well understood. In this study, we focus on the processing capabilities of currents evoked from the soma (i.e., currents that act on the entirety of the synaptic input, as opposed to localized, dendritic processing).
To date, we and others have examined subregions of dynamic input under various conditions (e.g., Baldissera et al. 1982; Jones and Lee 2006; Lee and Heckman 2001; Manuel et al. 2009; Schwindt and Crill 1980). From these studies, it is apparent that input dynamics do alter motoneuron response. Specifically, Manuel and colleagues, focusing on frequencies below 100 Hz and subthreshold membrane potential in the cat (Manuel et al. 2007) and mouse (Manuel et al. 2009), found that motoneurons exhibited a resonance at relatively low frequencies (∼6–30 Hz across cat and mouse). In comparison we previously observed negative conductance at 125 Hz that could be associated with spike threshold and is likely due to a persistent component of the sodium current (Lee and Heckman 2001). Taken together, these findings indicate that motoneurons do exhibit dynamic input sculpting that can be examined by probing frequency, in addition to more traditional inputs. In this study, we specifically examine the somatic response as a function of frequency and baseline membrane potential across the motor pool with both computer modeling and experimental protocols. With this combined approach we can begin to reveal how the transient component of synaptic input is transformed into output across the fast-slow spectrum of motoneurons innervating the lower hindlimb.
The results of the work presented here reveal that the previous reports of resonance and negative slope conductances represent a complex phenomenon involving just-subthreshold membrane oscillations, spike initiation, and input-to-spike rate gain. Moreover, our results indicate that these phenomena vary systematically across the motor pool. Specifically, we show that active conductances appear to exhibit an activation peak in frequency that varies systematically by cell size. These results support the proposition that motoneurons at the type S end of the motor pool (i.e., motoneurons with low input conductance, innervating slow twitch muscle fibers) preferentially respond to slower inputs. Comparatively, motoneurons at the type FF end of the pool appear to preferentially respond to transients in input. The functional implications of this differential response as well as its impact on the two primary motoneuron excitability parameters, recruitment, and rate modulation (Heckman et al. 2009) are discussed.
MATERIALS AND METHODS
Experiments were performed in 17 spinal motoneurons in nine adult decerebrate cats in accordance with procedures approved by The Georgia Institute of Technology animal care committee. Intracellular recordings of medial and lateral gastrocnemius motoneurons in the lumbar spinal cord were obtained with sharp microelectrodes. Details of the surgical preparation are described in Jones and Lee (2006). Briefly, all surgical preparations of the spinal cord and hindlimb were done under deep gaseous anesthesia: 1.5–3.0% isoflurane (Baxter) in a 3:1 mixture of O2 and N2O. The preparation included a laminectomy to expose the L7 and S1 segments of the spinal cord for intracellular recording. In the hindlimb, the nerves to the medial gastrocnemius (MG) and lateral gastrocnemius-soleus (LGS) muscles were isolated and placed on hook-shaped bipolar stimulating electrodes. The gaseous anesthesia was discontinued after a precollicular decerebration in which all forebrain anterior to the colliculi was removed. All preparations were then paralyzed with Flaxedil (MP Biomedicals) and artificially respired. A bilateral pneumothorax was created to enhance intracellular recording stability when needed. Motoneurons innervating MG and LGS were located via field potentials from antidromic stimulation and impaled with glass microelectrodes (3 to 4 MΩ) filled with a 0.5 M potassium citrate/1.5 M potassium chloride solution. Overall health of impaled cells was assessed by spike amplitude >70 mV and a stable resting membrane potential. Cells were voltage-clamped by discontinuous voltage clamp with a switching frequency between 7 and 10 kHz on an AxoClamp 2B (Axon Instruments), along with an external low frequency gain boost circuit with a 100-Hz corner (Lee and Heckman 1998).
Assessment of relative position in motor pool.
The work presented in this article involves comparing motoneurons relative to their size within the MG/LGS motor pool. We have typically used cell input conductance (GN) for this purpose in past work with the lowest values (∼0.5 μS) indicating motoneurons at the type S end of the pool and the highest values (∼2.5 μS) indicating motoneurons at the type F end of the pool. However, there are alternative measures of input conductance (e.g., peak/steady state deflection due to hyperpolarizing current step, response to low frequency sinusoidal/pulsed inputs, etc.) that would include or exclude various possible influences (e.g., capacitive, h/sag, persistent sodium, etc.) Consequently, we explicitly define the term input conductance (GN) to mean the measure of the slope of the current-voltage relationship obtained during a 5-s ascending voltage-clamp ramp protocol at voltage levels hyperpolarized to both spike threshold and resting membrane voltage. For most cells, this equates to an assessment of the slope over the range from −65 mV to −60 mV. However, the range varies since exact absolute voltages are not known until after the local extracellular voltage is assessed post recording. Thus this definition closely approximates the steady-state input conductance.
Assessment of frequency response.
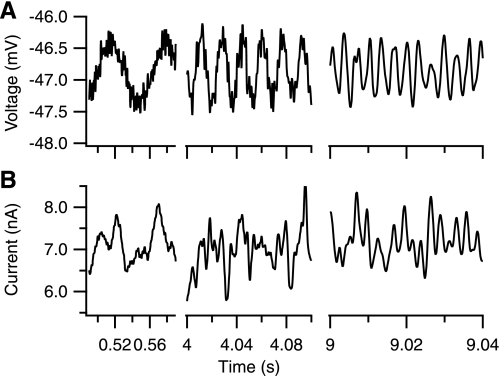
The experimental approach to assessing the dynamic electrophysiological properties of the cell was to superimpose a voltage sinus sweep (a sine wave that increases in frequency with time and often referred to as a zap or chirp) on various holding potentials during discontinuous, single-electrode, somatic voltage-clamp. The frequency of the sine wave began at 12.5 Hz and increased exponentially to 412 Hz over 10 s, with the result that an equal number of oscillations occur at lower frequencies versus higher frequencies (Fig. 1). The amplitude of the sine wave command (Vcommand) remained constant throughout at 0.25 mV. However, the measured voltage (Vsin) tended to decrease slightly from Vcommand at higher frequencies and included a small time lag. These effects are as expected with increasing capacitative currents at higher frequencies and the inclusion of a feedback control circuit such as the one used in the AxoClamp to clamp voltage. These frequency-dependent factors were analyzed and compensated for in the subsequent analysis such that only the properties of the cells were assessed rather than the cell + the AxoClamp. Compensation consisted of extracting and smoothing the phase and magnitude of Vsin and applying the phase and magnitude to Vcommand for calculations. (Using Vsin directly resulted in added noise and filtering was not viable due to the phase shifting.)
Fig. 1.
Highlighted regions of example sinusoidal sweep protocol. Upper traces: exponentially increasing frequency command is imposed on a holding voltage during voltage clamp. Command oscillations are ±0.25 mV but calculations use measured rather than command magnitudes (See materials and methods). Lower traces: intracellular current response to imposed voltage command. Traces have been high-pass and low-pass filtered at 1/5 and 5 times the command frequency, respectively. Left to right: time windows into data with increasing protocol time/frequency. Note that the time scales are expanded at the higher frequencies for clarity.
The current measured with the voltage-clamp protocol was used to quantify the admittance of the cell (the complex equivalent of effective conductance) as a function of frequency. Evaluation of the currents and the resulting real and imaginary components of the admittance required several steps but is qualitatively similar to our previous method (Lee and Heckman 2001). Briefly, the real component (i.e., the conductance) can be extracted by the equation Gsin = Isin* Vsin/(Vsin* Vsin), where Vsin and Isin are the measured sinusoidal input and current response, respectively. Likewise the imaginary component (referred to as the susceptance, Bsin, which is closely related to the capacitance) can be extracted with the same equation but with the input (Vsin) shifted 90 degrees in phase. The chirp data were high- and low-pass filtered with a box moving frequency window filter with effective corner frequency that was ∼5× and 1/5× the command frequency at any given point.
Assessment of threshold voltage.
The voltage range of primary interest in this study is subthreshold through just suprathreshold. However, spike threshold can be interpreted using various methods that result in measures that vary by several millivolts (Sekerli et al. 2004). Additionally, the measure is complicated by the protocol used (e.g., step or ramp input, first spike, nth spike, average of first n spikes, etc.) We have previously shown that spike threshold in lumbar motoneurons is highly correlated with the point of negative slope onset in the fast current-voltage relationship (Lee and Heckman 2001). In the nomenclature used in this article, this is the point where the net effective conductance of the cell, measured at 125 Hz, becomes negative. It lies ∼2 mV hyperpolarized to our peak-of-the-second-derivative method for spike threshold (Sekerli et al. 2004), with this offset being independent of cell input conductance (Lee and Heckman 2001). This relation between negative slope onset and spike threshold was reassessed and confirmed in this work in seven cells (r = 0.94; P < 0.001) with an offset between onset and spike threshold of 2.0 ± 1.8 mV as expected. Additionally, the absolute spike threshold voltages measured in these cells compared well with our previous measures (−46 ± 7.5 mV here vs. −44 ± 5 mV in Lee and Heckman 1998). Importantly, this measure is available during voltage clamp meaning fewer current-clamp voltage clamp switches and fewer protocols overall, both of which can degrade cell health. Consequently, we use this value as a stand-in for spike threshold throughout this presentation and refer to it simply as the threshold, with voltage being reported relative to this value.
Model analysis.
The above protocols were also simulated on our published top-down motoneuron model (Shapiro and Lee 2007). Briefly, the model simulates active conductances in the soma (sodium and potassium delayed-rectifier), initial segment (persistent sodium and potassium delayed-rectifier), and all dendritic compartments (L-type calcium channels, small potassium channels, persistent sodium, and H). Structurally, the model compartmentalizes a motoneuron into an initial segment, a soma, and one branched dendrite. The dendrite is split into two proximal branches, and the entire dendrite is eight uniform compartments in length with a passive electrotonic length of 1.3. The branches themselves have an asymmetric distribution of channels such that only one branch contains the plateau-producing calcium channels. However, both branches contain sodium channels of sufficient density to implement electrotonic compression (Shapiro and Lee 2007). All protocols and calculations were the same as those used experimentally as described above. The single exception is that no subtraction of lag was performed since no hardware lag was present in the computer model.
Statistical analysis.
A threshold for significance of P < 0.05 was used throughout the analysis. Except were noted, statistical analysis was based on least-squares linear regression to determine correlation coefficients. Associated P values indicate the probability of the regression slope being different from zero.
RESULTS
Model predictions.
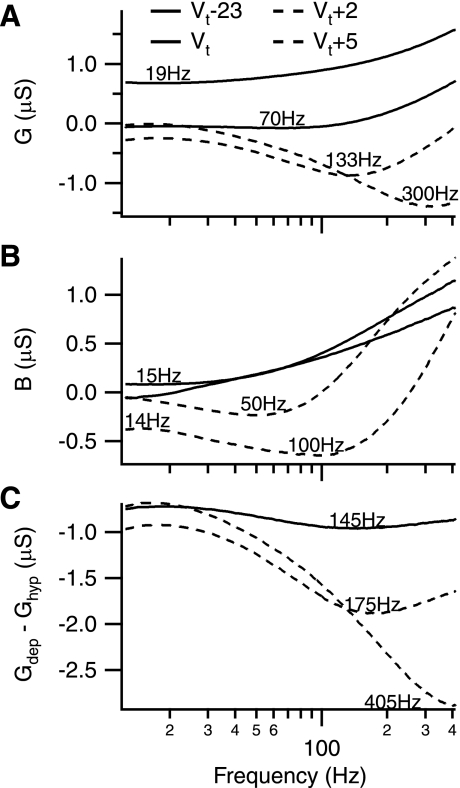
Given the complexity of the analysis presented here, we begin with basic model predictions for the protocols, since these predictions help frame the experimental observations. The two components of the response (referred to as G, the conductance, and B, the susceptance, respectively) are shown in Fig. 2 for various holding potentials. If the cell was an idealized passive resistor-capacitor (i.e., RC) circuit, the two components would correspond to G = 1/R (i.e., a constant with respect to frequency, f) and B = C*(2πf). As can be seen, the conductance component (G) is not constant. On the other hand, the susceptance component (B) increases with frequency as expected and is qualitatively similar to the response of a simple capacitor. In general, these deviations from idealized RC behavior are attributable to passive cable properties (Rall 1967).
Fig. 2.
Model predictions. The conductance (G) and the susceptance (B) aspects of the frequency-sweep response of the model are shown for several holding potentials [−23 mV, 0 mV, +2 mV, and +5 mV relative to threshold (Vt)]. Solid and dashed lines indicate subthreshold and threshold/suprathreshold holding potentials, respectively. Values indicate the frequency of the negative peak in curve. A: G decreases with depolarization, an effect that becomes more pronounced at higher frequencies. Note the progressive flattening of the frequency response as threshold is approached (compare the −23-mV trace with the 0-mV trace). B: B generally decreases with depolarization as well and also undergoes an increase of curvature. Although the hyperpolarized response is quite linear, the subthreshold (0 mV) response increases at the extrema of the frequency range and remains linear in the 30- to 80-Hz region. C: the active portion of G is obtained by subtracting the passive, hyperpolarized conductance (Ghyp) from the depolarized frequency responses (Gdep). As with the former case, the active portion generally decreases upon depolarization with the minima becoming more pronounced and progressively shifted to higher frequencies.
Notably, as membrane potential is depolarized, G generally decreases, with the decrease being somewhat greater as frequency increases. B also decreases with depolarization, primarily in the low-to-middle frequency range and, to a lesser extent, at higher frequencies. Thus the model prediction is that G and B will both decrease with depolarization, with the decrease in G being greater at higher frequencies. When compared with a simple RC behavior, this prediction translates into a time constant that increases with frequency and with depolarization, whereas the resistance (R) decreases with frequency and increases with depolarization. Importantly, when G or B decreases to values below zero, the membrane potential becomes unstable as the time constant, and/or resistance becomes negative. This instability is the presumed basis for spike threshold (Lee and Heckman 2001; Manuel et al. 2009) and possibly for just sub-threshold oscillations (Lee and Heckman 2001; Manuel et al. 2009).
A more detailed examination of the effect of holding potential on G reveals that the active portion of the conductance (found by subtracting the hyperpolarized measure from a depolarized measure) exhibits a negative peak, which increases in both magnitude and frequency as holding potential is increased (Fig. 2C). This leads to the second model prediction, which is that the net active conductance will be negative with a peak that increases in both magnitude and frequency as holding potential increases. In this protocol, a negative conductance is indicative of a voltage-activated net inward current.
Experimental observations.
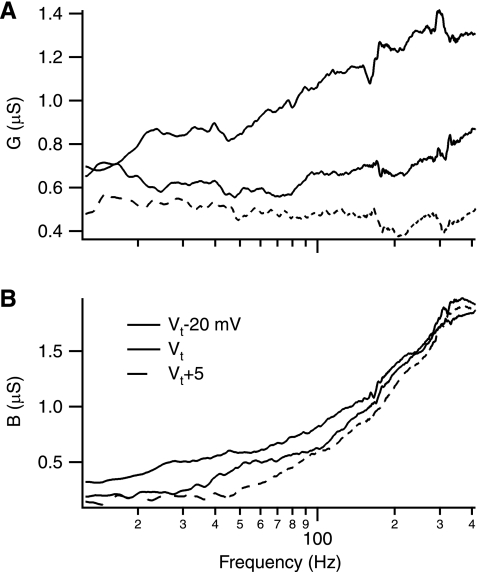
The chirp protocol was recorded in 17 spinal lumbar motoneurons from nine adult cats at various holding potentials. Although the experimental results were generally consistent with the model predictions (Fig. 3), there were notable differences. At hyperpolarized holding potentials G roughly corresponds to the behavior of a conductor (i.e., 1/R) and B roughly corresponds to the behavior of a capacitor (i.e., C*2πf). However, G seems to increase somewhat more than expected and B seems to exhibit a positive offset. Thus it appears that G and B do not separate cleanly when measured experimentally and that there is some crosstalk between the measures. Extensive attempts to remove this crosstalk in post processing analysis failed. Thus this crosstalk would have to be viewed as an experimental limitation to the resolution of this protocol and its analysis (see discussion).
Fig. 3.
Example of G and B with depolarization. The conductance (G) and the susceptance (B) components of a response of a typical cell to a frequency sweep are shown for 3 holding potentials (−20 mV, 0 mV, and +5 mV relative to threshold). A: G vs. depolarization. At the hyperpolarized holding potential (dark trace), G increases with increases in frequency, whereas G at depolarized potentials (light traces) tends to decrease with increasing frequency. B: B vs. depolarization. Although B increases with frequency at each holding potential, B at more depolarized levels tends be lower than more hyperpolarized traces.
With depolarization, G and B decrease in value as predicted in the model. Of the 17 cells observed, 14 exhibit a decline in G with frequency over much of the frequency range observed with some deviation at the highest frequencies. However, the magnitude of the reduction in G appears to be less than expected, whereas the reduction in B is larger than expected. Although this is consistent with the crosstalk issue discussed above, it is also apparent that the active conductances themselves are undergoing significant inactivation at suprathreshold holding potentials. This inactivation was first observed with our original ramp protocols (Lee and Heckman 1998) and ramp + 125 Hz protocols (Lee and Heckman 2001). However, the longer holding time for these chirp protocols appears to maximize this inactivation. Thus the measures of active conductance obtained with this method above threshold are likely an underrepresentation of the total possible active conductance response (see below).
Voltage dependence of active admittance.
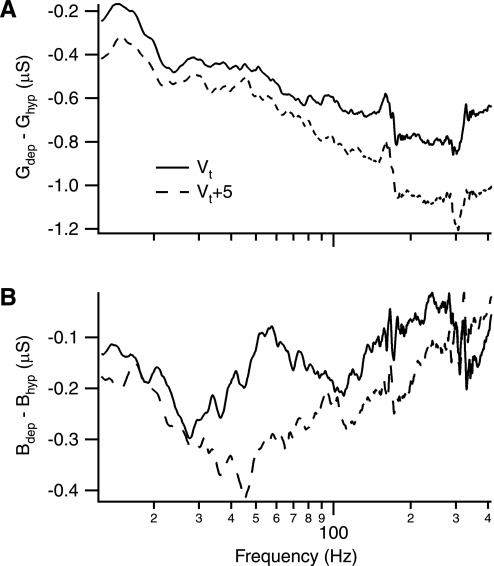
The active components of G and B were assessed by subtracting a hyperpolarized trace from more depolarized ones (Fig. 4). As shown in the example cell and as predicted by the model, the active component of G is net negative (Fig. 4A). As also predicted, this component increases in magnitude with frequency, reaches a peak, and then decreases with further increases in frequency. The active component of B in the example cell (Fig. 4B) was generally smaller than that observed for G, making direct characterization problematic because of the experimental variability and crosstalk within the measurements.
Fig. 4.
Example of active components of G and B. The figure shows the same cell as in Fig. 3 but with hyperpolarized trace subtracted from depolarized traces to isolate the active components of G and B. A: active component of G. As expected from Fig. 3, the active component of G is net negative and increases in magnitude with a maximum frequency around 300 Hz (visually identified). B: active component of B (Bhyp, hyperpolarized trace; Bdep, depolarized trace). Likewise the active component of B is net negative, but it peaks at a lower frequency.
Across the entire data set, a within-cell comparison of 19 traces from 14 cells between hyperpolarized and depolarized traces (ranging from −10 mV to +5 mV from threshold) revealed that G at 12.5 Hz decreased by 0.16 ± 0.27 μS on average, whereas G at 125 Hz decreased by 0.48 ± 0.26 μS, and the difference was significant (t-test, n = 19; P < 1E-4). Notably, there appeared to be a trend toward smaller reductions at 12.5 Hz in cells with larger input conductance. Thus the model predictions are consistent with the experimental observations.
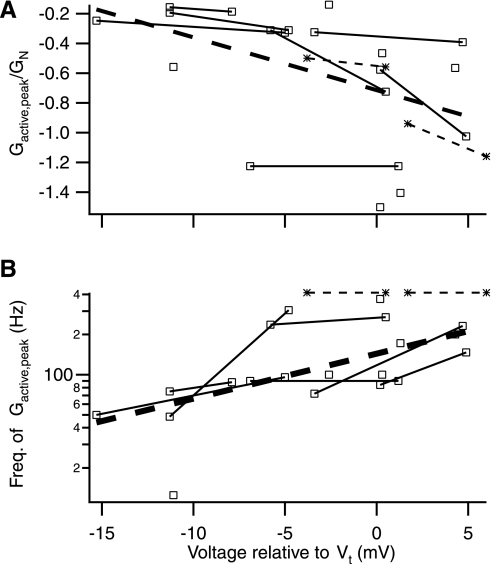
Further examination and analysis of the active conductance were performed both within and across cells (Fig. 5). The data reveal that there is a trend toward larger (i.e., more negative) active component peak values with depolarization (Fig. 5A; n = 24 from 14 cells, r = −0.53, P < 0.01). Additionally, the within-cell trends (Fig. 5A) support this finding. The frequency at which the peak occurs also trends toward higher values with depolarization (Fig. 5B; n = 24 from 14 cells, r = 0.52, P < 0.01). Again, the within-cell data support the trend.
Fig. 5.
Voltage-dependence of active components of G. Population wide characterization of the peak in active G as exemplified in Fig. 4A. Voltage is relative to fast onset threshold, which is ∼2 mV hyperpolarized to spike threshold. A: voltage-dependence of the active G peak magnitude. Peaks tend to increase in magnitude (i.e., become negative) with depolarization. Heavy dashed line indicates overall linear regression trend (see text). Solid lines connect within-cell traces, which all follow the overall trend. Asterisk/light dashed lines denote 2 cells in which peak was apparently greater than the protocol max (i.e., >412 Hz) and so were characterized at 412 Hz instead of the peak. B: voltage-dependence of the active G peak frequency (Freq.). Trend is for higher peak frequencies with depolarization. Same markings as in A.
When comparing our previous ramp +125 Hz method with the current chirp method, we would expect that the data shown in Fig. 5A would pass through −1 normalized G at 0 mV relative to threshold, since this is the point where both methods assess a zero slope. As can be seen, the regression line is somewhat above that point (∼0.72), indicating about a 30% reduction in the chirp-based measure relative to the ramp-based method. As previously mentioned, this reduction was previously observed in the descending ramp phase of the original ramp data (not shown) and is consistent with a partial inactivation of the underlying currents due to the prolonged depolarization of the chirp method (see discussion).
Given the small differences and large curvature of the susceptance, B, direct comparison was bypassed in favor of regressing the raw data to an idealized capacitor with an offset (i.e., B0 + C*2πf). Of the 24 traces so analyzed, 23 appear reasonably well characterized with one being poorly characterized by the simple linear fit. Analysis of this regressed data versus holding voltage revealed trends similar to those seen in G. Thus the active component of B (i.e., Bdep − Bhyp) at 12.5 and 125 Hz became more negative with depolarization (n = 23; r = −0.64 and −0.50, respectively; P < 0.015).
Role of input conductance.
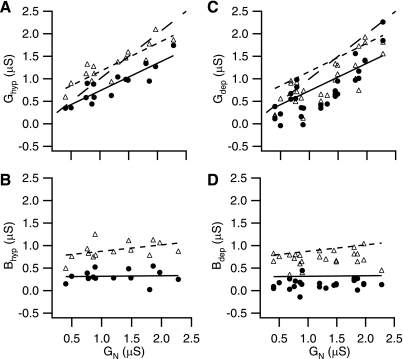
G, B, and their subcomponents were compared with overall somatic input conductance (GN), and G, but not B, was found to vary with GN (Fig. 6). For clarity of comparison we chose two frequencies at which to assess the role of input conductance: 12.5 Hz (our lowest measured frequency) and 125 Hz (a frequency that aligned well with peak active conductance at threshold as well as our prior work). At hyperpolarized levels (defined as >10 mV hyperpolarized from threshold), G at both 12.5 and 125 Hz showed a consistent skew with respect to our standard measure of input conductance, GN (Fig. 6A). At 125 Hz G was greater than GN for lower input conductance cells and less than GN for higher input conductance cells (n = 15, r = 0.88, P < 1E-4), whereas at 12.5 Hz G was uniformly shifted downward (n = 15, r = 0.90, P < 1E-4). In contrast, the susceptance, B, was remarkably constant with respect to GN (Fig. 6B) at 12.5 Hz and with only a slight upward trend at 125 Hz. Since B at 12.5 Hz likely represents the bulk of the crosstalk, we take its lack of correlation as a good indicator that crosstalk is not responsible for the trends observed in G (see discussion).
Fig. 6.
G and B vs. steady input conductance (GN) at hyperpolarized and depolarized holding potentials. A: G vs. GN at 12.5 and 125 Hz for hyperpolarized holding potentials. As expected, G correlates with GN (see text for statistics) but is somewhat shifted relative to a unity relationship (large dashed line). G at 12.5 Hz (● and solid regression line) has a value similar to GN at low conductance levels but tends to be below GN at higher conductance levels. G at 125 Hz (▵ and dashed regression line) is similar but shifted upward. B: B vs. GN at 12.5 and 125 Hz for hyperpolarized holding potentials. Same markings as A. There appears to be no relationship between B and GN (see text for statistics). C: G vs. GN at 12.5 and 125 Hz for depolarized holding potentials. ● and ▵ are 12.5 Hz and 125 Hz, respectively. Solid and dashed lines are from A. Depolarized measures of G are notably lower than their hyperpolarized counterparts in A (see text for statistics). D: same as C but for measures of B. Again depolarized measures of B are notably lower than their hyperpolarized counterparts in B.
At depolarized levels (defined as >−8 mV from threshold), G and B look qualitatively similar but are shifted to lower values (Fig. 6, C and D). G at 12.5 Hz was still strongly correlated with GN (n = 25, r = 0.80, P < 1E-4; note most cells have 2 depolarized traces). G at 125 Hz was similar (n = 25, r = 0.76, P < 1E-4). Likewise B at 12.5 Hz was again remarkably constant, whereas B at 125 Hz has a slight upward bias with GN.
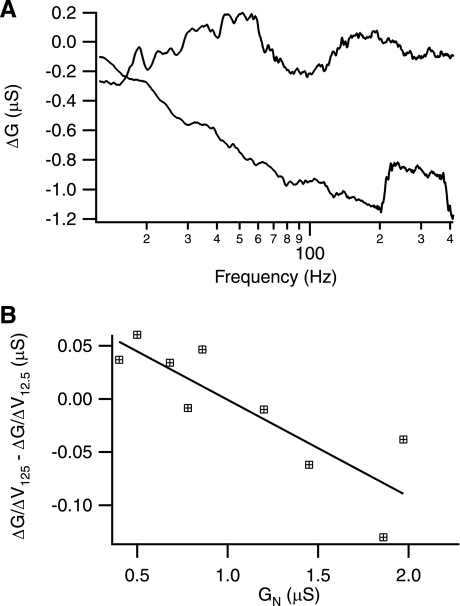
In cells where two depolarized traces were obtained, a closer examination of changes in G and B with depolarization was made (Fig. 7). With the subtraction of the two traces, any trends with GN and frequency can be seen. As illustrated in Fig. 7A, there does appear to be a difference between how lower input conductance (0.5 μS) and high input conductance (1.86 μS) respond with depolarization. To assess this effect, we normalized changes in G with respect to extent of depolarization, thereby calculating ΔG/ΔV (a measure of the curvature in the current-voltage relationship). Subtracting the normalized I-V curvature (ΔG/ΔV) at 12.5 Hz from the 125-Hz value reveals that the relative curvature decreases with input conductance, crossing zero at ∼1 μS (Fig. 7B; n = 9, r = −0.85, P < 0.01). Thus lower input conductance cells have more downward curvature at lower frequencies than higher frequencies. However, higher input conductance cells are just the opposite, with more downward I-V curvature at higher frequencies than and lower ones. Examination of B in a similar fashion did not reveal any trends (not shown).
Fig. 7.
Depolarization-induced changes in G in low vs. high input conductance cells. A: examples of shift in G with depolarization. Upper cell (gray trace) is from low end of input conductance range (0.5 μS), whereas lower cell (black trace) is at high end of input conductance range (1.86 μS). Although both cells exhibit similar shifts in G at low frequencies, they diverge dramatically as frequency increases. B: comparison of relative I-V curvature at 12.5 vs. 125 Hz. In 9 cells where 2 protocols were run close to the threshold voltage, the normalized I-V curvature (i.e., ΔG/ΔV/GN) was determined and compared at 12.5 and 125 Hz. As shown, there is a relatively larger downward I-V curvature in lower conductance cells at lower frequencies compared with higher input conductance cells, which have larger downward I-V curvature at higher frequencies.
Whole cell capacitance.
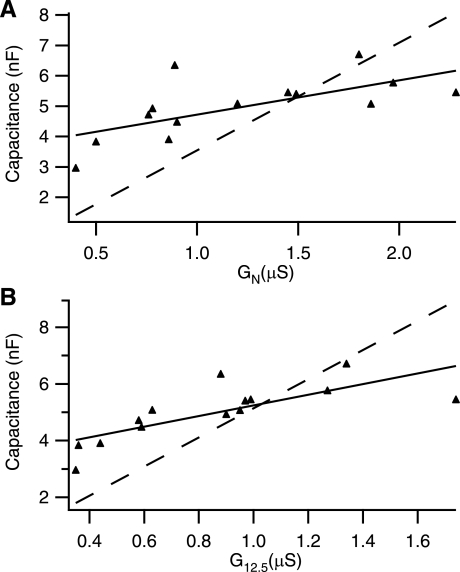
Ideally, susceptance, B, is directly related to capacitance as noted in the analysis of the model results. However, as noted previously, susceptance was better fit by B0 + C*2πf in part because of the noted crosstalk between G and B. However, with the examination of the regressed (least-squares fit to above equation) capacitance, C, in this equation at hyperpolarized voltages a small trend with input conductance can be seen (Fig. 8). At hyperpolarized voltages, C increased with input conductance, as would be expected based on presumed increases in cell size (n = 14, r = 0.67, P < 0.01). However, the increase is much smaller than would be anticipated by scaling input conductance (Fig. 8A). This is consistent with previous findings (see discussion) and with measures of G at 12.5 and 125 Hz (Fig. 6). When measures of C versus G at 12.5 are compared, it is apparent that there is a curvature in C with respect to G (Fig. 8B). This would imply that either G or C, or both, is being regulated rather than being solely a function of cell size (see discussion). With depolarization, the measured C actually increases by about 10% but does not appear to be a function of input conductance (not shown). Consequently, it would appear the reductions in susceptance seen with depolarization affect the offset, B0, rather than the capacitance, C. This is, again, consistent crosstalk of G into measures of B.
Fig. 8.
Whole cell capacitances vs. input conductance. A: comparison of measured C vs. GN. Solid line is regression of data; dotted line is regression with intercept of 0 (if C scaled in GN). B: comparison of measured C vs. G12.5. Lines are the same as A. It is apparent in both A and B, but more so in B, that C curves with respect to measures of G.
DISCUSSION
The response of a motoneuron to a given input is dependent upon its assortment and distribution of voltage-gated ion channels and their kinetics. In this study, we have systematically measured the response of the admittance, which can be thought of as a dynamic input conductance across a range of input frequencies at a subset of membrane holding potentials. Our primary findings are that: 1) conductance (C) and susceptance (B) vary with frequency and have a negative peak at relatively high frequencies; 2) the net active conductance is negative with a peak that increases in both magnitude and frequency as holding potential increases; and 3) the conductance varies as a function of input conductance across the motor pool as a function of cell size, whereas the susceptance does not. The following discussion explores the ramifications of these observations and their relationship to previous findings.
Differential dynamic response across the motor pool.
The observations presented here indicate that motoneurons respond to dynamic inputs in a complex manner that varies across the motor pool. Higher input conductance cells (i.e., type FF) have more downward I-V curvature (ΔG/ΔV) at higher frequencies. This would likely translate into preferentially responding to the higher frequency/more transient components of input. This favored response is achieved by utilizing active conductances to preferentially reduce conductance at higher frequencies. In contrast, lower input conductance, type S cells would likely preferentially respond to lower frequency/more steady input components due to a preferential reduction in their input conductance at lower frequencies. Given that reducing cell conductance effectively increases the impact of synaptic inputs, these results may indicate that motoneurons selectively amplify their inputs. As such, high input conductance cells amplify transients relatively more than low input conductance cells. In our previous work, we examined amplification of fast synaptic (oscillations due to a 180-Hz tendon vibration) and slow synaptic (response to a slow stretch) inputs (Jones and Lee 2006; Lee and Heckman 2000). Re-examination of that data in light of the results of this work does appear to show a negative relationship between fast and slow synaptic amplification at threshold voltages as would be expected if there were selective amplification as described above. However, additional work is needed to confirm this finding.
The work presented here also suggests that the dynamics of motoneuron input processing are not because of, but rather, despite their passive properties. In fact, active conductances essentially cancel the passive input conductance to the point that it becomes negative at some frequencies. Inputs at these frequencies would be amplified, not attenuated. From previous work, we were aware that this occurred at 125 Hz (Lee and Heckman 2001) and at steady state (Lee and Heckman 1998). What we show here is the varied manipulation of this effect across motoneurons, implying that motoneurons are actively sculpting their input to suit the output characteristics of the motoneuron and its corresponding muscle fibers. Thus, low input conductance cells, which innervate fatigue-resistant, slow twitch muscle fibers, may actively accentuate slow inputs. In contrast, high input conductance motoneurons, which innervate rapidly fatiguing, fast twitch muscle fibers, may actively accentuate transient input. However, high input conductance motoneurons would not actively accentuate the slower/steady inputs that would only fatigue innervated fibers.
The variation in input processing shown here appears, at first glance, to be similar to that seen in cortical neurons in that processing ranges from integration to differentiation/coincidence detection. However, in cortical neurons, background synaptic input shifts processing from integration to coincidence detection by increasing input conductance within individual neurons (Prescott et al. 2006; Rudolph and Destexhe 2003). In contrast, the phenomenon observed here is across a population of motoneurons with no within-cell shifting due to input level. Consequently, although active manipulation of input processing is likely to be a widespread neuronal strategy, we contend that the observations shown here represent a separate neuronal behavior.
Assessing motoneuron input dynamics.
In our previous work, we utilized a small amplitude sinusoid (125 Hz) superimposed on a slowly rising and falling voltage ramp to assess conductances as a function of voltage (Lee and Heckman 2001). This protocol was chosen since it provided maximal voltage-dependent information. Based on a cursory examination of frequencies (25, 75, 125, and 200 Hz), 125 Hz was originally chosen, where it appeared that the 125-Hz protocols seemed to result in larger measures of active inward currents. In contrast, the method presented here assesses a range of frequencies at a single voltage. Consequently, the two methods intersect at 125 Hz and the holding potential for the chirp. Examination of this intersection reveals that the constant voltage/changing frequency (i.e., chirp) protocol more closely matches the descending leg of the constant frequency/changing voltage (i.e., 125 Hz) protocol due to the inactivation from prolonged depolarization that the chirp protocol requires. Furthermore, both the modeling and experimental results indicate that the peak frequency of active conductances varies across motoneurons and with voltage. Nonetheless, our original choice of 125 Hz appears to be a reasonable a priori estimate of this peak frequency. Given the inherent difficulties in making these measurements experimentally, it is unreasonable to attempt to perform chirp protocols followed by ramp + sine protocols. Consequently, we conclude that a good, compact protocol is ramp + 125 Hz + 12.5 Hz sinewaves. We examined this protocol in two cells (not shown), and it appeared to work well, capturing low and high frequency responses across a range of voltages.
Effect of neuromodulation.
Although we did not directly examine neuromodulatory effects in this study, comparison with previous work does provide some illumination of the effect of neuromodulation on the results observed here. In a series of studies Baldissera and colleagues injected current ramps of various rates of rise as well as current sinusoids during current clamp conditions into lumbar motoneurons of the anesthetized cat (Baldissera et al. 1984; Baldissera et al. 1987; Baldissera et al. 1982). It is clear from that work that dynamic input in the anesthetized preparation (i.e., with minimal neuromodulatory influence) was relatively higher in type S motoneurons; that is, they found a result that is the opposite of what we predict. Although there are many differences between protocols, we believe that the key difference is the presence of descending monoaminergic input to motoneurons in the decerebrate preparation used here. These monoamines have been shown to generate negative current-voltage slope regions (i.e., a negative input conductance at DC/steady state), particularly in lower input conductance cells (Lee and Heckman 1999). Monoamines also result in synaptic amplification that is relatively larger and with a lower onset voltage under steady-state conditions (Lee and Heckman 2000). Combining these observations with the data presented here leads to the proposition that lower input conductance cells switch from favoring differentiation of input to favoring integration of input as neuromodulatory input increases. Conversely, higher input conductance cells increase their propensity for differentiation with increased neuromodulatory drive.
Resonant versus peak frequency.
Manuel and colleagues assessed resonance and resonant frequencies with respect to impedance magnitude (Manuel et al. 2009). In contrast, we have focused on conductance (i.e., the real component) and have assessed the peak frequency of activation. These measures are related and measure different aspects of the dynamic response of motoneurons. Resonance, and its corresponding frequency, includes active and passive conductance as well as capacitance; it best assesses functional observations such as subthreshold oscillations in membrane voltage. In contrast, peak frequency of activation focuses on the properties of active conductances themselves, including kinetics and possible location, and seems to tie in more with spike initiation. As for the dramatic difference in frequencies between the two assessments, resonance with included capacitance and the generally lower voltages would both tend to lower responses at higher frequencies as has been observed. Taken together, we would expect a motoneuron to exhibit heightened noise/oscillations at subthreshold membrane potentials in the vicinity of the resonant frequency. However, actual spike initiation would occur when the conductance at the peak frequency first reaches zero.
Identification of active conductances.
Since this study attempts to characterize the effect of active conductance en masse, it provides only indirect evidence for the identity of those conductances. The faster negative conductance observations are consistent with fast sodium channels but do not explicitly rule out fast Ca++ channels, as has been observed in vitro (Helton et al. 2005). Additionally, at lower frequencies, the delineation of individual currents becomes more problematic as progressively more voltage-dependant currents have activation kinetics capable of responding to the individual oscillations. This is compounded by the potential for unknown currents and an uncharacterized morphology of the neuron. Thus analyses such as those done by Saint Mleux and Moore (2000) are, unfortunately, not possible. Consequently, we are left with only being able to say that the observations are consistent with the conductances implemented in the computer model.
Capacitance.
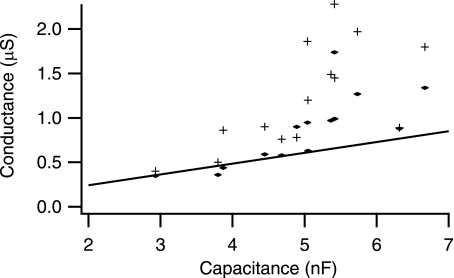
The results of this study reveal that the susceptance component of the frequency response (analogous to the capacitance) does not vary across the motor pool. Instead, susceptance (Fig. 6B) and capacitance (Fig. 8) appear to be remarkably constant across the motor pool. At first this result seems counterintuitive given the assumption that input conductance is a measure of cell size (i.e., membrane area). However, similar findings for susceptance have been shown for the hair cells of the ear (Cunningham and Porter 1975; Margolis and Popelka 1975). Such measures are consistent with indirect measures of capacitance in motoneurons wherein the cell time constant decreases with input conductance rather than remaining constant (Burke et al. 1982; Fleshman et al. 1988). These results imply that G, B, or both are regulated properties and are not simply a function of cell size. Since it is easier to conceive of altering G with leak conductances (i.e., voltage independent ionic channels, as well as ionic transporters in which rates are influenced by voltage) rather than altering C, a good assumption might be that C reflects cell size. Assuming this, it would appear that larger cells contain much more of these leak conductances (Fig. 9).
Fig. 9.
Conductance vs. capacitance. Same data as Fig. 8 are shown. Assuming C as a measure of cell size and that G can only be added to and not reduced, it can be seen that larger cells possess nearly twice as much leak as predicted. +Measures of GN (♦) indicate measures of G12.5.
Functional implications.
An interesting proposition put forth by Baldissera and colleagues (Baldissera et al. 1987) was that the higher dynamic gain in low input conductance cells partially offsets the larger low-pass filtering nature of slower twitch muscle fibers. What, then, would be the purpose of reversing this relationship in more excitable states? One possibility would be to alter the recruitment threshold across the motor pool. At moderate baseline input levels, the lowest input conductance cells would likely be firing tonically with a negative current threshold but be relatively insensitive to transients. In contrast, the steady firing threshold of the highest input conductance cells would remain largely unchanged, but their sensitivity to transients would be heightened. This would result in a slight expansion of recruitment thresholds for steady inputs and a contraction of recruitment thresholds for sharp transients. Combined with synaptic amplification, this in turn might result in rate modulation of force dominating for steady inputs but recruitment modulation dominating for transients. At higher baseline input levels, lower input conductance units already firing at high rates would functionally ignore input transients. However, the same input transients could cause the insertion of one or a few spikes into the firing of higher input conductance units.
Protocol limitations.
Two aspects of this chirp protocol that appear to fundamentally limit its usefulness are the apparent crosstalk between G and B and the inactivation resulting from prolonged depolarization. Taken in reverse order, inactivation is of course a chronic and thorny problem in electrophysiology, but it can be assessed with proper protocols. We suggest that the observed inactivation be directly examined so that our understanding of this phenomenon can be included in motoneuron theories.
Our assessment of the crosstalk issue indicates that it introduced an offset in B and added curvature with frequency in G. Unfortunately, we found no verifiable method to remove the crosstalk. However, it was possible to assess the magnitude of the issue. In B, the offset as frequency went to zero was an indicator of the crosstalk of G into B since B should be zero at zero frequency. Offsets did not correlate with any other measures and averaged 0.25 ± 0.14 μS. Assessing the crosstalk in G from B was not as simple, since G was expected to increase somewhat with frequency. However, as shown in Figs. 8 and 9, capacitance was a weaker function of input conductance than G so the crosstalk should not have distorted any of the observed relationships.
GRANTS
Financial support was provided by National Institute of Neurological Disorders and Stroke Grant NS062200.
DISCLOSURES
No conflicts of interest, financial or otherwise, are declared by the author(s).
REFERENCES
- Alaburda A, Perrier JF, Hounsgaard J. Mechanisms causing plateau potentials in spinal motoneurones. Adv Exp Med Biol 508: 219–226, 2002 [DOI] [PubMed] [Google Scholar]
- Baldissera F, Campadelli P, Piccinelli L. The dynamic response of cat alpha-motoneurones investigated by intracellular injection of sinusoidal currents. Exp Brain Res 54: 275–282, 1984 [DOI] [PubMed] [Google Scholar]
- Baldissera F, Campadelli P, Piccinelli L. The dynamic response of cat gastrocnemius motor units investigated by ramp-current injection into their motoneurones. J Physiol 387: 317–330, 1987 [DOI] [PMC free article] [PubMed] [Google Scholar]
- Baldissera F, Campadelli P, Piccinelli L. Neural encoding of input transients investigated by intracellular injection of ramp currents in cat alpha-motoneurones. J Physiol 328: 73–86, 1982 [DOI] [PMC free article] [PubMed] [Google Scholar]
- Barrett JN, Crill WE. Voltage clamp of cat motoneurone somata: properties of the fast inward current. J Physiol 304: 231–249, 1980 [DOI] [PMC free article] [PubMed] [Google Scholar]
- Burke RE, Dum RP, Fleshman JW, Glenn LL, Lev-Tov A, O'Donovan MJ, Pinter MJ. A HRP study of the relation between cell size and motor unit type in cat ankle extensor motoneurons. J Comp Neurol 209: 17–28, 1982 [DOI] [PubMed] [Google Scholar]
- Cunningham DR, Porter TA. Susceptance and conductance changes in acoustic reflexometry. J Am Audiol Soc 1: 131–134, 1975 [PubMed] [Google Scholar]
- Fleshman JW, Segev I, Burke RB. Electrotonic architecture of type-identified alpha-motoneurons in the cat spinal cord. J Neurophysiol 60: 60–85, 1988 [DOI] [PubMed] [Google Scholar]
- Harris-Warrick RM. Voltage-sensitive ion channels in rhythmic motor systems. Curr Opin Neurobiol 12: 646–651, 2002 [DOI] [PubMed] [Google Scholar]
- Heckman CJ, Mottram C, Quinlan K, Theiss R, Schuster J. Motoneuron excitability: the importance of neuromodulatory inputs. Clin Neurophysiol 120: 2040–2054, 2009 [DOI] [PMC free article] [PubMed] [Google Scholar]
- Helton TD, Xu W, Lipscombe D. Neuronal L-type calcium channels open quickly and are inhibited slowly. J Neurosci 25: 10247–10251, 2005 [DOI] [PMC free article] [PubMed] [Google Scholar]
- Hounsgaard J, Kiehn O. Ca++ dependent bistability induced by serotonin in spinal motoneurons. Exp Brain Res 57: 422–425, 1985 [DOI] [PubMed] [Google Scholar]
- Jones SM, Lee RH. Fast amplification of dynamic synaptic inputs in spinal motoneurons in vivo. J Neurophysiol 96: 2200–2206, 2006 [DOI] [PubMed] [Google Scholar]
- Lee RH, Heckman CJ. Adjustable amplification of synaptic input in the dendrites of spinal motoneurons in vivo. J Neurosci 20: 6734–6740, 2000 [DOI] [PMC free article] [PubMed] [Google Scholar]
- Lee RH, Heckman CJ. Bistability in spinal motoneurons in vivo: systematic variations in persistent inward currents. J Neurophysiol 80: 583–593, 1998 [DOI] [PubMed] [Google Scholar]
- Lee RH, Heckman CJ. Enhancement of bistability in spinal motoneurons in vivo by the noradrenergic alpha1 agonist methoxamine. J Neurophysiol 81: 2164–2174, 1999 [DOI] [PubMed] [Google Scholar]
- Lee RH, Heckman CJ. Essential role of a fast persistent inward current in action potential initiation and control of rhythmic firing. J Neurophysiol 85: 472–475, 2001 [DOI] [PubMed] [Google Scholar]
- Li X, Bennett DJ. Apamin-sensitive calcium-activated potassium currents (SK) are activated by persistent calcium currents in rat motoneurons. J Neurophysiol 97: 3314–3330, 2007 [DOI] [PMC free article] [PubMed] [Google Scholar]
- Manuel M, Iglesias C, Donnet M, Leroy F, Heckman CJ, Zytnicki D. Fast kinetics, high-frequency oscillations, and subprimary firing range in adult mouse spinal motoneurons. J Neurosci 29: 11246–11256, 2009 [DOI] [PMC free article] [PubMed] [Google Scholar]
- Manuel M, Meunier C, Donnet M, Zytnicki D. Resonant or not, two amplification modes of proprioceptive inputs by persistent inward currents in spinal motoneurons. J Neurosci 27: 12977–12988, 2007 [DOI] [PMC free article] [PubMed] [Google Scholar]
- Margolis RH, Popelka GR. Loudness and the acoustic reflex. J Acoust Soc Am 58: 1330–1332, 1975 [DOI] [PubMed] [Google Scholar]
- Powers RK, Binder MD. Persistent sodium and calcium currents in rat hypoglossal motoneurons. J Neurophysiol 89: 615–624, 2003 [DOI] [PubMed] [Google Scholar]
- Prescott SA, Ratte S, De Koninck Y, Sejnowski TJ. Nonlinear interaction between shunting and adaptation controls a switch between integration and coincidence detection in pyramidal neurons. J Neurosci 26: 9084–9097, 2006 [DOI] [PMC free article] [PubMed] [Google Scholar]
- Rall W. Distinguishing theoretical synaptic potentials computed for different soma-dendritic distributions of synaptic input. J Neurophysiol 30: 1138–1168, 1967 [DOI] [PubMed] [Google Scholar]
- Rudolph M, Destexhe A. Tuning neocortical pyramidal neurons between integrators and coincidence detectors. J Comput Neurosci 14: 239–251, 2003 [DOI] [PubMed] [Google Scholar]
- Saint Mleux B, Moore LE. Active dendritic membrane properties of Xenopus larval spinal neurons analyzed with a whole cell soma voltage clamp. J Neurophysiol 83: 1381–1393, 2000 [DOI] [PubMed] [Google Scholar]
- Schwindt PC, Crill WE. Properties of a persistent inward current in normal and TEA-injected motoneurons. J Neurophysiol 43: 1700–1724, 1980 [DOI] [PubMed] [Google Scholar]
- Sekerli M, DelNegro C, Lee RH, Butera RJ. Estimating action potential thresholds from neuronal time-series: new metrics and evaluation of methodologies. IEEE Trans Biomed Eng 51: 1665–1672, 2004 [DOI] [PubMed] [Google Scholar]
- Shapiro NP, Lee RH. Synaptic amplification versus bistablility in motoneuron dendritic processing: a top-down modeling approach. J Neurophysiol 97: 3948–3960, 2007 [DOI] [PubMed] [Google Scholar]
- Umemiya M, Berger AJ. Properties and function of low- and high-voltage-activated Ca2+ channels in hypoglossal motoneurons. J Neurol 14: 5652–5660, 1994 [DOI] [PMC free article] [PubMed] [Google Scholar]


