Abstract
Recently, we developed a reflection-mode relaxation photoacoustic microscope, based on saturation intensity, to measure picosecond relaxation times using a nanosecond laser. Here, using the different relaxation times of oxygenated and deoxygenated hemoglobin molecules, both possessing extremely low fluorescence quantum yields, the oxygen saturation was quantified in vivo with single-wavelength photoacoustic microscopy. All previous functional photoacoustic microscopy measurements required imaging with multiple laser-wavelength measurements to quantify oxygen saturation. Eliminating the need for multi-wavelength measurements removes the influence of spectral properties on oxygenation calculations and improves the portability and cost-effectiveness of functional or molecular photoacoustic microscopy.
Photoacoustic (PA) microscopy provides effective functional and molecular imaging in vivo. Because the PA signal is proportional to the deposited optical energy, which in turn is proportional to the local optical absorption coefficient, multi-wavelength photoacoustic measurements provide quantitative information about the concentrations of multiple chromophores, such as oxygenated and deoxygenated hemoglobin molecules in red blood cells. Thus, the relative concentration and the oxygen saturation (sO2) of hemoglobin can be extracted [1-3]. Functional or molecular photoacoustic imaging of brain activation [2], tumor hemodynamics [4], gene expression [5] and other pathophysiological phenomena has been previously achieved. However, multi-wavelength photoacoustic measurements typically require an expensive and bulky tunable laser, undesirable in non-lab environments. Moreover, the spectral dependence of the local optical fluence, and hence the photoacoustic signal, combined with the unknown spectral properties of the surrounding tissue presents challenges to accurate sO2 measurements [6]. All prior quantitative functional photoacoustic studies have assumed a linear dependence between the photoacoustic signal and the local optical fluence, which holds only at laser intensities much less than the saturation intensity. As the intensity increases, mechanisms such as multi-photon or multi-step absorption or saturation of the optical absorption can occur, resulting in a nonlinear dependence of the photoacoustic signal on the excitation pulse fluence [7,8]. Recently, we developed a relaxation photoacoustic microscope (rPAM), based on saturation intensity, to measure picosecond absorption relaxation times (i.e., the time required for an excited molecule to relax to the ground state after light absorption) using a nanosecond laser [9]. We measured the absorption relaxation times of bovine oxyhemoglobin (HbO2) and deoxyhemoglobin (HbR) in vitro at 576 nm, the local absorption peak of HbO2, to be 22±5 ps and 2.3±1.8 ps, respectively [9]. In our present work, the different relaxation times of oxygenated and deoxygenated hemoglobin molecules at 576 nm enabled us to quantify the relative concentrations of both molecules in vivo from the saturation profiles of PA signals. Thus, the oxygen saturation was measured by rPAM using a single optical wavelength, whereas all previous studies required multiple wavelengths [1-4].
In an absorbing medium, the photoacoustic signal, q, generated by single photon absorption is proportional to the local pressure rise [10]:
| (1) |
where K is a proportionality coefficient related to the ultrasonic parameters, the Grueneisen parameter, and the heat conversion efficiency, μa is the optical absorption coefficient (cm−1 ), and F is the local optical fluence (J/cm2). The local optical fluence can also be written as F = I · τlaser, where I is the local laser intensity (W/cm2) and τlaser is the laser pulse width (e.g., 4 ns). The absorption coefficient of blood can be expressed as [10]
| (2) |
where σHbR and σHbO2 are the absorption cross sections of HbR and HbO2 at a specific wavelength. NHbR and NHbO2 are the numbers of HbR and HbO2 absorbers, respectively, per unit volume. In the saturation regime, the PA signal can be expressed as [9]
| (3) |
where and are the saturation intensities of HbR and HbO2. Therefore, the relative concentration of oxyhemoglobin and deoxyhemoglobin can be extracted using a single wavelength simply by measuring the PA signal at different laser intensities. A linear least-squares estimation gives
| (4) |
where
| (5) |
In equation (4), y is the PA measurements vector, in which each line corresponds to a different incident laser intensity. For each incident laser intensity, the blood vessel map was segmented, and the PA signal was averaged over a maximum contiguous region of 10 pixels × 10 pixels within the segmented vessel. Points within the 10 × 10 box but outside the segment were not included in the average. The extracted concentrations of HbO2 and HbR molecules from each pixel were averaged within each segment before being used to calculate sO2. The sO2 was calculated as
| (6) |
where ⟨ ⟩ denotes averaging. The local fluence, Fi, was estimated using the local pulse energy, Ei, and the Gaussian beam radius at the corresponding depth, w: Fi = Ei/(π · w2). As the current rPAM—based on an optical-resolution photoacoustic microscope (OR-PAM) described previously [9]—works in the quasi-ballistic regime, the local pulse energy, Ei, is calculated using the incident energy on the skin surface, E0; the depth of the absorber, z; and the average attenuation in the tissue, α, such that Ei = E0 · e−α·z. The average attenuation in the tissue can be extracted, assuming that at low intensity the averaged PA signal generated from a vessel at a given depth is proportional to the local fluence. The local pulse energy was estimated by averaging the PA signal over 10 × 10 contiguous points at three depths in the same blood vessel and multiplying it by the average beam cross section at the corresponding depth.
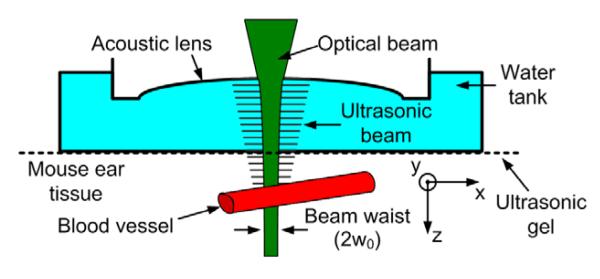
In order to extract sO2 using a single wavelength, the ear of a Swiss-Webster mouse (25-30 g, Harlan) was imaged in vivo. We measured the PA signal as a function of the incident laser fluence, using the rPAM system [9]. The 4-ns width laser pulses were focused to a spot with a diameter of 3.9 μm, approximately 120 μm below the skin surface. A variable attenuator set the pulse energy to values between 0 and 195 nJ. The mouse ear was acoustically coupled to the bottom membrane of a water tank by ultrasonic gel (see Fig. 1). During image acquisition, the mouse was supplied with breathing-grade air and maintained under anesthesia using vaporized isoflurane (1.0-1.5% isoflurane with an airflow rate of 1 L/min). We imaged the same area of the mouse ear at four different intensities. At each point (A-line), we extracted the PA amplitudes (maximum absolute value of the Hilbert-transform of the raw PA signal) and the Gaussian beam radius at the corresponding depth; then, we averaged over 10 × 10 contiguous points, where each point represents a step size of 2.5 μm.
Fig. 1.
Ultrasonic and optical beam coupling diagram
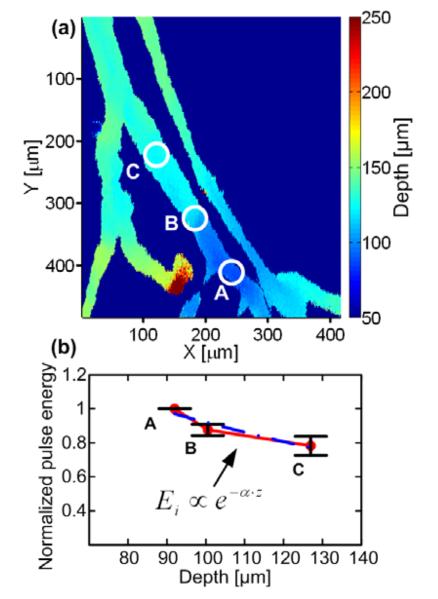
The incident energy on the skin surface, E0, was extracted from the photodiode readout, which had previously been calibrated over a wide range of energy levels. The depth of the blood vessels, z, was extracted using the delay time of the PA amplitude (see Fig. 2a). Figure 2b presents the normalized local pulse energy at three different depths along the same vessel and the exponential fitting curve. The average attenuation, α, was calculated to be 62±20 cm−1. The standard error of the mean value was calculated using three different incident intensities (N=3).
Fig. 2. Extraction of the average attenuation in tissue.
(a) Depth map of a mouse ear (b) the exponential fitting (blue dashed line) and the normalized pulse energy as a function of depth (solid red dots). The error bars represents the standard error of the mean value at three incident intensities (N=3)
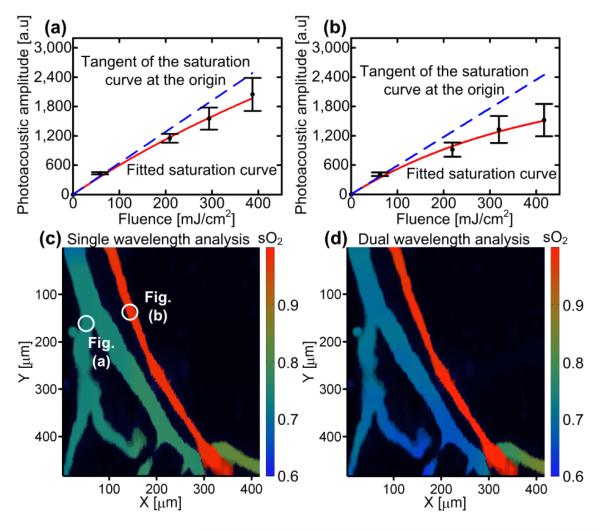
Figures 3a and 3b present the average PA amplitudes as a function of the fluence at a low sO2 location (a vein) and at a high sO2 location (an artery). At a high sO2 location, the PA signal was saturated more than at a low sO2 location, because oxyhemoglobin has a longer absorption relaxation time at 576 nm than deoxyhemoglobin. The extracted concentrations of HbO2 and HbR molecules of each pixel were averaged within the segments and then used to calculate sO2. Figure 3c presents the sO2 maps of a mouse ear using a single-wavelength (576 nm) analysis. The average sO2 values in the artery and the vein were measured to be 94±2 and 74±3, respectively. To verify our results, dual-wavelength in vivo functional photoacoustic microscopy was performed at 576 nm and 592 nm wavelengths using the OR-PAM, as described previously [11]. Figure 3d presents the sO2 map of a mouse ear using dual-wavelength (576 and 592 nm) analysis. The average sO2 in the artery and in the vein were measured to be 96±3 and 69±3, respectively. The measurements from the single-wavelength and dual-wavelength analyses agree with p-values of less than 5% for both arterial and venous sO2.
Fig. 3. Saturation profiles of photoacoustic signals and sO2 mapping in a mouse ear.
Average photoacoustic amplitude as a function of the fluence (a) at a low sO2 location (a vein) and (b) at a high sO2 location (an artery). Error bars represent the standard deviations in 15 adjacent measurements. sO2 mapping using (c) single-wavelength (576 nm) and (d) dual-wavelength (576 and 592 nm) measurements.
To reach the saturation regime using the rPAM, we had to use high laser intensities. However, since the optical beam is focused inside the tissue, the actual beam diameter at the skin surface was larger, and therefore the incident fluence was lower than that at the focus. The maximum fluence at the skin surface was calculated to be 80 mJ/cm2, which did not cause any observable damage to the mouse skin. To avoid exceeding the ANSI safety limit for fluence on the skin surface (20 mJ/cm2), shorter laser pulses with lower energy can be used. Thus, the pulse intensity will still reach the saturation intensity level while the incident fluence at the skin surface will be reduced. Moreover, reduction of the incident fluence decreases temperature-dependent nonlinearity of the Grueneisen parameter, which may have contributed to the measurement error.
In conclusion, we have measured oxygen saturation in vivo using a single nanosecond laser on the basis of optical absorption saturation in reflection-mode photoacoustic microscopy. Unlike conventional photoacoustic imaging, rPAM uses a single laser wavelength to extract the relative concentrations of mixed multiple absorbers possessing different saturation intensities. We employed this principle to perform functional photoacoustic microscopy in vivo, thereby eliminating the expense, space, and wavelength-tuning time required for a tunable laser. Here, the principle of optical absorption saturation in photoacoustic imaging was applied at shallow depths. However, it could be applied to deep imaging using highly saturable contrast agents and short laser pulses (for higher intensity). A current limitation of the technique includes the large delay time between scans, which prevents intensity-varied measurements of the same red blood cell and allows displacement of the tissue between images. Measurement accuracy may be increased if the local relaxation time is measured within a short period of time. For instance, by varying the pulse energy of a compact 532-nm 100-kHz laser, the relaxation time can be extracted within 50 μs. Because single-wavelength lasers can be highly compact and inexpensive, rPAM may be incorporated into smart-phone-based ultrasound devices for portable imaging [12]. Therefore, rPAM can potentially accelerate the translation of PAM from microscopic lab discoveries to macroscopic clinical practice.
Acknowledgments
The authors thank Junjie Yao for his help in extracting sO2 information using the dual-wavelength analysis. This work was sponsored in part by National Institutes of Health grants R01 EB000712, R01 EB008085, R01 CA134539, U54 CA136398, and 5P60 DK02057933.
Footnotes
L.W. has a financial interest in Microphotoacoustics, Inc. and Endra, Inc., which, however, did not support this work.
References
- 1.Laufer JG, Delpy D, Elwell C, Beard PC. Phys. Med. Biol. 2007;52:141–168. doi: 10.1088/0031-9155/52/1/010. [DOI] [PubMed] [Google Scholar]
- 2.Wang X, Xie X, Ku G, Wang LV. J. Biomed. Opt. 2006;11:024015. doi: 10.1117/1.2192804. [DOI] [PubMed] [Google Scholar]
- 3.Zhang HF, Maslov K, Stoica G, Wang LV. Nat. Biotechnol. 2006;24:848–851. doi: 10.1038/nbt1220. [DOI] [PubMed] [Google Scholar]
- 4.Kim C, Favazza C, Wang LV. Chem. Rev. 2010;110:2756–2782. doi: 10.1021/cr900266s. [DOI] [PMC free article] [PubMed] [Google Scholar]
- 5.Razansky D, Distel M, Vinegoni C, Ma R, Perrimon N, Koster RW, Ntziachristos V. Nat. Photonics. 2009;3:412–417. [Google Scholar]
- 6.Maslov K, Zhang HF, Wang LV. Inverse Probl. 2007;23:S113–S122. [Google Scholar]
- 7.Bonch-Bruevich AM, Razumova TK, Starobogatov IO. Opt. Spectrosc. 1977;42:82–87. [Google Scholar]
- 8.Tam C, Patel CKN. Nature. 1979;280:304–306. [Google Scholar]
- 9.Danielli A, Favazza C, Maslov K, Wang LV. Appl. Phys. Lett. 2010;97:163701. doi: 10.1063/1.3500820. [DOI] [PMC free article] [PubMed] [Google Scholar]
- 10.Wang LV, Wu H. Biomedical Optics – Principles and Imaging. John Wiley & Sons; Hoboken: 2007. [Google Scholar]
- 11.Hu S, Maslov K, Wang LV. Opt. Express. 2009;17:7688–7693. doi: 10.1364/oe.17.007688. [DOI] [PMC free article] [PubMed] [Google Scholar]
- 12.Naditz A. New frontiers: body works. Telemed. J. e-Health. 2010;16:139–144. doi: 10.1089/tmj.2010.9992. [DOI] [PubMed] [Google Scholar]


