Abstract
Steady-state diffuse reflection spectroscopy is a well-studied optical technique that can provide a noninvasive and quantitative method for characterizing the absorption and scattering properties of biological tissues. Here, we compare three fiber-based diffuse reflection spectroscopy systems that were assembled to create a light-weight, portable, and robust optical spectrometer that could be easily translated for repeated and reliable use in mobile settings. The three systems were built using a broadband light source and a compact, commercially available spectrograph. We tested two different light sources and two spectrographs (manufactured by two different vendors). The assembled systems were characterized by their signal-to-noise ratios, the source-intensity drifts, and detector linearity. We quantified the performance of these instruments in extracting optical properties from diffuse reflectance spectra in tissue-mimicking liquid phantoms with well-controlled optical absorption and scattering coefficients. We show that all assembled systems were able to extract the optical absorption and scattering properties with errors less than 10%, while providing greater than ten-fold decrease in footprint and cost (relative to a previously well-characterized and widely used commercial system). Finally, we demonstrate the use of these small systems to measure optical biomarkers in vivo in a small-animal model cancer therapy study. We show that optical measurements from the simple portable system provide estimates of tumor oxygen saturation similar to those detected using the commercial system in murine tumor models of head and neck cancer.
Index Headings: Optical spectroscopy, Diffuse reflection spectroscopy, DRS, Inverse Monte Carlo, Quantitative physiology, Tissue phantoms, Murine tumors, Spectrometers, Cancer
INTRODUCTION
Steady-state diffuse reflection spectroscopy (DRS) is a technique that can be used to noninvasively and quantitatively determine the optical absorption and scattering properties of a turbid medium, which in turn can provide important functional and/or structural parameters relevant to the interrogated target. Experimentally, steady-state DRS are measured by coupling a broadband light source to a medium of interest using a fiber-optical conduit and detecting the remitted signal from the surface using another optical fiber that is fed into a spectrometer.1 The detected signal is sensitive to the distribution of the optical properties of the medium that lie enclosed in a volume between the source and detection fibers. It has been shown previously that the overall depth sampled by the detected signal depends both on the source–detector fiber-probe geometry and on the optical properties of the medium itself.2–6
The DRS technique has been used to noninvasively characterize human and animal tissues, plant matter, soil quality, and various other materials in fields as diverse as veterinary medicine, agriculture, and earth and material sciences.7,8 Given the nondestructive nature of this technique along with its ability to quantify optical absorption, which in turn can directly be related to the concentration and the oxygen carrying status of blood, this method has been widely exploited in several applications related to diagnosis, prognosis, and assessing treatment response of cancers.9 Many reports have been published over the last two decades describing the use of DRS in vivo to provide a noninvasive “optical biopsy” of many different organ sites including the breast, esophagus, bronchus, brain, pancreas, GI tract, and cervix to characterize pre-cancers and cancers in these tissues.9–18
Traditionally, optical instrumentation used in clinical studies of diffuse reflection spectroscopy has been expensive and/or bulky either due to the complex detection technologies for data collection, processing, and throughput, or due to the high-power arc-lamps or laser sources used, or both.19–22 With the advent of fundamental and applied advances in solid-state engineering and electronics, it is now possible deliver sufficient optical energy using smaller light sources and detect the measured signals at high speeds using compact optical spectrometers. Although such compact instrumentation has been demonstrated previously to characterize optical properties of normal and cancerous ex vivo tissues and explore the impact of ultrasound pulses on the diffuse reflection of tissues,23,24 these reports have not characterized these small systems and compared their relative merits in extensive and well-controlled laboratory, phantom, and small-animal studies.
The primary focus of this study was to assemble and validate small, portable, and robust optical spectroscopy systems in the visible (400–650 nm) spectral region for quick and routine acquisition of steady-state diffuse reflectance spectra from biological tissues and the analyses of the spectral signals from these different systems for the extraction of tissue optical properties (absorption and scattering coefficients). The constructed systems were characterized to assess system drift, linearity, signal-to-noise ratios, and accuracy in extracting optical properties in tissue-simulating phantoms as well as their ability to extract optical properties from real biological tissues in vivo. The ease of system setup and the smaller footprint of these systems (relative to the bulkier commercial counterparts) are well suited for use within the limited confines of primary care clinics and mobile and/or rural settings.
METHODS
Diffuse Reflection Spectroscopy Instrumentation
The basic scheme for a fiber-optic spectrometer to measure the steady-state diffuse reflectance spectrum from a given medium requires the spectrally resolved measurement of a broadband signal, after the light has propagated through the medium of interest, where the light is coupled to/from the medium using optical fibers (that are kept in contact with the medium). Here, we test three different optical spectroscopy systems in the visible spectral range, each of which is distinct with respect to the combination of light sources and spectrometers used.
Light Sources
Illumination was provided by either a tungsten halogen lamp (HL2000-HP, OceanOptics, Dunedin, FL) or an in-house LED module. The tungsten halogen source had outputs between 400 and 2500 nm and was coupled to the source fiber after filtering it through a short-pass heat-protection filter (KG3, Advanced Optics, Schott North America, Duryea, PA), which limited the wavelength range to between 400 and 800 nm. The lamp used a high-power bulb with 20 W output and required an electrical socket in order to be powered. The LED source was a cold, white, high-power LED (XR-E, Cree, Durham, NC) with outputs between 400 and 700 nm. The LED was coupled to the source optical fiber via a collimating lens (XLamp 7090, Cree, Durham, NC) and a fiber-optic collimator (FOC-010-006-V Mightex, Toronto, ON), which were both aligned in-house. The LED was operated through a current-regulated driver (LuxDrive™ 2008B PowerPuck, Randolph, VT) and was powered using the 5 V supply from the universal serial bus (USB) port available in a laptop PC.
Detectors
The diffusely reflected signal was collected from the turbid medium (phantom or biological medium) using one of the two charge-coupled device (CCD) array-based spectrometers (USB4000, OceanOptics, Dunedin, FL; AvaSpec2048, Avantes, Broomfield, CO). Both spectrometers could be powered using the USB port of the laptop PC, while using the same interface for data transfer and storage between the spectrometer and the PC. The spectrometers were controlled using manufacturer-provided operating software (SpectraSuite, OceanOptics; AvaSoft, Avantes).
Fiber-Optic Probes
The light sources as well as the spectrometers could be connected to SMA-terminated fiber-optic probes. This SMA termination allowed for quick, repeatable, and robust connections of the fiber probe to the light sources (and detectors). For all the results reported here, the source–detector fibers consisted of a bifurcated forward-firing probe that was built in-house. The source and detector fibers each used a single multimode fiber 1 mm in diameter with a numerical aperture (NA) of 0.22 (Polymicro Technologies, Phoenix, AZ). The common end (which interrogated the target), was made of a flat plexiglass surface (5 mm × 3 mm) into which the two fibers were attached (using epoxy) such that they were flush with the plexiglass surface and in contact with the tissue with a fixed source–detector separation of 2.3 mm.
System Tests
The constructed devices were characterized by estimating the drift of the source, detector linearity, and quantifying overall system signal-to-noise ratios (SNR) as described below.
Source Warm-Up and Drift
In order to determine the warm-up times and the intensity drifts for the light sources, diffuse reflectance spectra were measured (for either source) each minute for the first 60 minutes, and then every 5 minutes for the next two hours, from a standard reflectance spectralon standard (Spectralon Reflectance Standard, Labsphere, North Sutton, NH). The warm-up period for the light source was defined as the time elapsed between switching on the light source until the time at which the lamp intensity (at any given wavelength) did not vary by more than 2% of the mean intensity (computed over the final 2-hour period) at that wavelength. Next, the source-intensity drift was computed by dividing the variance of the reflectance signal (at any given wavelength) over the last 2-hour period (after the lamp had already been warmed up).
Detector Linearity and Signal-to-Noise Ratio
The spectrometers used were characterized for detector linearity as well as overall detector SNR. A linear response from the detector implies that the measured output from the detector increases linearly with the detected light intensity. The linearity of the detector was ascertained by sequentially measuring the diffuse reflectance (from a Spectralon reflectance standard) as a function of detector integration time. The integration times used ranged between 5 and 200 ms and 0.1 and 1.5 s for the HL-based and LED-based systems, respectively. It is to be noted, however, that the total acquisition times listed in Table II for these detectors include the time of signal collection (including the detector integration times and electronics), storage, and transfer to disk. These integration times were chosen such that the reflectance signal measured at the lower integration times was above the dark-noise of the system, while the signal at the higher integration times caused near detector saturation at a minimum of one detection wavelength.
TABLE II.
Summary of system features for each optical spectroscopy system tested and a commercial spectrometer system (Skinskan).
| System features | Diffuse reflection systems tested | |||
|---|---|---|---|---|
| SkinSkan (Commercial System) |
System 1: USB+HL |
System 2: USB+LED |
System 3: AVA+HL |
|
| λ range | 200–750 nm | 400–800 nm | 400–750 nm | 400–800 nm |
| λ resolution | 5 nm | 2 nm | 2 nm | 1.5 nm |
| Detector type | PMT | CCD | CCD | CCD |
| Power consumed | 150 W | 20 W | 1.75 W | 20 W |
| Warm-up time | 30 minutes | 5 minutes | < 1 minute | 5 minutes |
| Intensity drift | <0.5% per hour | <0.3% per hour | <0.05% per hour | <0.3% per hour |
| Linear range | 1 × 10⁻⁵ to 40 counts | 1 × 10³–6 × 10⁴ counts | 1 × 10³–6 × 10⁴ counts | 1 × 10³–6 × 10⁴ counts |
| SNR (dB) | 35–55 | 30–60 | 30–60 | 30–60 |
| Acquisition time (s) | 4–15 | 0.1–2 | 0.1–2 | 0.1–2 |
| ~Cost (US$) | $25,000 | $3800 | $2600 | $3200 |
In order to compute the SNR, both the mean and the variance of a measured signal are required for a wide range of signal intensity levels. The SNR was determined by acquiring 15–20 repeated measurements of the diffuse reflectance spectra (from the first phantom in Set 2, described in the next section below) across a range of signal levels. The SNR was then calculated (for each signal level) from the repeated measurements using the formula: SNR(λ) = 20*log10(μλ/σλ) dB; where μλ was the mean reflectance signal (across the repeated measurements of reflectance) at a given wavelength λ, and σλ was the standard deviation in these data, at the same wavelength.
Tissue Phantom Validation Studies
As has been described in detail before,25 the performance of each assembled spectrometer was validated for its ability to extract optical properties of well-controlled, homogeneous, liquid, tissue-mimicking phantoms. These phantoms were prepared by mixing stock human hemoglobin A0 (H0267, Sigma Co., St. Louis, MO) solution of a known concentration, characterized using an optical absorption spectrophotometer (Cary 300, Varian Inc, Walnut Creek, CA) and a monodisperse suspension of 1 µm polystyrene (PS) microspheres in water (07310, Polysciences Inc., Warrington, PA). The expected optical absorption of the liquid phantom was calculated from the volume-fraction of the absorber solution in the phantom and a spectrophotometer absorption measurement, while its expected reduced scattering coefficient was calculated from the volume fraction of PS scattering suspension in the phantom and the size of the polystyrene spheres using Mie theory.26
Three types of phantom sets were tested (see Table I). The first set of phantoms (Set 1) had increasing absorber concentrations and was obtained by performing ten serial additions of the stock hemoglobin (Hb) solution into a solution that had a fixed (initial) volume of scattering sphere suspension. The second set (Set 2) was obtained by performing ten serial additions of a polystyrene suspension into a phantom that had fixed (initial) volume of Hb stock solution. The third set (Set 3) consisted of ten phantoms divided into two sub-groups; each sub-group had a distinct scattering level and contained five different phantoms. The set of five phantoms in each scattering group was obtained by sequential additions of hemoglobin stock solution to the first phantom, which had a fixed (initial) volume of polystyrene suspension. The optical property ranges covered in the phantom studies were chosen because they span a wide range of known tissue optical properties27 as shown in Table I. During the course of the experiments, a single scan of diffuse reflectance was recorded from each phantom in every phantom set. The accuracy of each system’s measurements to extract the optical properties of the measured phantoms was achieved by using a previously developed scalable inverse Monte Carlo model which has been extensively described in the literature.25,26,28
TABLE I.
Summary of phantom sets and corresponding optical properties spanned by each phantom set. The listed optical properties represent the wavelength-averaged value of the optical absorption (scattering) spectra between 450 and 650 nm.
| Phantom set |
Experiment type | Absorption coefficients [cm−1] (or concentration [µM]) |
Scattering coefficients [cm−1] | |||
|---|---|---|---|---|---|---|
| μa range | Mean μa | [Hb] | range | Mean | ||
| Set 1 | Varying μa, fixed | 0.6–4.5 | 2.5 | 7.3–49.9 | 15.7–17.2 | 16.5 |
| Set 2 | Varying , fixed μa | 0.8–1.5 | 1.2 | 9.8–17.7 | 8.3–23.2 | 15.0 |
| Set 3 | Varying μa, lower (fixed) | 0.2–1.4 | 0.8 | 5.9–20.5 | 7.9–8.3 | 8.1 |
| Varying μa, higher (fixed) | 15.7–16.5 | 16.1 | ||||
Briefly, the inverse Monte Carlo method iteratively computes a predicted diffuse reflectance spectrum while repeatedly updating the optical absorption and scattering spectra using a Levenberg–Marquardt least-squares criterion to minimize the error between the predicted diffuse reflectance and the experimentally measured reflectance.25 The optical absorption and scattering coefficients that minimize this sum of squares error are considered to be the extracted parameters for each phantom.
Animal Studies
As a final verification of the performance of these portable systems we compare the outcomes of measurements obtained using one of the assembled systems (System 1; USB + HL) and the commercial Skinskan system, in a pre-clinical study that optically monitored the functional changes in blood oxygenation in vivo, in murine tumor models exposed to curative radiotherapy treatments. The complete study design and the conclusions from the optical measurements obtained using the commercial Skinskan system for this study has been published previously.29 Briefly, thirty-four nude mice were inoculated with FaDu (a human pharyngeal cancer) cells on their flanks. Once the tumors reached an approximate volume of 200 mm3, they were divided into control (N = 11) and treatment (N = 23) groups, where the treated group received a previously determined single TCD50 dose of radiation, while the control animals received sham irradiation. The treatment day was labeled day 0. Optical spectroscopic measurements of diffuse reflectance were obtained from each animal by placing the fiber probe in firm but gentle contact with the tumor on days 0, 1, 3, 5, 7, 10, 12, 14, and 17 (where measurements on day 0 were obtained prior to irradiation, to measure each animal’s baseline readings). Diffuse reflectance spectra were obtained using both System 1 (USB + HL) and the SkinSkan, in a sequential manner, for each animal, at each time-point. For the Skinskan measurements, two consecutive scans of diffuse reflectance were obtained from the same site by placing the probe at a fixed, randomly selected location on the tumor surface. For the measurements with the portable instrument, three scans were recorded from three different randomly selected points on the tumor surface. In these experiments, since the amount of time taken by the commercial instrument (Skinskan) to collect diffuse reflectance was much longer than (~15 s per scan) that required by the smaller system (~0.2 s per scan), we chose to obtain only two scans using the Skinskan relative to the three scans per site, for three sites, using the portable instrument. Analogous to the phantom studies, the measured diffuse reflectance data were inverted using the scalable inverse Monte Carlo model to extract the optical absorption and scattering coefficients. The absorption coefficients were used to compute oxygen saturation and total hemoglobin concentrations as described before.29–31
RESULTS
Diffuse Reflection Spectroscopy Systems
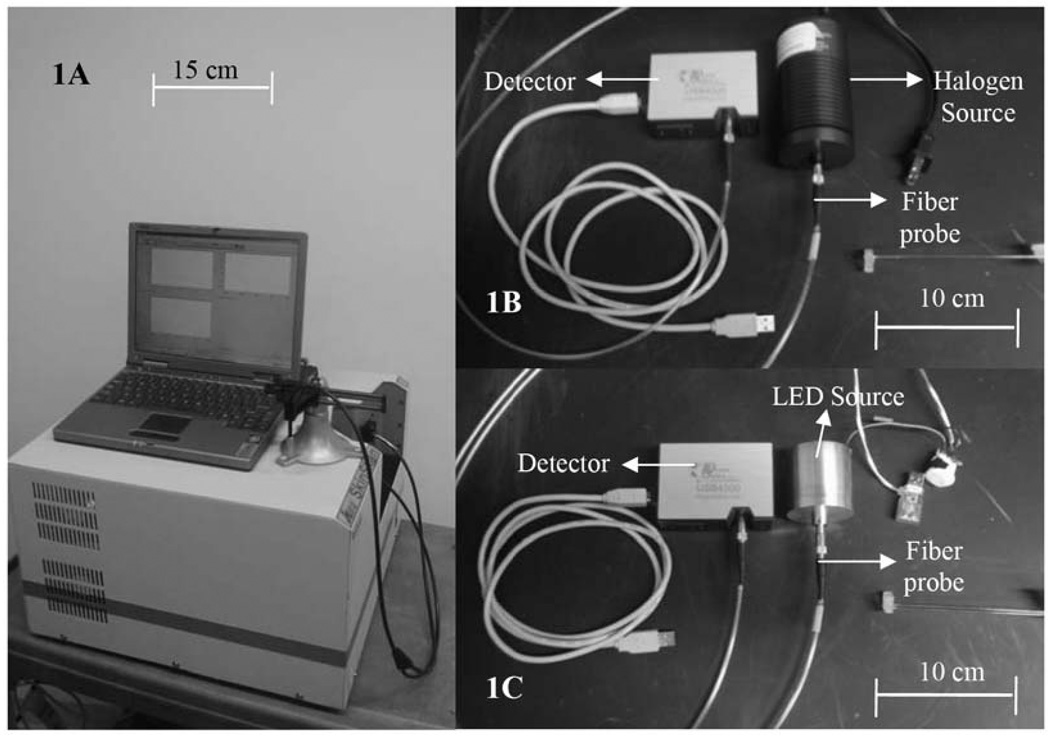
Figure 1 shows side-by-side photographs of a widely used commercial optical-fiber-based spectrometer SkinSkan (JY Horiba, Edison, NJ; Fig. 1A), along with two (of the three) systems designed and developed in our lab (Figs. 1B and 1C). It is evident that there is considerable reduction in the physical footprints of the newly developed systems, relative to that of the commercial system. The third system, comprising the AvaSpec-2048 spectrometer with the HL2000 lamp (not shown), was approximately the same size as that shown in Fig. 1B.
Fig. 1.
Pictures of the (A) SkinSkan (JY Horiba) (B) USB4000+HL2000, and (C) USB4000+LED systems.
Table II provides an overview of the important parameters that characterize the source, detector, and overall system features. The low cost of high-power LEDs, low-power driving circuits, and simplicity of optical focusing make LED-based light sources ideal for diffuse reflection spectroscopy in the visible spectral range.
Source Characterization
Given that changes in source output impact the overall intensity of the diffuse reflectance, we characterized the warm-up time and the intensity drift of the light sources as described in the Methods section. The warm-up times and lamp-intensity drifts, for either source, are listed in Table II. It should be noted that when the source-drift test was conducted on the LED-based system, the light source was powered using the USB port of the laptop PC while keeping the computer powered by its internal battery alone, while the halogen lamp system was powered using a wall AC power socket. Overall, the LED-based system showed the least drift in output, as expected, but all systems had low intensity drifts that were comparable to that measured with the commercial Skinskan system.
Detector Characterization
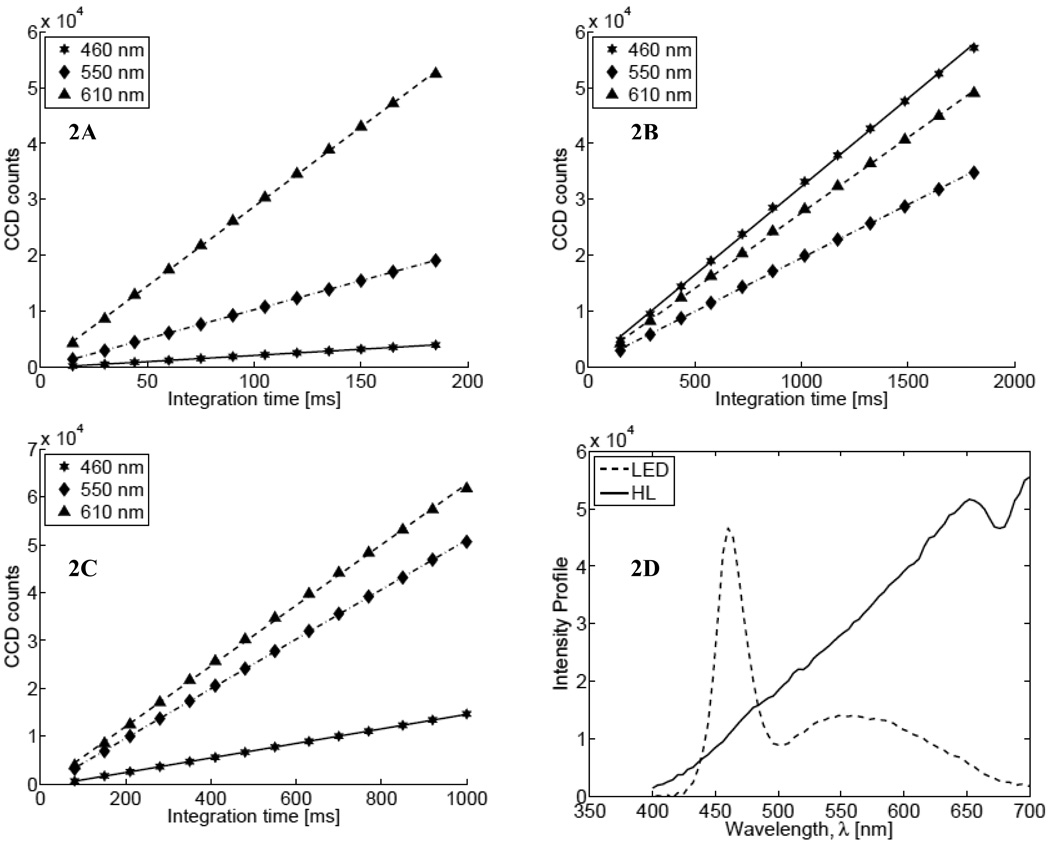
The detectors were characterized by measuring their linearity and SNR as described in the Methods section. Figure 2 shows the measured linearity for the three assembled systems. The LED+AVA combination was not tested because we did not have the LED source built in time to use it with the AvaSpec spectrometer. In each figure, the symbols indicate the measured intensity counts (stars: 460 nm; diamonds: 550 nm; triangles: 610 nm) while the lines show the best linear fits to the data. It is evident that all spectrometers have a linear response over the whole 16-bit dynamic range of the systems. It is interesting to note that the linear responses shown in Fig. 2B (for System 2) have similar slopes for different wavelengths, which indicates relatively uniform output from the LED relative to the halogen source. Figure 2D shows representative spectra for each light source acquired using the USB4000 spectrometer (dashed line: LED, integration time 1500 ms; solid line: halogen lamp, integration time 150 ms).
Fig. 2.
Linearity of lamp intensity for (A) System 1 (USB+HL), (B) System 2 (USB+LED), and (C) System 3 (Ava+HL) with different integration times. In each plot, stars, diamonds and triangles represent data at 460 nm, 550 nm, and at 610 nm, respectively. (D) The spectral profile of the two light sources (dashed line: LED; solid line: halogen).
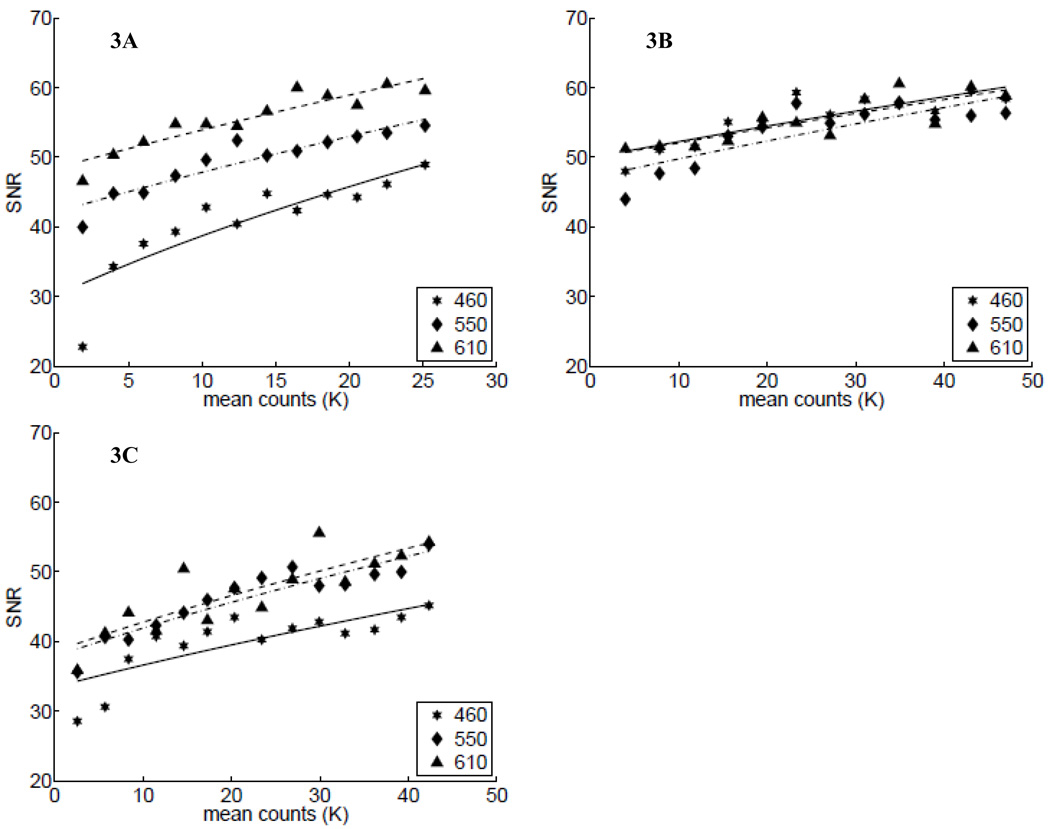
Next, we determined each assembled system’s signal-to-noise ratio (SNR). Figure 3 shows the computed SNR (symbols) at three wavelengths as a function of the mean reflectance intensity counts calculated between 450 and 650 nm. As before, Figs. 3A through 3C show these data for Systems 1–3, respectively. The lines in each of these plots show the fitting of these data by approximating the SNR using the shot-noise equation, , where, I is the mean intensity count of the signal and C is an arbitrary scalar constant. These plots indicate that the overall SNR for all systems is quite high and appears to be shot-noise limited. It is also interesting to note that the SNR for the LED-based system (Fig. 3B) was relatively independent of the wavelengths, relative to the measured SNR for the thermal sources (Figs. 3A and 3C).
Fig. 3.
SNR of the systems as a function of measured signals: (A) System 1 (USB+HL), (B) System 2 (USB+LED), and (C) System 3 (Ava+HL) with increasing signal. In each plot, stars, diamonds, and triangles represent data at 460 nm, 550 nm, and at 610 nm, which are fit to the shot-noise equation, as shown by the solid, dashed-dotted, and dashed lines, respectively (see text).
Extraction of Optical Properties from Tissue Phantoms
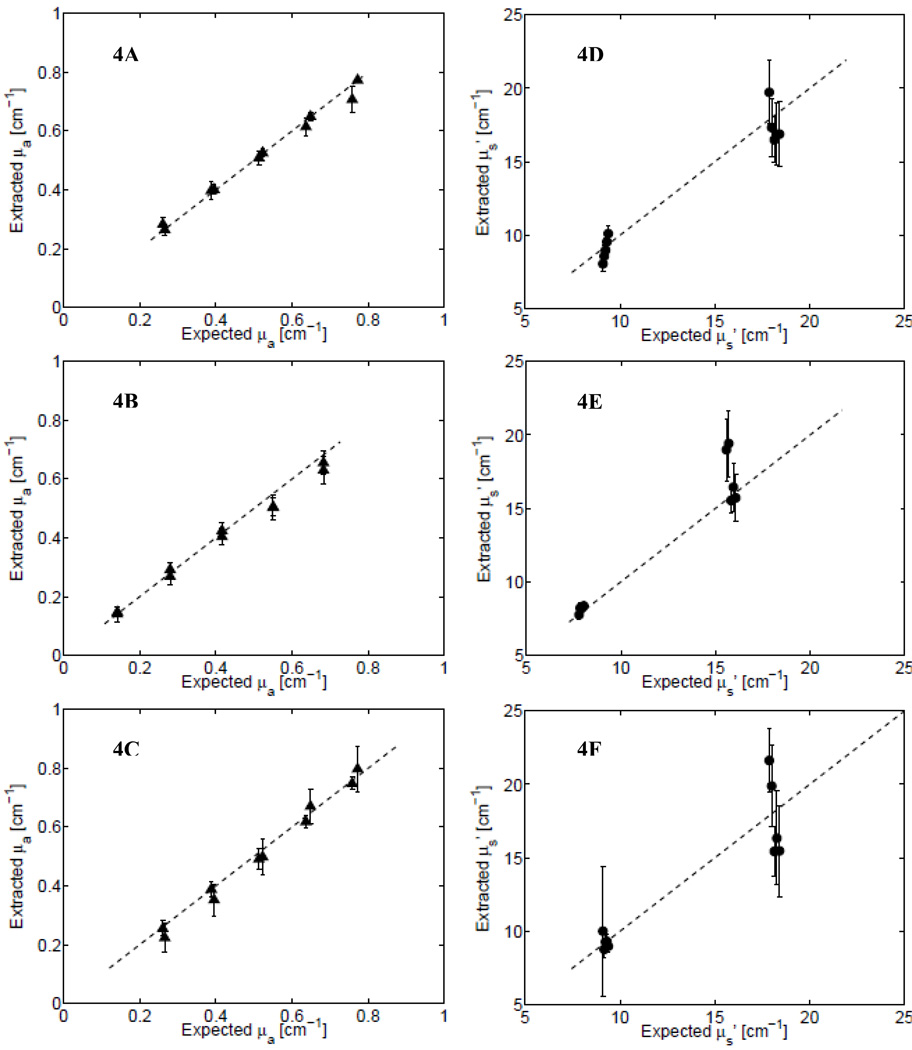
The overall performance of the instruments in reconstructing the optical properties of tissue phantoms was assessed by plotting the wavelength-averaged values of the extracted absorption and scattering coefficients (as obtained from the inverse Monte Carlo fits) in each phantom set versus their expected (ground truth) values as computed from phantom preparations. These are shown for the three instruments measured across all phantoms in Set 3 (see Table I). Figures 4A and 4D show the extracted versus expected values of the absorption and scattering coefficients, respectively, for System 1 (USB+HL); Figs. 4B and 4E show these data for System 2 (LED+HL); and Figs. 4C and 4F show them for System 3 (Ava+HL). The ability of the inverse Monte Carlo model to extract the optical properties depends on the use of a calibration standard—termed a reference phantom—and is described in detail elsewhere.25,26 The symbols in each plot of Fig. 4 represent the mean values of the wavelength-averaged extracted optical absorption (or scattering) coefficients for a given phantom, when all remaining phantoms in phantom Set 3 were used as reference phantom. Thus, the error bars for each phantom represent the variance (across all reference phantoms) in these inverted, extracted values. The mean error in the extracted optical properties, for all the phantoms in Set 3 using the best reference phantom (mean μa = 0.4 cm−1; ) was less than 6% for Systems 1 and 2 and under 10% for System 3.
Fig. 4.
Extracted vs. expected values of the absorption coefficient and scattering coefficients from measurements using Systems 1–3 on phantom Set 3. (A) Absorption (triangles) and (D) scattering (circles), respectively, for System 1; (B) absorption and (E) scattering for System 2; and (C) absorption and (F) scattering for System 3. The dashed lines shows the ideal-fit line (y = x).
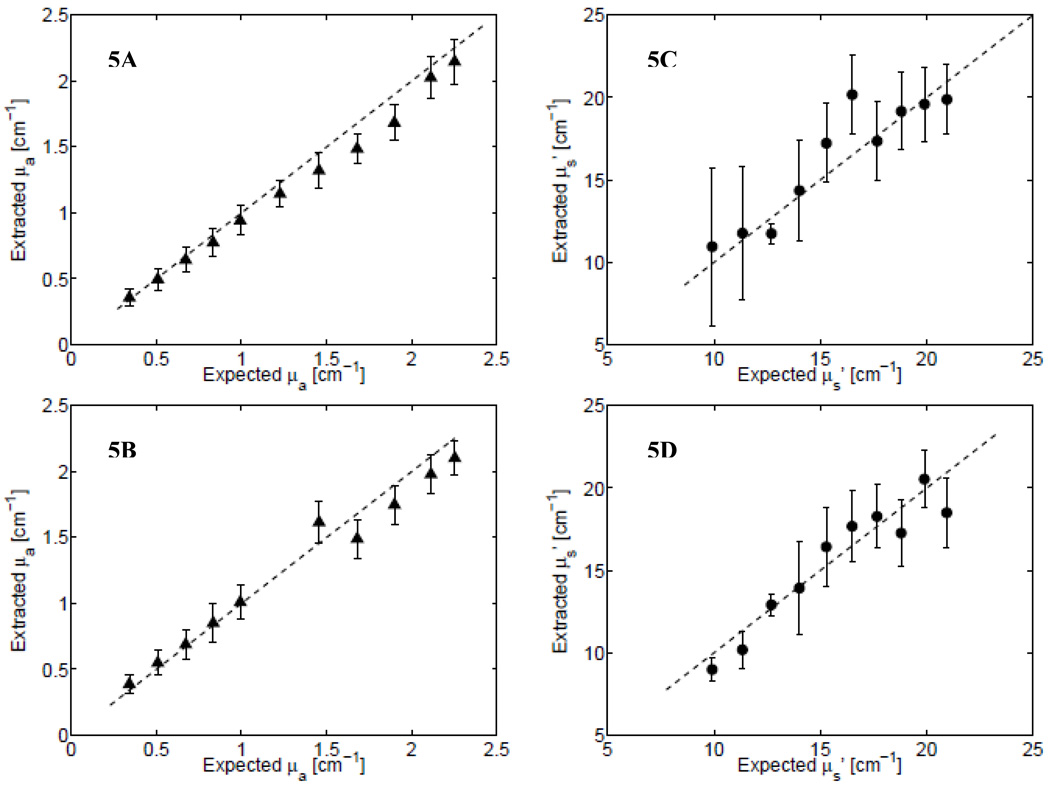
Two more experiments using phantom Set 1 and Set 2 (see Table I) were performed to test the extraction of optical properties for a wide range of absorption and scattering coefficients, using both System 1 and System 2. Figure 5A (and Fig. 5C) shows the extracted absorption (and scattering) coefficients for System 1, while Figs. 5B and 5D show these data for System 2 (Phantom Sets 1 and 2 were not measured using System 3). Figures 5A and 5B allow comparisons between Systems 1 and 2 for the absorption coefficients (Phantom Set 1), while Figs. 5C and 5D show the scattering coefficients for each system (Phantom Set 2). Again, it can be seen that the data measured using either of these two systems could extract a wide range of hemoglobin absorption (0.28–2.5 cm−1) and scattering (8–23 cm−1). As before, the symbols represent the mean value of the wavelength-averaged optical coefficient computed across inversions that systematically used each of the remaining phantom data as reference phantoms, and the error bars indicate the variance across inversions using the different reference phantoms. This range of optical absorption coefficients corresponds to 7–50 µM of hemoglobin, the oxygen saturation of which was 100%. Table III provides a summary of the mean percent errors in the extraction of absorption and scattering coefficients for each phantom set tested across all instruments.
Fig. 5.
Extracted vs. expected values of the absorption coefficient (triangles; A and B) and scattering coefficient (circles; C and D) measurements using System 1 (USB+HL; A and C) and System 2 (USB+LED; B and D). The phantoms measured in (A) and (C) are from Phantom Set 1 while the data in (B) and (D) are from Phantom Set 2 (see Table I).
TABLE III.
Summary of percent errors in extraction of optical absorption and scattering for all phantom sets tested and instruments.
| Instrument used |
% errors: Set 1 | % errors: Set 2 | % errors: Set 3 | |||||
|---|---|---|---|---|---|---|---|---|
| μa | μa | μa | ||||||
| System 1 | 10.1 ± 8.2 | 16.6 ± 11.5 | 6.2 ± 7.0 | 13.1 ± 19.5 | 4.5 ± 4.4 | 9.5 ± 6.8 | ||
| System 2 | 11.8 ± 9.8 | 16.4 ± 13.9 | 4.8 ± 4.7 | 9.8 ± 9.2 | 8.2 ± 6.5 | 8.5 ± 10.1 | ||
| System 3 | NA | NA | NA | NA | 9.6 ± 12.4 | 12.1 ± 17.4 | ||
| Skinskana | 9.8 ± 8.2 | 7.7 ± 6.3 | 7.9 ± 7.5 | 2.2 ± 1.8 | 8.4 ± 11.3 | 3.4 ± 2.1 | ||
The data for the Skinskan are taken from Ref. 26.
Validation in Small-Animal Studies
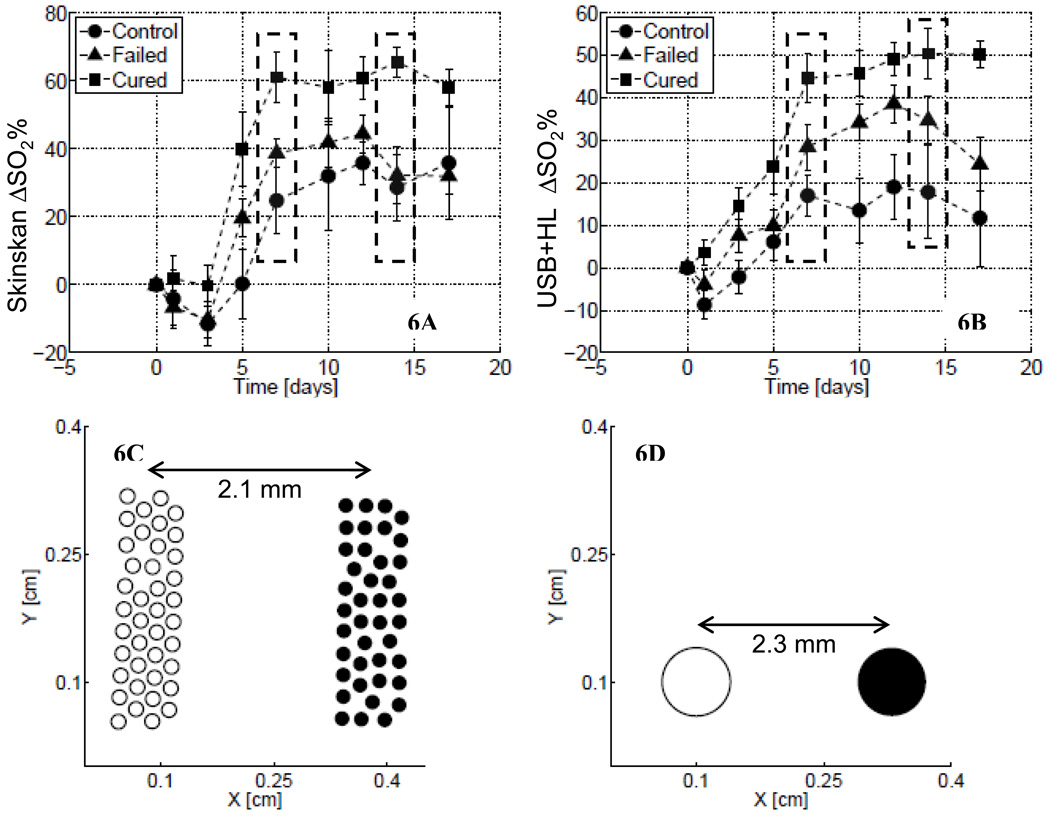
As reported previously, the optical data obtained using the Skinskan in small-animal studies showed that there were significant differences in both the magnitude and the shape of the temporal changes in mean tumor oxygen saturation following radiotherapy for treated and untreated (control) animal groups.29 The animals in the control group showed a small increase in oxygen saturation over time, while the irradiated animals with complete local control (i.e., those responding to the treatment) showed the largest and steepest increase in oxygen saturation. Figure 6 shows these longitudinal trends in the baseline-corrected tumor oxygen saturation measured using the Skinskan (Fig. 6A) and System 1 (USB+HL). The symbols in these figures represent the mean value of the baseline-corrected oxygen saturation computed across all animals in each group, while the error bar represents the standard errors. It can be seen from these figures that longitudinal trends in tumor oxygen saturation obtained using System 1 are similar to those measured using the Skinskan. The dashed boxes in Figs. 6A and 6B indicate that the tumor oxygen saturation values for the responder group on these days (days 7 and 14) were statistically different (p < 0.05, ANOVA) from the other groups. It is evident that optical data obtained from both instruments are in fairly good agreement with one another. Figures 6C and 6D show the source–detector configurations used by the Skinskan (Fig. 6C) and System 1 (Fig. 6D) to collect these data. We previously tested the ability of the commercial system to accurately extract oxygen saturation values in phantoms.26 Similar experiments were performed using System 1, which showed that this system could extract oxygen saturation in the range of 5–100% using a yeast de-saturation phantom and pO2 electrodes as described before26 (data not shown).
Fig. 6.
Longitudinally measured trends in the baseline-corrected oxygen saturation (ΔSO2) measured in small-animal studies using (A) the commercial instrument (Skinskan) and (B) System 1. In each figure, the symbols represent the mean value of ΔSO2 computed across all animals within a given group, at that time-point, while the error bars represent the standard error in those data. The squares show these trends for the group of animals that showed long-term local control, triangles for the treated animals that had local recurrence and circles for the control group. (C) and (D) depict the fiber-probe geometries used to collect the data in (A) and (B), respectively. The hollow circles indicate source fibers and filled circles are the detector fibers. Each fiber in (C) had a 200 µm core, while each fiber in (D) had a 1 mm core.
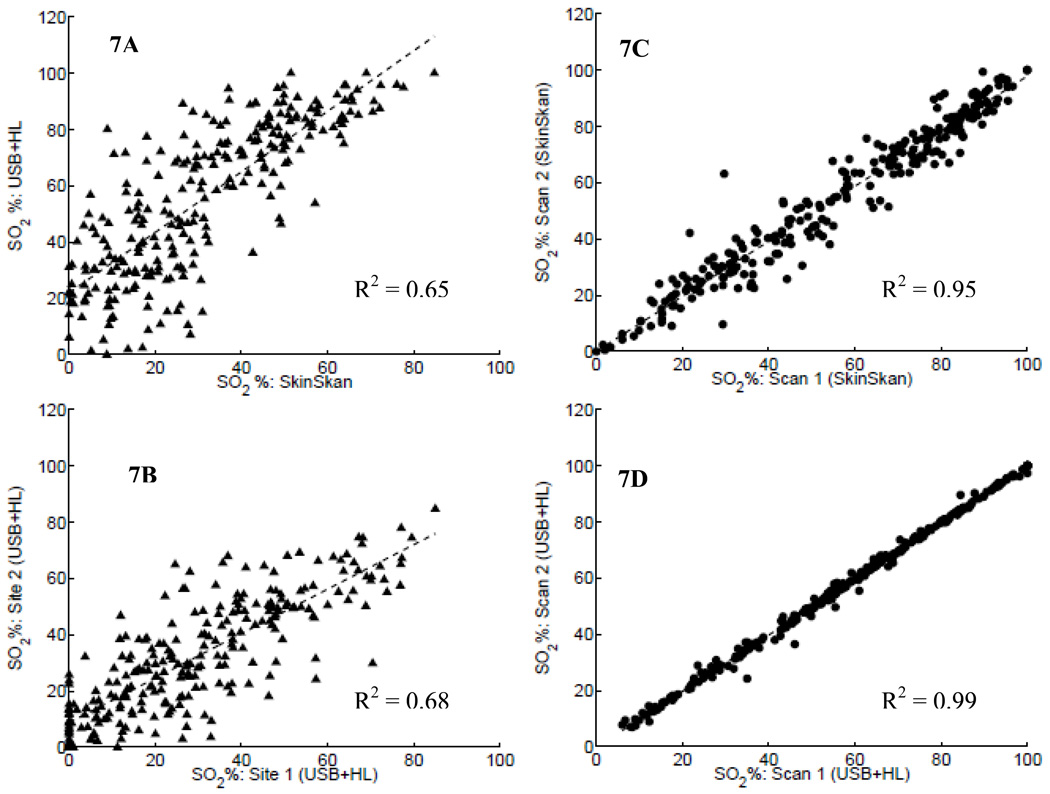
The similarity in these data were further analyzed by plotting the correlation between the tumor oxygen saturation obtained using the commercial Skinskan instrument versus the oxygen saturation estimated using System 1, as shown in Fig. 7A. The figure shows the regression line for these data along with the R2 metric indicating the strength of the correlation. The data in Fig. 7A show that there was indeed a moderate correlation (R2 = 0.65) between the data obtained from these two different instruments. It must be noted that though these data were obtained from the same individual animal’s tumor, the reflectance was measured by placing the fiber probe of the commercial instrument at a random location on the tumor, followed by placing the fiber probe of System 1 at three different locations (randomly selected) on the same tumor. Thus, the measurements from each instrument did not sample the same exact spatial regions. Moreover, the optical probes had different source–detector geometries (as shown in Figs. 6C and 6D). Thus, there was a definite mismatch in the tumor volumes probed by each instrument.
Fig. 7.
(A) The correlation in SO2 obtained using System 1 (USB+HL) and Skinskan, where these measurements were obtained from different sites on the tumor. (B) The correlation in SO2 data measured using System 1 at two different sites, on each subject. (C) and (D) The correlation in SO2 values obtained from repeated scans on the same site using the Skinskan and System 1, respectively.
In order to further explore the impact of differences in sampling volumes and spatial locations on the data measured with the two instruments, we compared the correlations in the tumor oxygen-saturation values obtained from: (a) two different sites using the same instrument (System 1, Fig. 7B) and (b) two repeated scans at a single location using either instrument (Figs. 7C and 7D). Figure 7B shows the correlations in the oxygen saturation values extracted from two scans obtained at two different locations using the portable instrument (System 1). Figure 7C shows these data for two consecutive scans obtained at a single fixed tumor location using the commercial instrument, while Fig. 7D shows the correlations between the oxygen saturation values obtained consecutively at a single fixed location using System 1.
The moderate correlations shown in the data of Figs. 7A and 7B and the strong correlations shown in Figs. 7C and 7D reflect the fact that measurements from non-identical locations correspond to variations introduced by spatial tumor heterogeneity. Given the fact that typical times to acquire a single diffuse reflectance spectrum using the small portable systems were much faster than that for the commercial Skinskan system, successive scans obtained using the USB+HL system are almost perfectly correlated (Fig. 7D), compared to the successive scans acquired by the Skinskan (Fig. 7C).
CONCLUSIONS
The purpose of this study was to design and characterize portable diffuse reflection spectroscopy systems for rapidly quantifying tissue optical properties over the visible spectral range. Three fiber-optic-based diffuse reflection spectrometers were developed by combining different optical detectors and light sources. Overall the portable systems showed significant (more than ten-fold) reduction in physical footprint and cost relative to the commercial system. These systems were characterized by measuring source drift, detector linearity, and system signal-to-noise ratios. The performance of these systems for quantitative extraction of optical properties was validated through well-controlled experiments on tissue-mimicking liquid phantoms spanning a wide range of tissue absorption and reduced scattering coefficients in the visible spectrum. Based on the overall cost and performance criteria, it appears that the USB4000+LED (System 2, Table II) showed the greatest promise for maximum portability, least power consumption, and lowest cost. The source drift for all light sources tested was negligible and was comparable to that of the commercial Skinskan system. Detector SNR was sufficiently high (>30 dB overall) for all three systems. The cumulative errors for quantitative extraction of the optical properties of the three portable systems were <10% for a wide range of scattering (7–23 cm−1) and absorption (0.2–4.5 cm−1) coefficients. These cumulative errors for extraction of optical properties were similar to those previously reported (6–10%) using the commercial Skinskan system, for nearly the same range of optical coefficients.26 Finally, the data from the animal studies indicate that these portable systems can provide a degree of accuracy similar to that of the commercial system when applied to tissue spectroscopy studies, while at the same time providing a significant advantage over the commercial systems with respect to cost, data acquisition time, and size.
ACKNOWLEDGMENTS
The authors would like to thank Dr. Yulin Zhao for assistance with tumor inoculation in the small-animal studies. K.V. would like to acknowledge support from the National Institutes of Health (1K99CA140783-01A1) for providing financial support in conducting these studies.
REFS
- 1.Welch AJ, Gemert MJCV. Optical-thermal response of laser-irradiated tissue. New York: Plenum Press; 1995. [Google Scholar]
- 2.Arridge SR, Hebden JC. Phys. Med. Biol. 1997;42:841. doi: 10.1088/0031-9155/42/5/008. [DOI] [PubMed] [Google Scholar]
- 3.Farrell TJ, Patterson MS, Wilson BC. Med. Phys. 1992;19:879. doi: 10.1118/1.596777. [DOI] [PubMed] [Google Scholar]
- 4.Hebden JC, Arridge SR, Delpy DT. Phys. Med. Biol. 1997;42:825. doi: 10.1088/0031-9155/42/5/007. [DOI] [PubMed] [Google Scholar]
- 5.Skala MC, Palmer GM, Zhu C, Liu Q, Vrotsos KM, Marshek-Stone CL, Gendron-Fitzpatrick A, Ramanujam N. Lasers Surg. Med. 2004;34:25. doi: 10.1002/lsm.10239. [DOI] [PMC free article] [PubMed] [Google Scholar]
- 6.Zhu C, Liu Q, Ramanujam N. J. Biomed. Opt. 2003;8:237. doi: 10.1117/1.1559058. [DOI] [PubMed] [Google Scholar]
- 7.Lee J, Cerussi AE, Saltzman D, Waddington T, Tromberg BJ, Brenner M. J. Biomed. Opt. 2007;12:024001. doi: 10.1117/1.2715189. [DOI] [PubMed] [Google Scholar]
- 8.Siebielec G, McCarty GW, Stuczynski TI, Reeves JB., III J. Environ. Qual. 2004;33:2056. doi: 10.2134/jeq2004.2056. [DOI] [PubMed] [Google Scholar]
- 9.Brown JQ, Vishwanath K, Palmer GM, Ramanujam N. Curr. Opin. Biotechnol. 2009;20:119. doi: 10.1016/j.copbio.2009.02.004. [DOI] [PMC free article] [PubMed] [Google Scholar]
- 10.Chance B. Near-infrared images using continuous, phase-modulated, and pulsed light with quantitation of blood and blood oxygenation. In: Alfano RR, editor. Advances in Optical Biopsy and Optical Mammography. New York: The New York Academy of Sciences; 1998. p. 29. [DOI] [PubMed] [Google Scholar]
- 11.Flotte TJ. Adv. Opt. Biopsy Opt. Mammogr., Annals NY Acad. Sci. 1998;838:143. doi: 10.1111/j.1749-6632.1998.tb08195.x. [DOI] [PubMed] [Google Scholar]
- 12.Nishioka NS. Can. J. Gastroent. 2003;17:376. doi: 10.1155/2003/824281. [DOI] [PubMed] [Google Scholar]
- 13.Suhr MA, Hopper C, Jones L, George JG, Bown SG, MacRobert AJ. Int. J. Oral Maxillofacial Surg. 2000;29:453. [PubMed] [Google Scholar]
- 14.Svanberg K, Klinteberg C, Nilsson A, Wang I, Andersson-Engels S, Svanberg S. Adv. Opt. Biopsy Opt. Mammogr., Annals NY Acad. Sci. 1998;838:123. doi: 10.1111/j.1749-6632.1998.tb08193.x. [DOI] [PubMed] [Google Scholar]
- 15.Vo-Dinh T, Panjehpour M, Overholt B. Laser-induced fluorescence for esophageal cancer and dysplasia diagnosis. In: Alfano RR, editor. Advances in Optical Biopsy and Optical Mammography. New York: The New York Academy of Sciences; 1998. p. 116. [DOI] [PubMed] [Google Scholar]
- 16.Zonios G, Cothren R, Crawford JM, Fitzmaurice M, Manoharan R, Van-Dam J, Feld MS. Adv. Opt. Biopsy Opt. Mammogr., Annals NY Acad. Sci. 1998;838:108. doi: 10.1111/j.1749-6632.1998.tb08191.x. [DOI] [PubMed] [Google Scholar]
- 17.Chandra M, Scheiman J, Heidt D, Simeone D, McKenna B, Mycek MA. J. Biomed. Opt. 2007;12:060501. doi: 10.1117/1.2818029. [DOI] [PubMed] [Google Scholar]
- 18.Chandra M, Vishwanath K, Fichter GD, Liao E, Hollister SJ, Mycek MA. Opt. Exp. 2006;14:6157. doi: 10.1364/oe.14.006157. [DOI] [PubMed] [Google Scholar]
- 19.Schwarz RA, Gao W, Daye D, Williams MD, Richards-Kortum R, Gillenwater AM. Appl. Opt. 2008;47:825. doi: 10.1364/ao.47.000825. [DOI] [PMC free article] [PubMed] [Google Scholar]
- 20.Lin WC, Mahadevan-Jansen A, Johnson MD, Weil RJ, Toms SA. Neurosurgery. 2005;57:518. doi: 10.1227/01.neu.0000170559.48166.ac. [DOI] [PubMed] [Google Scholar]
- 21.Breslin TM, Xu F, Palmer GM, Zhu C, Gilchrist KW, Ramanujam N. Ann. Surg. Oncol. 2004;11:65. doi: 10.1007/BF02524348. [DOI] [PubMed] [Google Scholar]
- 22.Yu B, Lo JY, Kuech TF, Palmer GM, Bender JE, Ramanujam N. J. Biomed. Opt. 2008;13:060505. doi: 10.1117/1.3041500. [DOI] [PubMed] [Google Scholar]
- 23.Sharma V, Kashyap D, Mathker A, Narvenkar S, Bensalah K, Kabbani W, Tuncel A, Cadeddu JA, Liu H. Conf. Proc. IEEE Eng. Med. Biol. Soc. 2009;2009:118. doi: 10.1109/IEMBS.2009.5334830. [DOI] [PubMed] [Google Scholar]
- 24.Winey BA, Misic V, Liao L, Parker K, Fenton BM, Yu Y. Med. Phys. 2006;33:1623. doi: 10.1118/1.2198196. [DOI] [PubMed] [Google Scholar]
- 25.Palmer GM, Ramanujam N. Appl. Opt. 2006;45:1062. doi: 10.1364/ao.45.001062. [DOI] [PubMed] [Google Scholar]
- 26.Bender JE, Vishwanath K, Moore LK, Brown JQ, Chang V, Palmer GM, Ramanujam N. IEEE Trans. Biomed. Eng. 2009;56:960. doi: 10.1109/TBME.2008.2005994. [DOI] [PMC free article] [PubMed] [Google Scholar]
- 27.Yang Y, Celmer EJ, Koutcher JA, Alfano RR. Photochem. Photobiol. 2002;75:627. doi: 10.1562/0031-8655(2002)075<0627:dapccb>2.0.co;2. [DOI] [PubMed] [Google Scholar]
- 28.Brown JQ, Wilke LG, Geradts J, Kennedy SA, Palmer GM, Ramanujam N. Cancer Res. 2009;69:2919. doi: 10.1158/0008-5472.CAN-08-3370. [DOI] [PMC free article] [PubMed] [Google Scholar]
- 29.Vishwanath K, Klein D, Chang K, Schroeder T, Dewhirst MW, Ramanujam N. J. Biomed. Opt. 2009;14:4. doi: 10.1117/1.3251013. [DOI] [PMC free article] [PubMed] [Google Scholar]
- 30.Vishwanath K, Yuan H, Barry WT, Dewhirst MW, Ramanujam N. Neoplasia. 2009;11:889. doi: 10.1593/neo.09580. [DOI] [PMC free article] [PubMed] [Google Scholar]
- 31.Palmer GM, Zhu C, Breslin TM, Xu F, Gilchrist KW, Ramanujam N. Appl. Opt. 2006;45:1072. doi: 10.1364/ao.45.001072. [DOI] [PubMed] [Google Scholar]


